# API Introduction
Source: https://docs.phare.io/api-reference/introduction
Create programmatic interactions with the Phare API.
Please be aware that **the Phare API is currently in beta** and is subject to change.
Welcome, this API allows you to interact programmatically with the Phare platform, enabling seamless integration and automation of almost everything that can be done in your control panel.
## Create an API key
Only team members with the **Owner** or **Admin** role can create an API key in your organization.
To access the Phare API, you will need to create an API key with the right accesses, this can be done in your control panel.
While creating an API key, you will be able to choose an access scope (Read / Write) for each Phare product as well as access to the resources of the Phare platform. You can find the list of available endpoints in the left navigation of this documentation.
You can create as many keys as necessary to fit your use case.
## Authentication
The Phare API uses Bearer Token Authentication to secure access to its endpoints. To authenticate your requests, include the API key in the Authorization header of your HTTP requests. The format for this header is as follows:
```bash Request Authorization header
Authorization: Bearer YOUR_API_KEY
```
Here’s an example of a cURL command to list the monitors in your project using your API key:
```sh
curl \
-X GET "https://api.phare.io/uptime/monitors" \
-H "Authorization: Bearer YOUR_API_KEY"
```
Keep your API key confidential at all time. Do not share it publicly or expose it in client-side code.
If you suspect that your API key has been compromised, revoke it immediately through your control panel and generate a new one.
## Rate limiting
Access to the API is currently rate limited to **100 calls per minute** across your organization. This means that all the API keys in your organization will share the same rate limiting.
***
If you are missing an API endpoint or need a custom rate limit for your organization, feel free to [contact us](mailto:support@phare.io), we'll be happy to find a solution for your use case.
# Create an alert rule
Source: https://docs.phare.io/api-reference/platform/alert-rules/create-an-alert-rule
post /alert-rules
Create an alert rule
Please be aware that **the Phare API is currently in beta** and is subject to change.
# Delete an alert rule
Source: https://docs.phare.io/api-reference/platform/alert-rules/delete-an-alert-rule
delete /alert-rules/{alertRuleId}
Delete an alert rule by ID
Please be aware that **the Phare API is currently in beta** and is subject to change.
# Get an alert rule
Source: https://docs.phare.io/api-reference/platform/alert-rules/get-an-alert-rule
get /alert-rules/{alertRuleId}
Get an alert rule by ID
Please be aware that **the Phare API is currently in beta** and is subject to change.
# List alert rules
Source: https://docs.phare.io/api-reference/platform/alert-rules/list-alert-rules
get /alert-rules
Get a paginated list of alert rules.
Please be aware that **the Phare API is currently in beta** and is subject to change.
# Update an alert rule
Source: https://docs.phare.io/api-reference/platform/alert-rules/update-an-alert-rule
post /alert-rules/{alertRuleId}
Update an alert rule by ID
Please be aware that **the Phare API is currently in beta** and is subject to change.
# Get API info
Source: https://docs.phare.io/api-reference/platform/get-api-info
get /
Get basic API information
Please be aware that **the Phare API is currently in beta** and is subject to change.
# Delete an incident
Source: https://docs.phare.io/api-reference/uptime/incidents/delete-an-incident
delete /uptime/incidents/{incidentId}
Delete an incident by ID
Please be aware that **the Phare API is currently in beta** and is subject to change.
# Get an incident
Source: https://docs.phare.io/api-reference/uptime/incidents/get-an-incident
get /uptime/incidents/{incidentId}
Get an incident by ID
Please be aware that **the Phare API is currently in beta** and is subject to change.
# List incidents
Source: https://docs.phare.io/api-reference/uptime/incidents/list-incidents
get /uptime/incidents
Get a paginated list of incidents
Please be aware that **the Phare API is currently in beta** and is subject to change.
# Create a monitor
Source: https://docs.phare.io/api-reference/uptime/monitors/create-a-monitor
post /uptime/monitors
Create a monitor
Please be aware that **the Phare API is currently in beta** and is subject to change.
# Delete a monitor
Source: https://docs.phare.io/api-reference/uptime/monitors/delete-a-monitor
delete /uptime/monitors/{monitorId}
Delete a monitor by ID
Please be aware that **the Phare API is currently in beta** and is subject to change.
# Get a monitor
Source: https://docs.phare.io/api-reference/uptime/monitors/get-a-monitor
get /uptime/monitors/{monitorId}
Get a monitor by ID
Please be aware that **the Phare API is currently in beta** and is subject to change.
# List monitors
Source: https://docs.phare.io/api-reference/uptime/monitors/list-monitors
get /uptime/monitors
Get a paginated list of monitors
Please be aware that **the Phare API is currently in beta** and is subject to change.
# Pause a monitor
Source: https://docs.phare.io/api-reference/uptime/monitors/pause-a-monitor
post /uptime/monitors/{monitorId}/pause
Pause a monitor by ID
Please be aware that **the Phare API is currently in beta** and is subject to change.
# Resume a monitor
Source: https://docs.phare.io/api-reference/uptime/monitors/resume-a-monitor
post /uptime/monitors/{monitorId}/resume
Resume a monitor by ID
Please be aware that **the Phare API is currently in beta** and is subject to change.
# Update a monitor
Source: https://docs.phare.io/api-reference/uptime/monitors/update-a-monitor
post /uptime/monitors/{monitorId}
Update a monitor by ID
Please be aware that **the Phare API is currently in beta** and is subject to change.
# Create a status page
Source: https://docs.phare.io/api-reference/uptime/status-pages/create-a-status-page
post /uptime/status-pages
Create a status page
Please be aware that **the Phare API is currently in beta** and is subject to change.
# Delete a status page
Source: https://docs.phare.io/api-reference/uptime/status-pages/delete-a-status-page
delete /uptime/status-pages/{statusPageId}
Delete a status page by ID
Please be aware that **the Phare API is currently in beta** and is subject to change.
# Get a status page
Source: https://docs.phare.io/api-reference/uptime/status-pages/get-a-status-page
get /uptime/status-pages/{statusPageId}
Get a status page by ID
Please be aware that **the Phare API is currently in beta** and is subject to change.
# Get a status page current status
Source: https://docs.phare.io/api-reference/uptime/status-pages/get-a-status-page-current-status
get /uptime/status-pages/{statusPageId}/current-status
Get a status page current status by ID
Please be aware that **the Phare API is currently in beta** and is subject to change.
# List status pages
Source: https://docs.phare.io/api-reference/uptime/status-pages/list-status-pages
get /uptime/status-pages
Get a paginated list of status pages
Please be aware that **the Phare API is currently in beta** and is subject to change.
# Update a status page
Source: https://docs.phare.io/api-reference/uptime/status-pages/update-a-status-page
post /uptime/status-pages/{statusPageId}
Update a status page by ID
Please be aware that **the Phare API is currently in beta** and is subject to change.
# Changelog of 2023
Source: https://docs.phare.io/changelog/platform/2023
Follow the updates and improvements made to the Phare platform in 2023.
## Alert policy duplication
*December 17th, 2023*
You can now duplicate an entire alert policy with all its rules to adapt Phare to how your company needs to be alerted.
***
## Status pages RSS and ATOM feed
*November 4th, 2023*
Status pages now offer an incident feed in RSS and ATOM format to let your users get updates on incidents.
***
## Status pages brand logo and feed subscription
*November 2nd, 2023*
You can now add your brand logo to your status page, which will be displayed in the top left corner of the page. Current and past incidents are now shown on the status page, and your users can subscribe to an RSS or Atom feed to get updates on incidents.
 ***
## Incident comments
*October 29th, 2023*
To help you resolve incidents faster, project members can now comment on the incident timeline. Comments can be written using a rich text editor, and are compatible with the Markdown syntax.
***
## Incident comments
*October 29th, 2023*
To help you resolve incidents faster, project members can now comment on the incident timeline. Comments can be written using a rich text editor, and are compatible with the Markdown syntax.
 ***
## Incident impact
*October 27th, 2023*
The design of the incident management page has been improved, with all actions now part of the timeline. You can now select an impact level for your incidents.
***
## Incident impact
*October 27th, 2023*
The design of the incident management page has been improved, with all actions now part of the timeline. You can now select an impact level for your incidents.
 ***
## Admin user role
*October 23rd, 2023*
A new **Admin** role is now available. This role is similar to the former **Owner** role, with the exception that it can't delete the organization, making it easier to share the management of an organization with other team members.
You can review the available permissions of each role in the [user management documentation](https://docs.phare.io/user-management). Role can be modified on existing users, as well as directly when inviting a new user.
***
## Admin user role
*October 23rd, 2023*
A new **Admin** role is now available. This role is similar to the former **Owner** role, with the exception that it can't delete the organization, making it easier to share the management of an organization with other team members.
You can review the available permissions of each role in the [user management documentation](https://docs.phare.io/user-management). Role can be modified on existing users, as well as directly when inviting a new user.
 ***
## Status pages
*October 21st, 2023*
Status pages are now available for all users, and they're **the most carbon-efficient status page on the market with an incredibly fast load time**. You can create unlimited status pages with a phare domain name, and personalize it with limited branding options.
***
## Status pages
*October 21st, 2023*
Status pages are now available for all users, and they're **the most carbon-efficient status page on the market with an incredibly fast load time**. You can create unlimited status pages with a phare domain name, and personalize it with limited branding options.
 ***
## European mail server
*September 17th, 2023*
The mail server used to send you alert notifications has been moved to a new provider based in Europe, making Phare 100% european for non-subscribed users. This is part of Phare commitment to privacy and data protection, using only services from companies that are headquartered in Europe and hosted in european datacenters.
The only exception is Stripe, a US-based company used to process billing information and payments.
***
## New branding
*August 21st, 2023*
Bye bye MinKit and hello Phare! The platform has been renamed to Phare and has a new logo. The new name is a reference to the lighthouse, a beacon of light that helps ships navigate safely. This symbole is a good representation of our mission to give you a signal when you need it so that you can run high quality production websites.
We hope that you like the new name and logo.
The old domain name `minkit.io` will continue to work for about a year, but you should update your bookmarks and password manager as soon as possible to avoid any inconvenience in the future.
***
## European mail server
*September 17th, 2023*
The mail server used to send you alert notifications has been moved to a new provider based in Europe, making Phare 100% european for non-subscribed users. This is part of Phare commitment to privacy and data protection, using only services from companies that are headquartered in Europe and hosted in european datacenters.
The only exception is Stripe, a US-based company used to process billing information and payments.
***
## New branding
*August 21st, 2023*
Bye bye MinKit and hello Phare! The platform has been renamed to Phare and has a new logo. The new name is a reference to the lighthouse, a beacon of light that helps ships navigate safely. This symbole is a good representation of our mission to give you a signal when you need it so that you can run high quality production websites.
We hope that you like the new name and logo.
The old domain name `minkit.io` will continue to work for about a year, but you should update your bookmarks and password manager as soon as possible to avoid any inconvenience in the future.
 ***
## Improved monitoring page
*August 18th, 2023*
Visualisation of incident periods in the performance chart has been improved, and you can now get your website's average response time, cumulated downtime and availability % for the selected time period (24 hours, 7 days, 30 days or 90 days).
***
## Improved monitoring page
*August 18th, 2023*
Visualisation of incident periods in the performance chart has been improved, and you can now get your website's average response time, cumulated downtime and availability % for the selected time period (24 hours, 7 days, 30 days or 90 days).
 ***
## Faster monitoring statistics
*August 17th, 2023*
A lot of work has been done to improve the monitoring statistics. With 15M records in the database, it was starting to be a bit slow to load monitoring results for our own standard, because we're obsessed with speed. [ClickHouse](https://clickhouse.com/) came to the rescue, saving up to 500ms on every page load. If you visit your monitoring page twice a day, that's 6 minutes of your life saved every year! You're welcome.
***
## Reviews
*August 15th, 2023*
A new review page has been added to the website with a list of all the places where you can leave a review of the platform. If you like Phare, please consider leaving an honest review on one of these platforms. The first 85 reviews created on Capterra will **receive a \$20 gift card**!
***
## Faster monitoring statistics
*August 17th, 2023*
A lot of work has been done to improve the monitoring statistics. With 15M records in the database, it was starting to be a bit slow to load monitoring results for our own standard, because we're obsessed with speed. [ClickHouse](https://clickhouse.com/) came to the rescue, saving up to 500ms on every page load. If you visit your monitoring page twice a day, that's 6 minutes of your life saved every year! You're welcome.
***
## Reviews
*August 15th, 2023*
A new review page has been added to the website with a list of all the places where you can leave a review of the platform. If you like Phare, please consider leaving an honest review on one of these platforms. The first 85 reviews created on Capterra will **receive a \$20 gift card**!
 ***
## Deletion safeguard
*July 29th, 2023*
A new safeguard has been added to the platform to prevent accidental deletion of important data. When you try to delete your user account, a project, or your organization, you will be asked to confirm your action with a small typing challenge. This will prevent you from accidentally deleting your account or organization.
***
## Deletion safeguard
*July 29th, 2023*
A new safeguard has been added to the platform to prevent accidental deletion of important data. When you try to delete your user account, a project, or your organization, you will be asked to confirm your action with a small typing challenge. This will prevent you from accidentally deleting your account or organization.
 ***
## Alert rules duplication
*July 28th, 2023*
You can now duplicate an alert rule to rapidly create a new one with the same configuration. This is useful if you want to create a new alert rule with a similar configuration to an existing one.
***
## Alert rules duplication
*July 28th, 2023*
You can now duplicate an alert rule to rapidly create a new one with the same configuration. This is useful if you want to create a new alert rule with a similar configuration to an existing one.
 ***
## Performance monitoring history
*June 4th, 2023*
It is now possible to navigate the performance history of your monitors, with three available time ranges of 24 hours, 7 days and 90 days. This is a first step towards giving you more flexibility on how you view and access your monitoring data.
***
## Performance monitoring history
*June 4th, 2023*
It is now possible to navigate the performance history of your monitors, with three available time ranges of 24 hours, 7 days and 90 days. This is a first step towards giving you more flexibility on how you view and access your monitoring data.
 ***
## Improved uptime precision
*May 29th, 2023*
Uptime percentage is now calculated with four digits precision which allows us to better calculate your long time SLA. For example, 99.9999% uptime means that your service can be down for 31 seconds per year.
Badges also got updated with four digits precision.
***
## Improved uptime precision
*May 29th, 2023*
Uptime percentage is now calculated with four digits precision which allows us to better calculate your long time SLA. For example, 99.9999% uptime means that your service can be down for 31 seconds per year.
Badges also got updated with four digits precision.
 ***
## Incident events improvements
*May 27th, 2023*
Incident events now show more precise date and time information. With the exact time of the event, and the elapsed time since the creation of the incident.
***
## Incident events improvements
*May 27th, 2023*
Incident events now show more precise date and time information. With the exact time of the event, and the elapsed time since the creation of the incident.
 A tooltip with the exact date and time is also available on hover of all the already existing dates and times in the Phare dashboard.
 ***
## Multi-quota billing alerts
*May 17th, 2023*
A fairly technical feature, but important for the future of the platform. With the release of the SMS integration last week, we now offer two different billing quotas: SMS alerts and monitoring events. The billing alert system, which is responsible for sending you emails when a quota is exhausted, was the last piece of the billing infrastructure that only supported Monitoring events.
In simpler terms, the platform now has all the required foundation to bill anything, as part of a monthly plan or as additional usage. New feature will not require work on the billing infrastructure anymore, allowing me to ship faster!
***
## Multi-quota billing alerts
*May 17th, 2023*
A fairly technical feature, but important for the future of the platform. With the release of the SMS integration last week, we now offer two different billing quotas: SMS alerts and monitoring events. The billing alert system, which is responsible for sending you emails when a quota is exhausted, was the last piece of the billing infrastructure that only supported Monitoring events.
In simpler terms, the platform now has all the required foundation to bill anything, as part of a monthly plan or as additional usage. New feature will not require work on the billing infrastructure anymore, allowing me to ship faster!
 ***
## Integrations documentation
*May 14th, 2023*
The [documentation for the integrations](https://docs.phare.io/integrations/overview) has been created, mostly to include information on the new SMS integration. You can find a few tips on configuration, supported country, the address email and phone numbers we use to send alerts, and much more.
***
## Integrations documentation
*May 14th, 2023*
The [documentation for the integrations](https://docs.phare.io/integrations/overview) has been created, mostly to include information on the new SMS integration. You can find a few tips on configuration, supported country, the address email and phone numbers we use to send alerts, and much more.
 ***
## SMS integration
*May 13th, 2023*
Phare now offers SMS alerts! You can receive SMS alerts by configuring the new SMS integration. The SMS integration is only available on the Scale plan with 100 alerts included monthly.
***
## SMS integration
*May 13th, 2023*
Phare now offers SMS alerts! You can receive SMS alerts by configuring the new SMS integration. The SMS integration is only available on the Scale plan with 100 alerts included monthly.
 You can add a phone number to their profile, which will be used to send SMS alerts. You will have to validate your phone number by entering a code sent by SMS. Team members that do not yet confirm a phone number can still be added to the SMS integration, but they will not receive the SMS alerts, a fallback solution will be added in the future.
 ***
## Improved design
*May 10th, 2023*
The [home](https://phare.io) and [pricing](https://phare.io/pricing) pages got updated with frostier design; we hope that you like as much as we do. A few other pages got updated as well to improve consistency across the website.
***
## Improved design
*May 10th, 2023*
The [home](https://phare.io) and [pricing](https://phare.io/pricing) pages got updated with frostier design; we hope that you like as much as we do. A few other pages got updated as well to improve consistency across the website.
 ***
## Public launch
*May 5th, 2023*
The public launch on [ProductHunt](https://www.producthunt.com/posts/phare-uptime) went well, we're happy to see the first unsolicited users signing up and using the platform. We're also happy to see that the platform is stable and reliable, as only a few minor bugs were reported and fixed since the launch.
Thanks to everyone who voted for us on ProductHunt and participated in any way to the launch, it means a lot.
During the same period, we also acquired our first paying customer, which is a great milestone for the project.
***
## Public launch
*May 5th, 2023*
The public launch on [ProductHunt](https://www.producthunt.com/posts/phare-uptime) went well, we're happy to see the first unsolicited users signing up and using the platform. We're also happy to see that the platform is stable and reliable, as only a few minor bugs were reported and fixed since the launch.
Thanks to everyone who voted for us on ProductHunt and participated in any way to the launch, it means a lot.
During the same period, we also acquired our first paying customer, which is a great milestone for the project.
 ***
## Documentation
*May 4th, 2023*
Documentation has been published, it's still a work in progress, but it's already a great resource to learn about what our platform has to offer and how to use it.
***
## Documentation
*May 4th, 2023*
Documentation has been published, it's still a work in progress, but it's already a great resource to learn about what our platform has to offer and how to use it.
 ***
## Bunny CDN
*April 10th, 2023*
This week we migrated from [Cloudflare](https://www.cloudflare.com/) to [Bunny.net](https://bunny.net/). Bunny is a reliable content delivery platform with lightning-fast performances, making our platform even faster than before.
***
## Bunny CDN
*April 10th, 2023*
This week we migrated from [Cloudflare](https://www.cloudflare.com/) to [Bunny.net](https://bunny.net/). Bunny is a reliable content delivery platform with lightning-fast performances, making our platform even faster than before.
 But speed is not the only reason we spent a few days to migrate our service. Bunny is a European Union company, based in Slovenia.
This migration is part of our effort to rely as much as possible on European provider and ensure maximum privacy to our users.
***
## Billing overage management
*April 09th, 2023*
One feature was missing in the billing cycle released last week, managing overage, which occurs when your organization consumes more events than allowed in its subscription plan. You will now receive two emails, when 90% and 100% of your monthly allowed quota has been used. A free overage of 10 additional percent is offered before your account gets locked until the next billing period, or until you subscribe or upgrade your plan.
But speed is not the only reason we spent a few days to migrate our service. Bunny is a European Union company, based in Slovenia.
This migration is part of our effort to rely as much as possible on European provider and ensure maximum privacy to our users.
***
## Billing overage management
*April 09th, 2023*
One feature was missing in the billing cycle released last week, managing overage, which occurs when your organization consumes more events than allowed in its subscription plan. You will now receive two emails, when 90% and 100% of your monthly allowed quota has been used. A free overage of 10 additional percent is offered before your account gets locked until the next billing period, or until you subscribe or upgrade your plan.
 ***
## End of beta
*April 8th, 2023*
With 3.5M checks successfully performed, 272 incidents reported, and 639 notifications sent, we can confidently say all systems are stable enough to end the beta program. The last 6 weeks have been productive, with lots of features and improvements on the platform, and we heard a public launch might happen in early May!
If you would like to support our launch on ProductHunt, you can [subscribe here to get notified](https://www.producthunt.com/products/phare).
***
## Paid plan activation
*April 6th, 2023*
With the end of the beta program incoming, the payment integration has been activated, which means no more unlimited usage on the free plan! We spent most of this week making sure the billing system was working as expected, and that monitoring events are reported fairly every month.
***
## Incidents on performance chart
*April 2nd, 2023*
A small change, but a welcome one to the performance chart, as you can now see incidents directly, and how they impact your website performance.
***
## End of beta
*April 8th, 2023*
With 3.5M checks successfully performed, 272 incidents reported, and 639 notifications sent, we can confidently say all systems are stable enough to end the beta program. The last 6 weeks have been productive, with lots of features and improvements on the platform, and we heard a public launch might happen in early May!
If you would like to support our launch on ProductHunt, you can [subscribe here to get notified](https://www.producthunt.com/products/phare).
***
## Paid plan activation
*April 6th, 2023*
With the end of the beta program incoming, the payment integration has been activated, which means no more unlimited usage on the free plan! We spent most of this week making sure the billing system was working as expected, and that monitoring events are reported fairly every month.
***
## Incidents on performance chart
*April 2nd, 2023*
A small change, but a welcome one to the performance chart, as you can now see incidents directly, and how they impact your website performance.
 ***
## Frequently asked questions
*April 1st, 2023*
The pricing page now shows some frequently asked questions that I hope makes everything clearer about how Phare works. This is a small first step to fully fledged documentation.
***
## Frequently asked questions
*April 1st, 2023*
The pricing page now shows some frequently asked questions that I hope makes everything clearer about how Phare works. This is a small first step to fully fledged documentation.
 ***
## Stress test
*March 28th, 2023*
To make sure that our platform continues to work flawlessly under load, thousands of test monitors have been created for a few days to expose any performance weakness. We could identify a few culprits in the way we calculated uptime average and stored monitoring results, that are now fixed.
On older monitors, the statistic page could take up to a second to show, which is not on par with the rest of the platform in terms of performance. It has been improved and should now be displayed in under 100ms.
***
## Pagination
*March 26th, 2023*
Dealing with so many monitors was impossible without a pagination, which is now active on most pages like projects, environments, monitors, incidents, and alert policies.
***
## Stress test
*March 28th, 2023*
To make sure that our platform continues to work flawlessly under load, thousands of test monitors have been created for a few days to expose any performance weakness. We could identify a few culprits in the way we calculated uptime average and stored monitoring results, that are now fixed.
On older monitors, the statistic page could take up to a second to show, which is not on par with the rest of the platform in terms of performance. It has been improved and should now be displayed in under 100ms.
***
## Pagination
*March 26th, 2023*
Dealing with so many monitors was impossible without a pagination, which is now active on most pages like projects, environments, monitors, incidents, and alert policies.
 ***
## Authentication pages redesign
*March 24th, 2023*
A small redesign of the authentication pages was made to make the pages more coherent with the overall design of the new landing pages created last week.
***
## Authentication pages redesign
*March 24th, 2023*
A small redesign of the authentication pages was made to make the pages more coherent with the overall design of the new landing pages created last week.
 ***
## Legal
*March 22nd, 2023*
We published our [terms of services](https://phare.io/legal/terms-of-service) and [privacy policy](https://phare.io/legal/privacy-policy). This was not the funniest task, but a necessary one as we approach open beta.
***
## Improved billing
*March 19th, 2023*
Billing is not yet active during the private beta, giving time to make sure everything is simple and works as expected. Wording around plans, billing, and quotas have been reviewed and changed to make things easier to understand. The offer is also simplified with a limited free (Hobby) plan, and a single paid (Scale) plan. The paid plan, as the name suggests, grows with your organization needs thanks to additional quotas that can be configured.
A detailed pricing calculator is now available on a new [pricing page](https://phare.io/pricing).
The billing page presents a fresh look with more detailed information on included and additional usage for all products:
***
## Legal
*March 22nd, 2023*
We published our [terms of services](https://phare.io/legal/terms-of-service) and [privacy policy](https://phare.io/legal/privacy-policy). This was not the funniest task, but a necessary one as we approach open beta.
***
## Improved billing
*March 19th, 2023*
Billing is not yet active during the private beta, giving time to make sure everything is simple and works as expected. Wording around plans, billing, and quotas have been reviewed and changed to make things easier to understand. The offer is also simplified with a limited free (Hobby) plan, and a single paid (Scale) plan. The paid plan, as the name suggests, grows with your organization needs thanks to additional quotas that can be configured.
A detailed pricing calculator is now available on a new [pricing page](https://phare.io/pricing).
The billing page presents a fresh look with more detailed information on included and additional usage for all products:
 ***
## Members management
*March 15th, 2023*
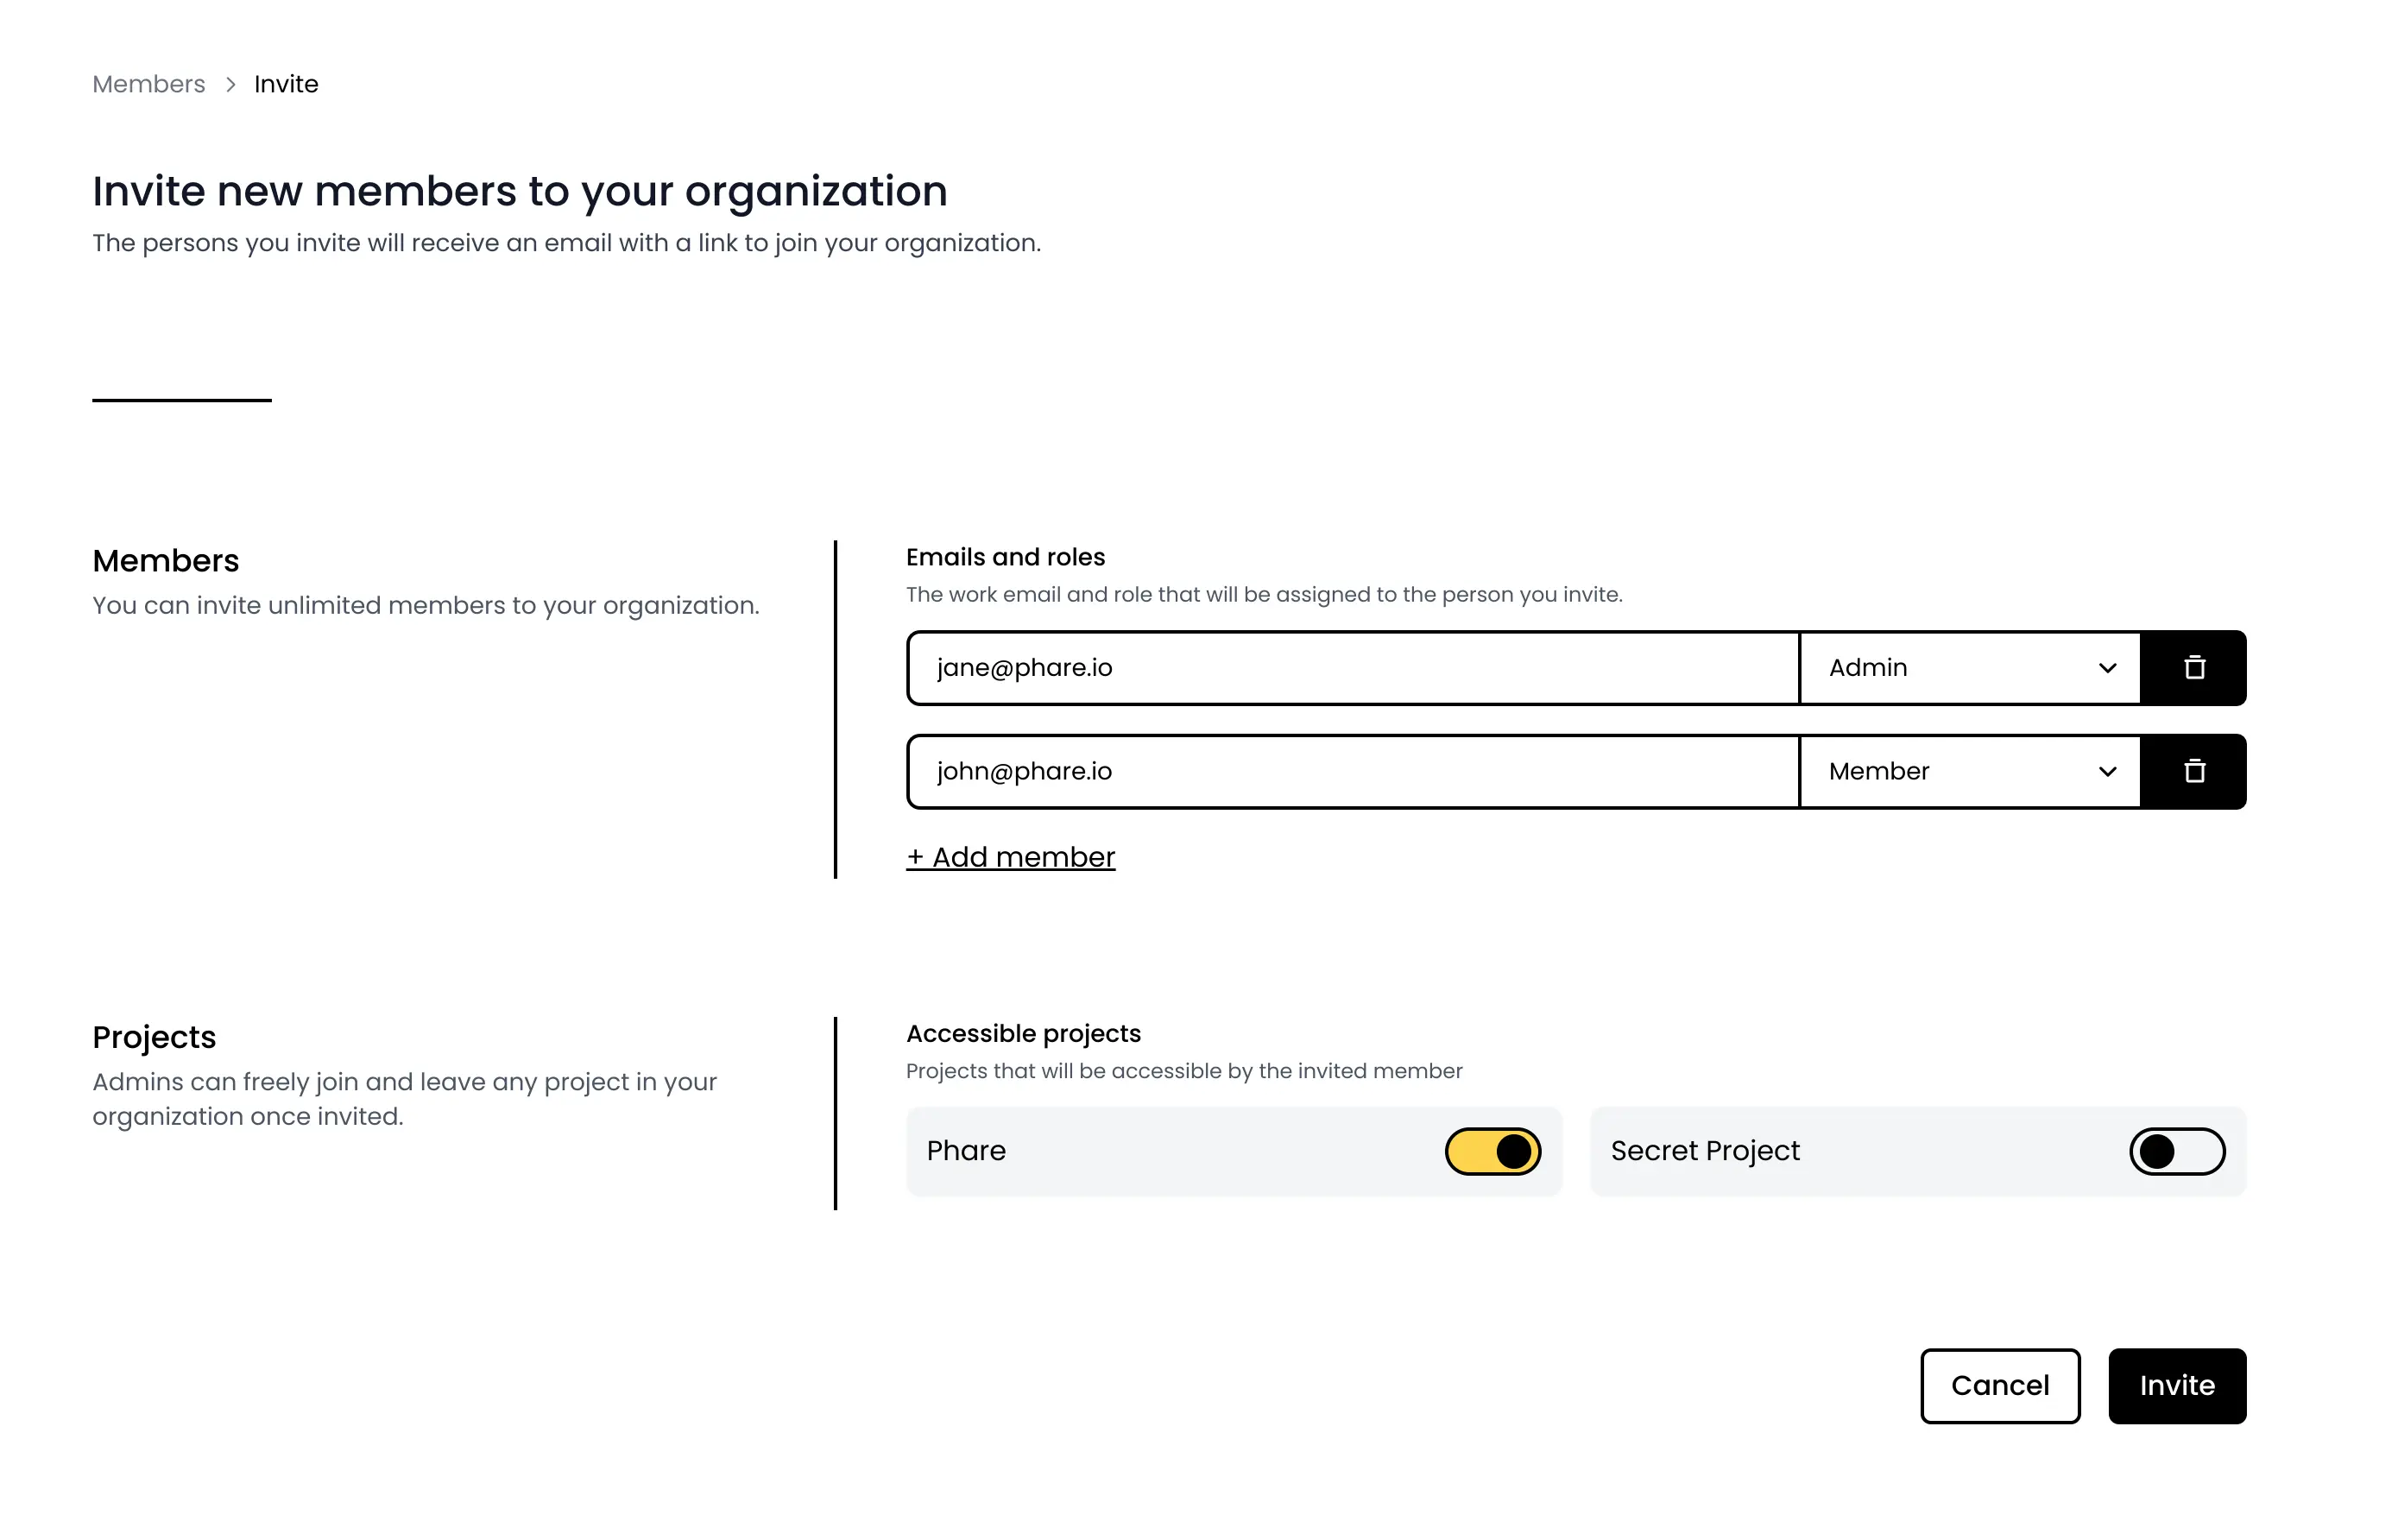
It is now possible to invite your colleagues to your organization, all accounts have unlimited numbers, the more, the merrier.
***
## Members management
*March 15th, 2023*
It is now possible to invite your colleagues to your organization, all accounts have unlimited numbers, the more, the merrier.
 You can assign members to projects and choose who has access to a project during creation.
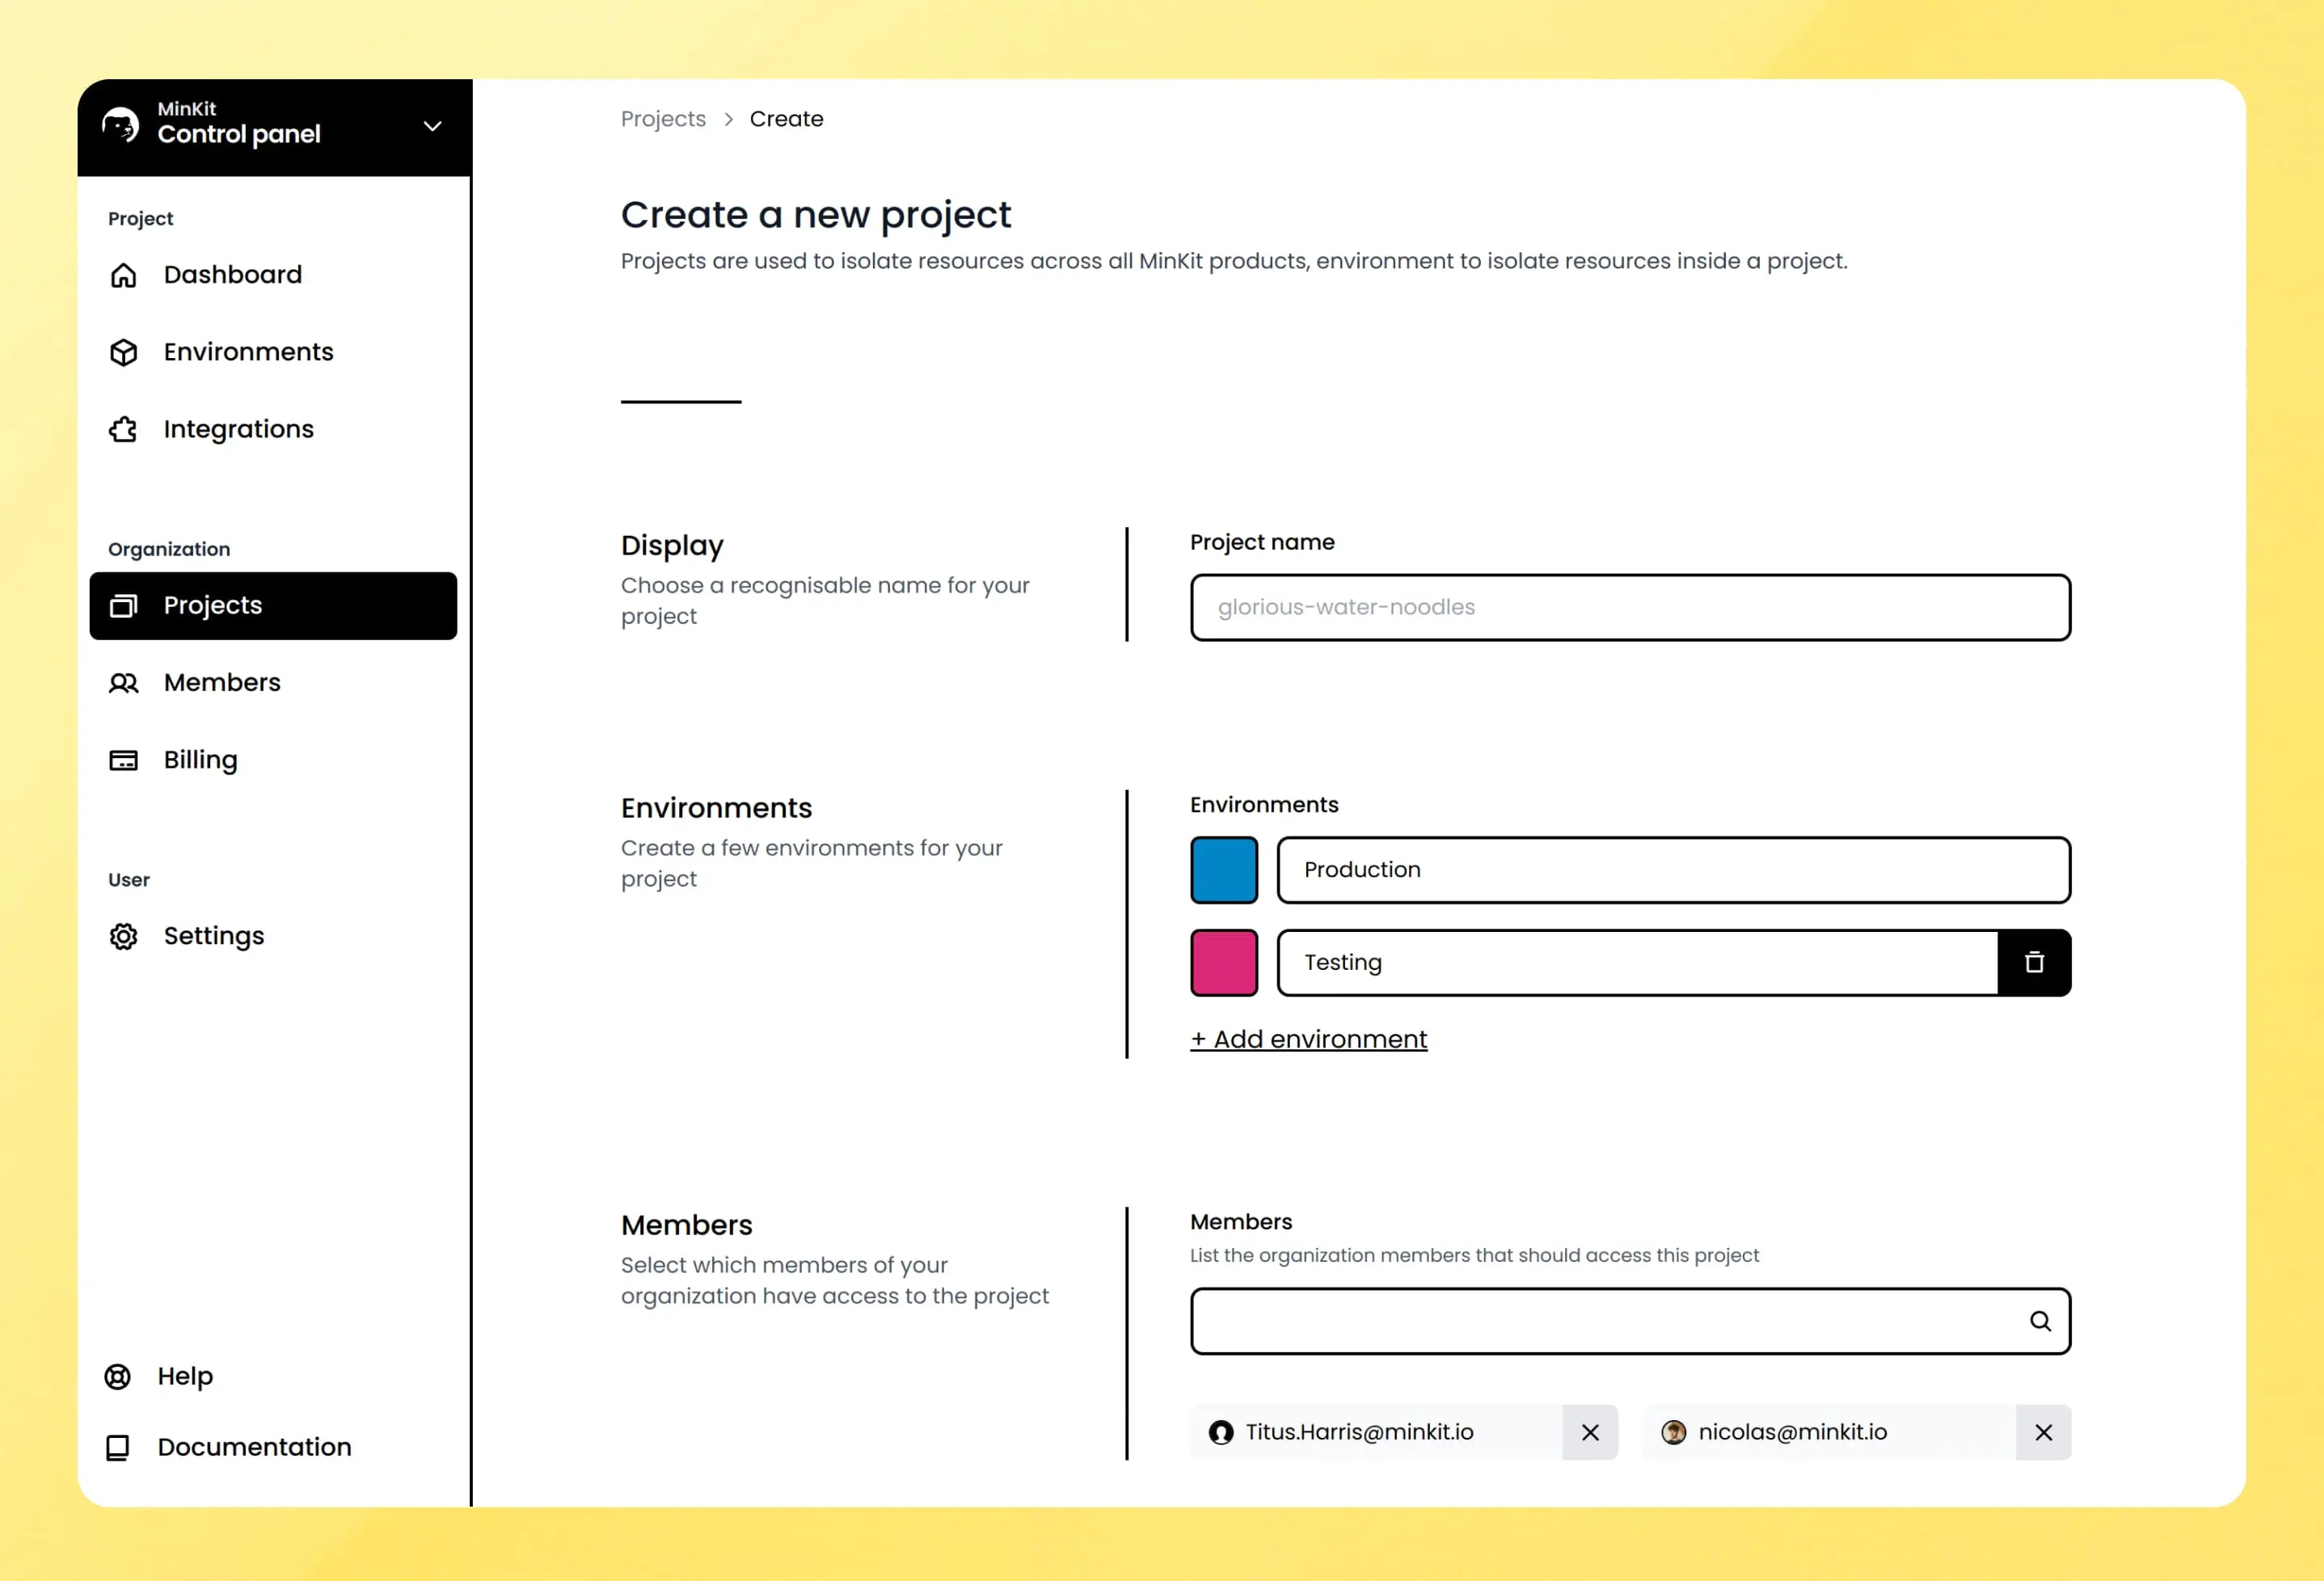 For now, all members can perform every possible action in the scope of their respective project. More granular role management will come later.
***
## New landing page
*March 9th, 2023*
Our landing page received a small makeover, a new marketing-oriented page has been created to present the Phare Uptime product with more details.
Go check out the new [Phare Uptime landing page](https://phare.io/products/uptime).
***
## New alert rules
*March 9th, 2023*
Two new rules have been added with the introduction of incident management, one that triggers when a new incident is created and one when an incident has recovered.
For now, all members can perform every possible action in the scope of their respective project. More granular role management will come later.
***
## New landing page
*March 9th, 2023*
Our landing page received a small makeover, a new marketing-oriented page has been created to present the Phare Uptime product with more details.
Go check out the new [Phare Uptime landing page](https://phare.io/products/uptime).
***
## New alert rules
*March 9th, 2023*
Two new rules have been added with the introduction of incident management, one that triggers when a new incident is created and one when an incident has recovered.
 Theses two new rules replace the former `Monitor status changed` rule that longer exists. All user's default alert policy rules have been updated to reflect this change.
***
## Incident management
*March 8th, 2023*
Monitors now automatically create and resolve incidents, this behavior can be configured in each monitor's settings with two new parameters.
* Incident confirmations: number of failing checks required before creating an incident.
* Recovery confirmations: number of successful checks required before resolving an incident.
Theses two new rules replace the former `Monitor status changed` rule that longer exists. All user's default alert policy rules have been updated to reflect this change.
***
## Incident management
*March 8th, 2023*
Monitors now automatically create and resolve incidents, this behavior can be configured in each monitor's settings with two new parameters.
* Incident confirmations: number of failing checks required before creating an incident.
* Recovery confirmations: number of successful checks required before resolving an incident.
 All incidents are shown in the incidents section of MinUptime, you can quickly see their status and act accordingly.
 To help you fix the situation, a timeline of events linked to an incident is shown on the incident's page.
 ***
## Discord integration
*March 6th, 2023*
Discord is now an available integration, it can already be used for all types of alerts, and be configured to specific project and environments like the existing Slack and Email integration.
***
## Discord integration
*March 6th, 2023*
Discord is now an available integration, it can already be used for all types of alerts, and be configured to specific project and environments like the existing Slack and Email integration.
 ***
## Timezone and time format
*March 2nd, 2023*
Users can now select their Timezone and preferred time format (24 or 12-hour clock)
***
## Timezone and time format
*March 2nd, 2023*
Users can now select their Timezone and preferred time format (24 or 12-hour clock)
 ***
## New monitor alert rules
*April 14th, 2023*
Two new alert rules have been added to receive alerts when a monitor is created or deleted
***
## New monitor alert rules
*April 14th, 2023*
Two new alert rules have been added to receive alerts when a monitor is created or deleted
 # Changelog of 2024
Source: https://docs.phare.io/changelog/platform/2024
Follow the updates and improvements made to the Phare platform in 2024.
## Shield status badges
**December 23rd, 2024**
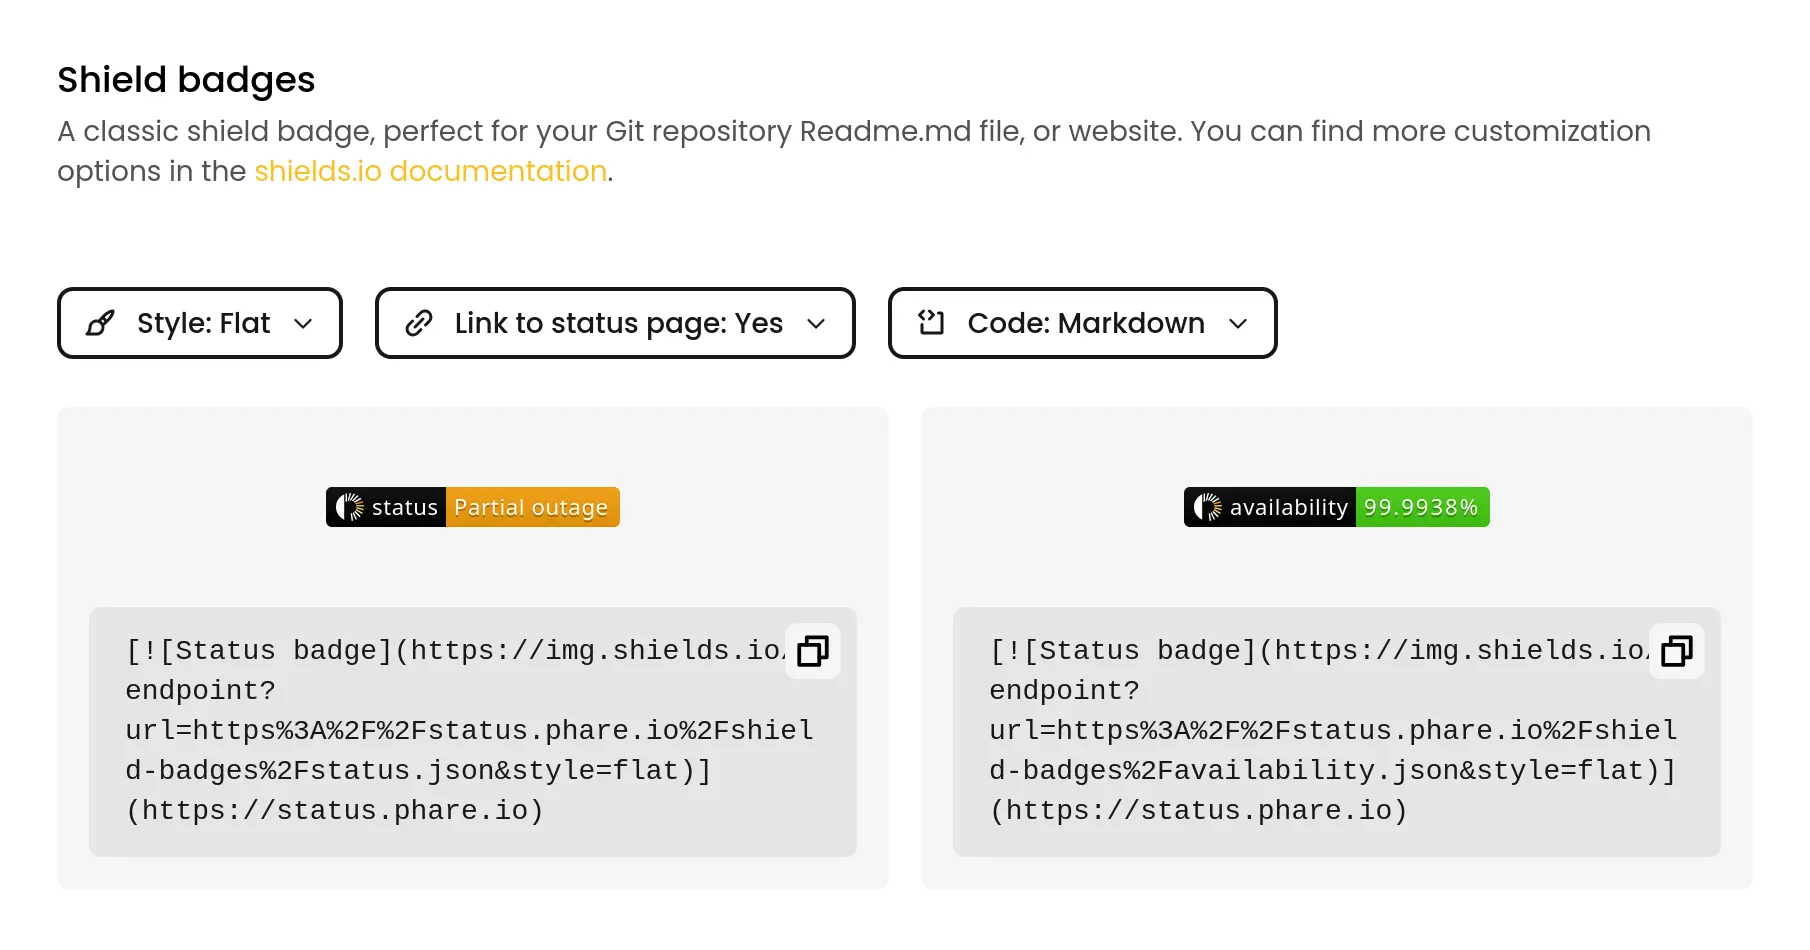
Shield status badges are now available for your status pages. You can embed these badges in your documentation, README files, or any other web page to show the current status of your services.
Two types of badges are currently available, a status badge showing the overall status of your status page, and an availability badge showing the uptime percentage of your services.
# Changelog of 2024
Source: https://docs.phare.io/changelog/platform/2024
Follow the updates and improvements made to the Phare platform in 2024.
## Shield status badges
**December 23rd, 2024**
Shield status badges are now available for your status pages. You can embed these badges in your documentation, README files, or any other web page to show the current status of your services.
Two types of badges are currently available, a status badge showing the overall status of your status page, and an availability badge showing the uptime percentage of your services.
 ***
## Send test alert rule notifications
*December 11th, 2024*
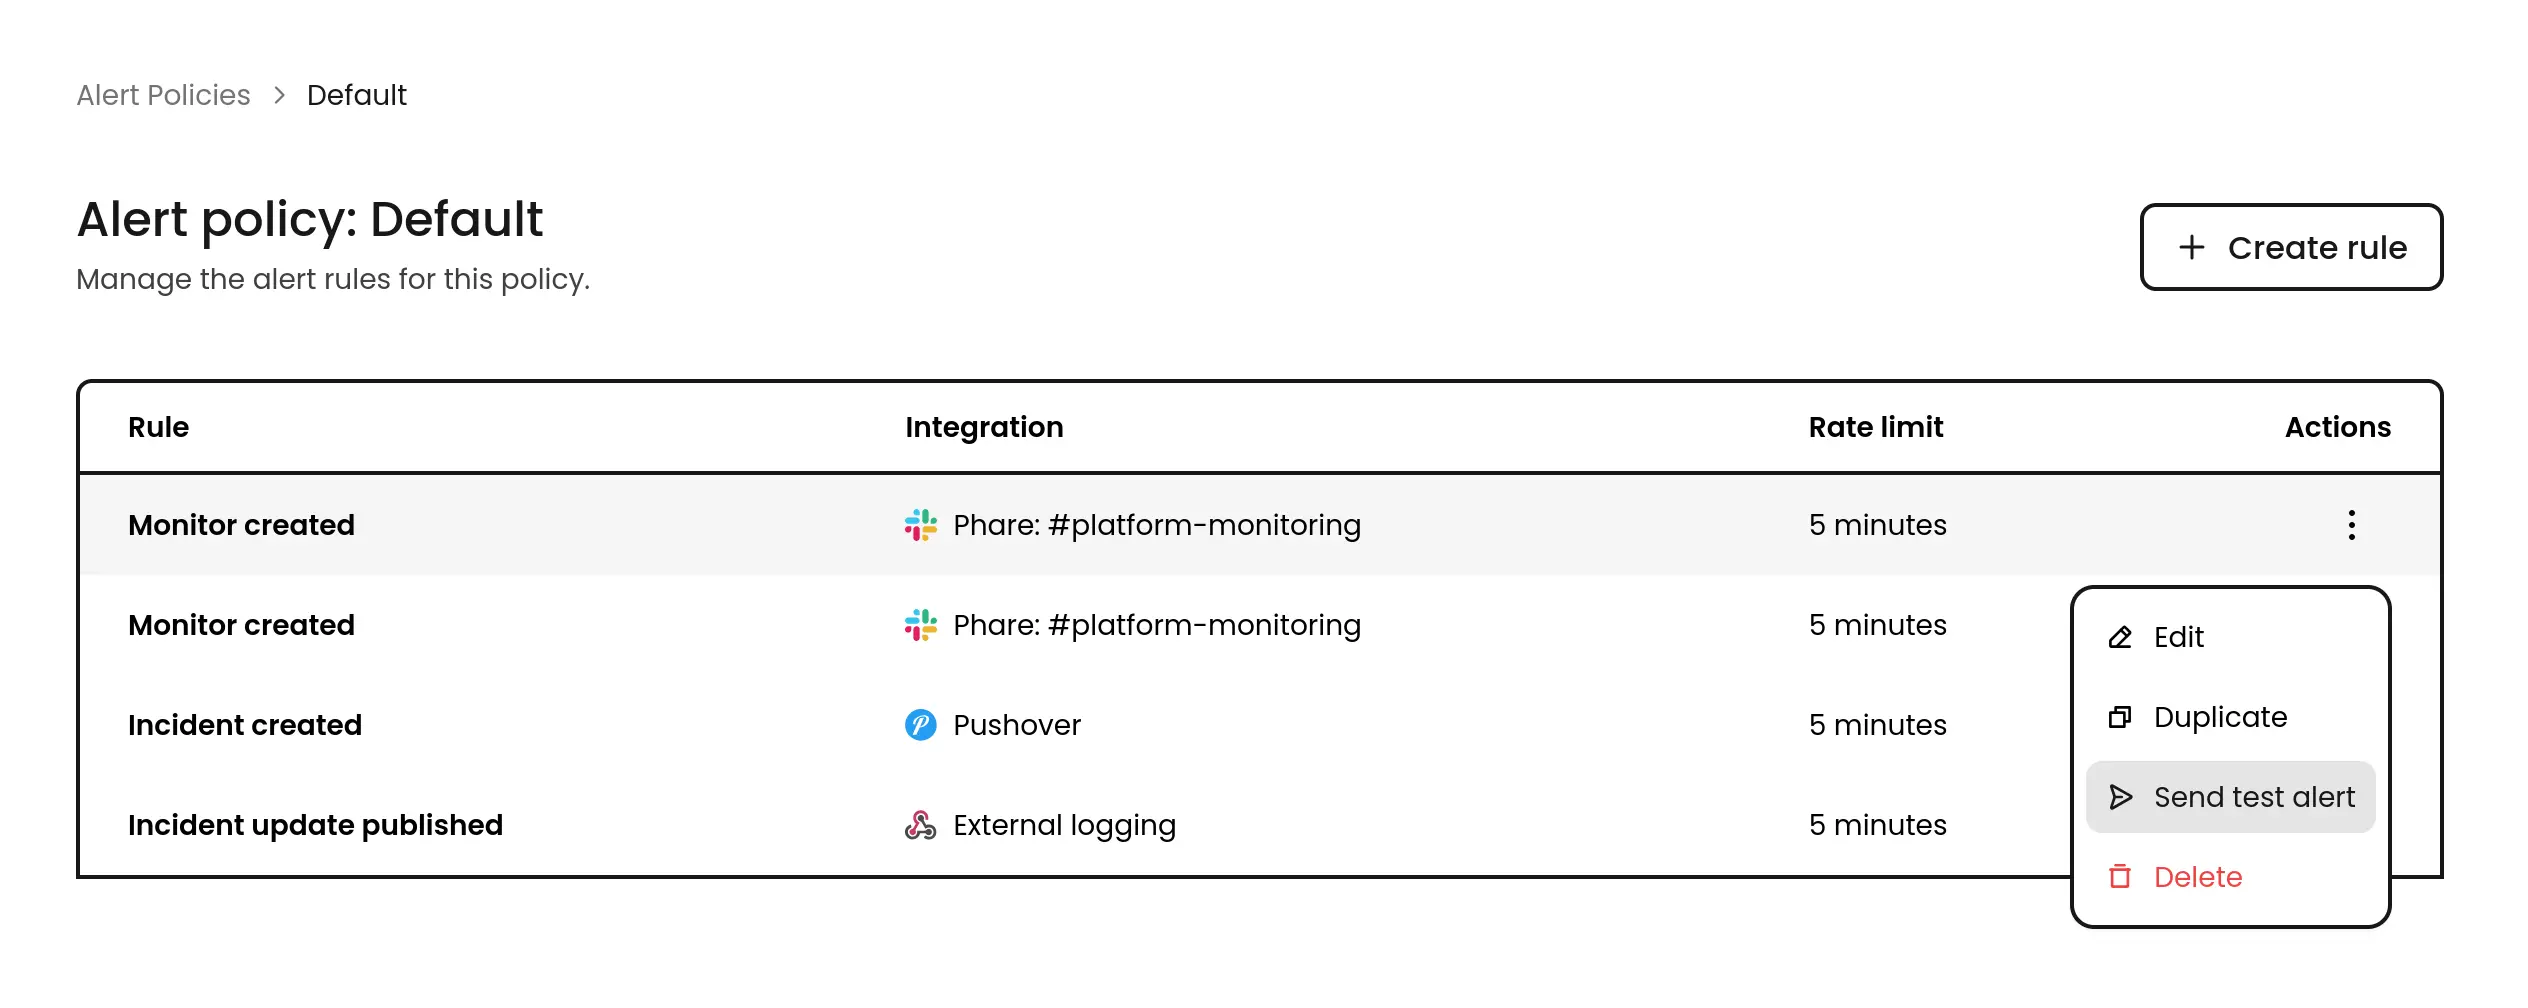
Phare now lets you send test notifications for your configured alert rules. Whether you’re fine-tuning an alert or setting up a new monitor, you can see exactly how it works before going live.
This is particularly useful for more complex alert rules, like outgoing webhooks, where you can verify that the payload is correctly formatted and received by your system.
This release also includes some quality of life improvements around alert policies and rules.
***
## Send test alert rule notifications
*December 11th, 2024*
Phare now lets you send test notifications for your configured alert rules. Whether you’re fine-tuning an alert or setting up a new monitor, you can see exactly how it works before going live.
This is particularly useful for more complex alert rules, like outgoing webhooks, where you can verify that the payload is correctly formatted and received by your system.
This release also includes some quality of life improvements around alert policies and rules.
 ***
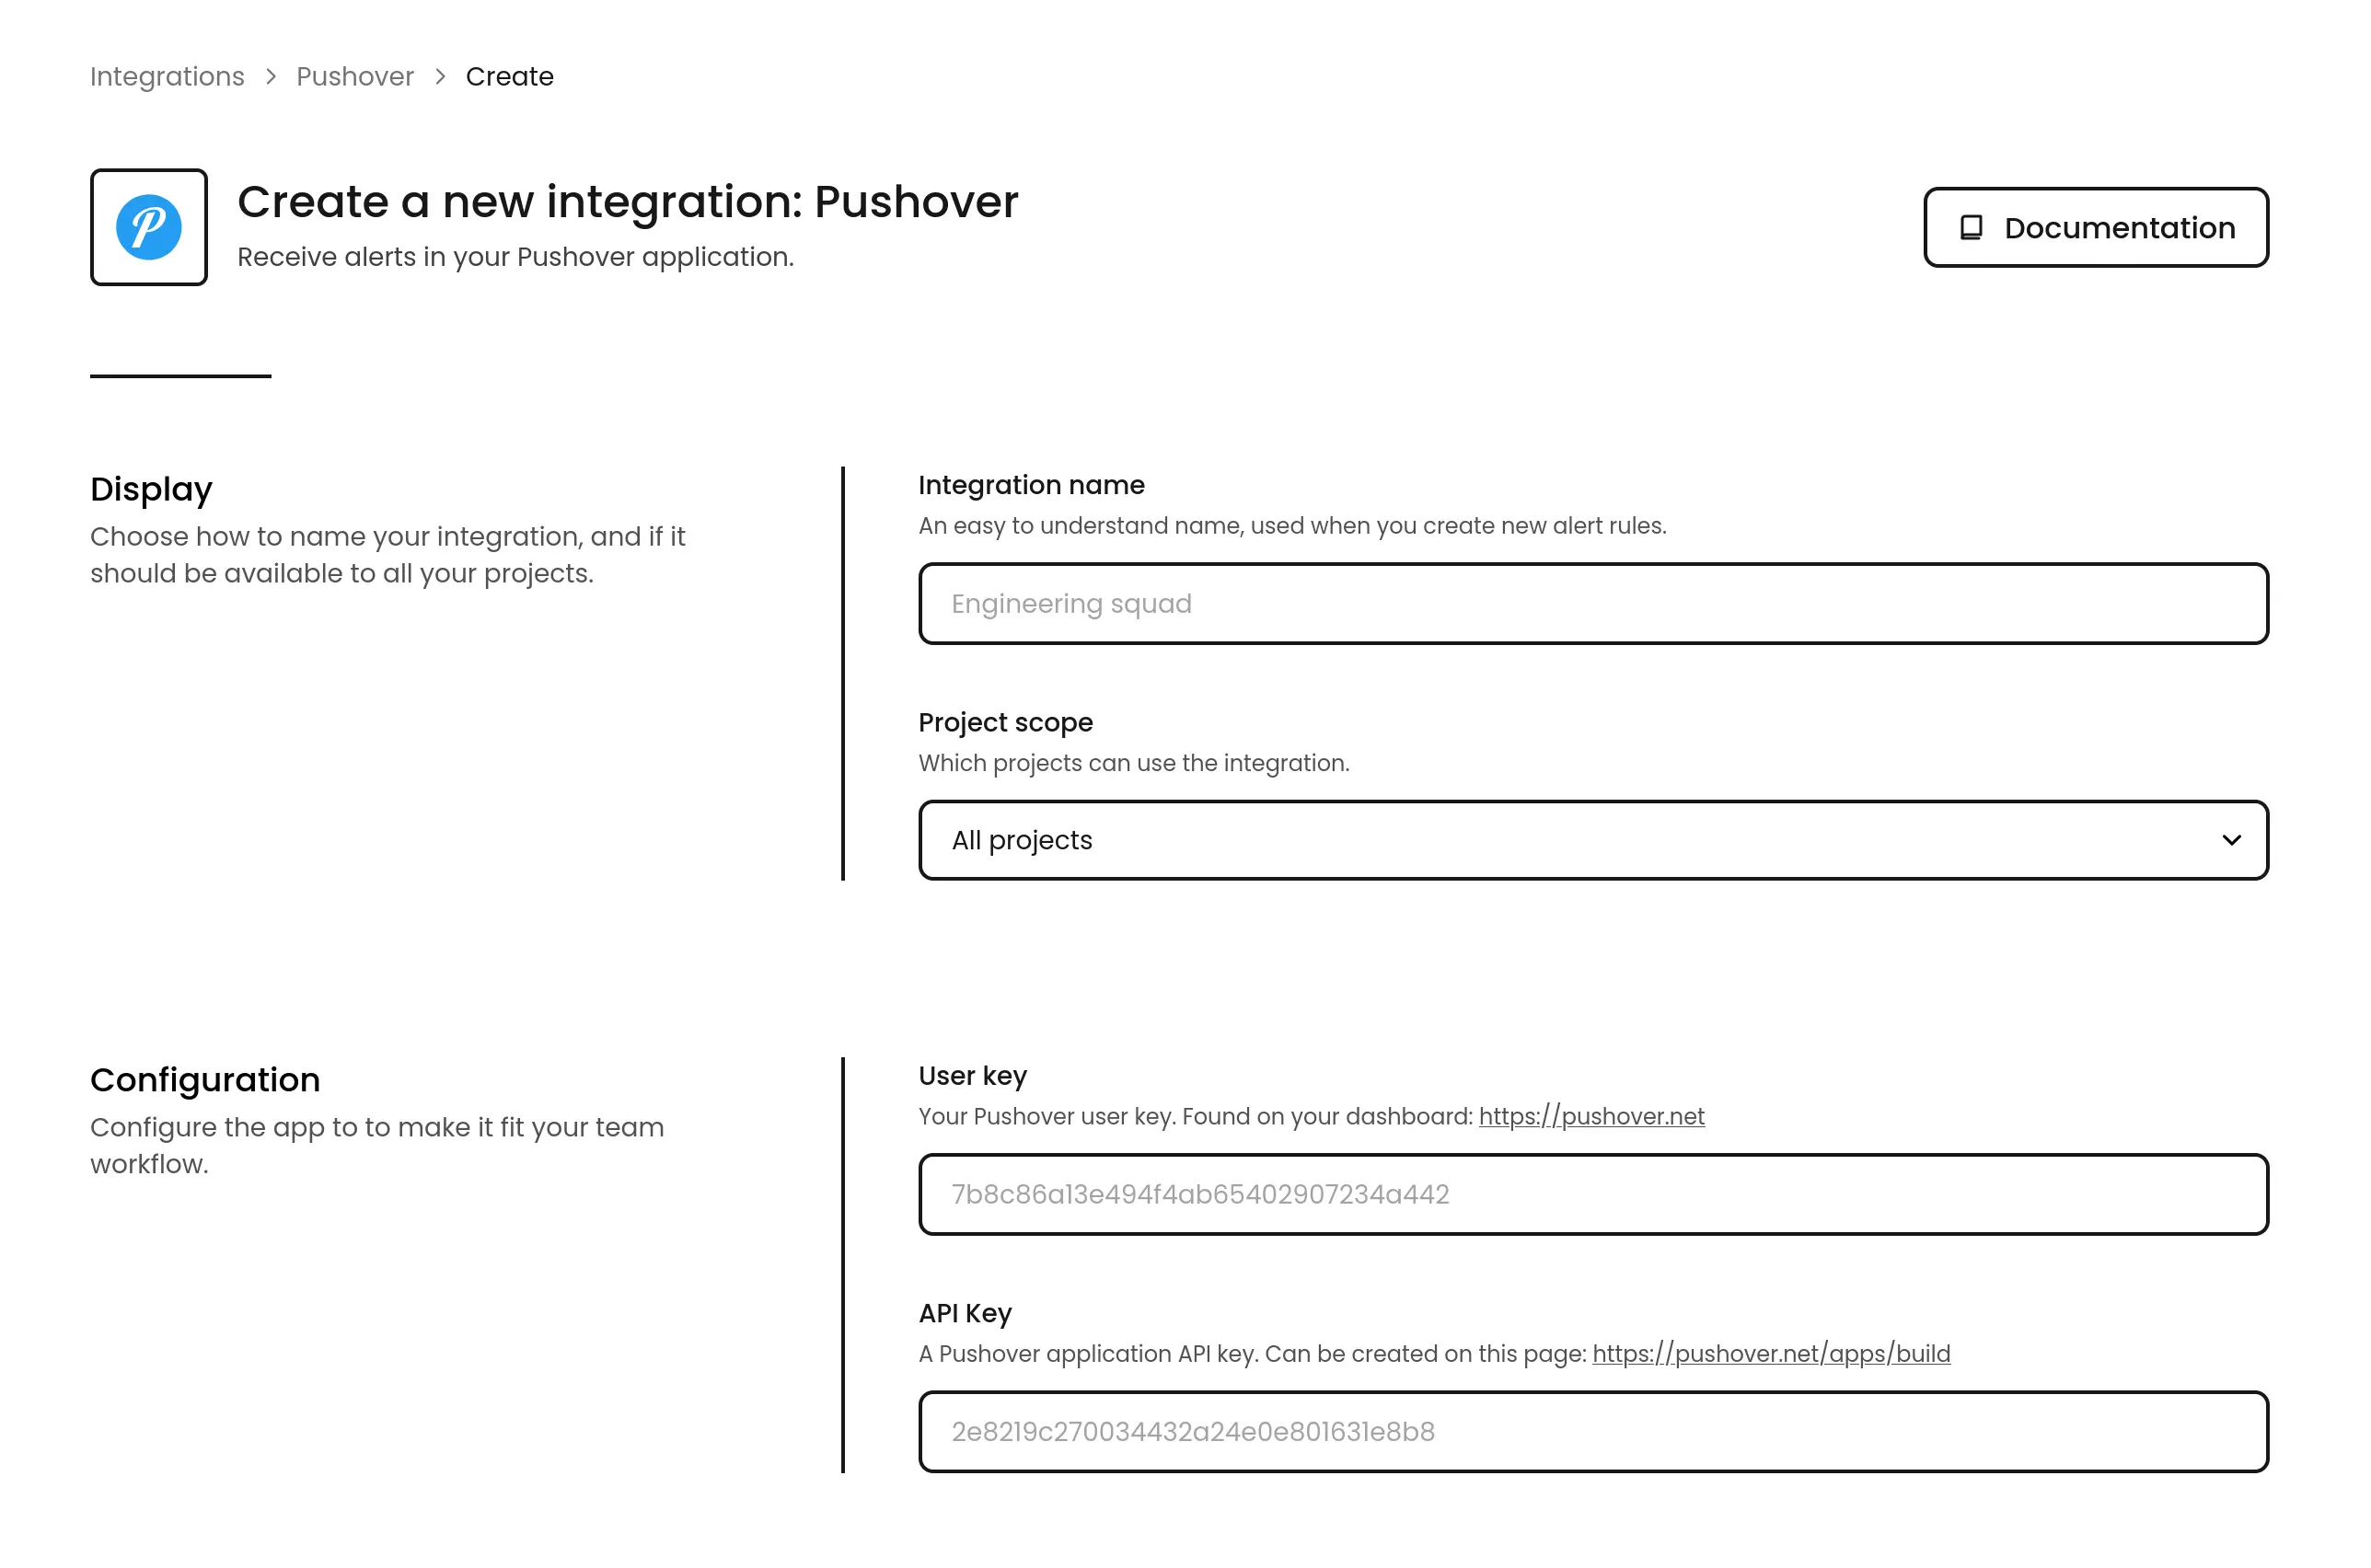
## Pushover integration
*December 6th, 2024*
Phare now supports Pushover, so you can get your alert notifications straight to your preferred device.
Unlike other Pushover integrations you might have tried, Phare lets you set a custom priority for each type of notification, giving you fine-grained control over your alerts.
Read the [Pushover integration documentation](/integrations/pushover) to get started.
***
## Pushover integration
*December 6th, 2024*
Phare now supports Pushover, so you can get your alert notifications straight to your preferred device.
Unlike other Pushover integrations you might have tried, Phare lets you set a custom priority for each type of notification, giving you fine-grained control over your alerts.
Read the [Pushover integration documentation](/integrations/pushover) to get started.
 ***
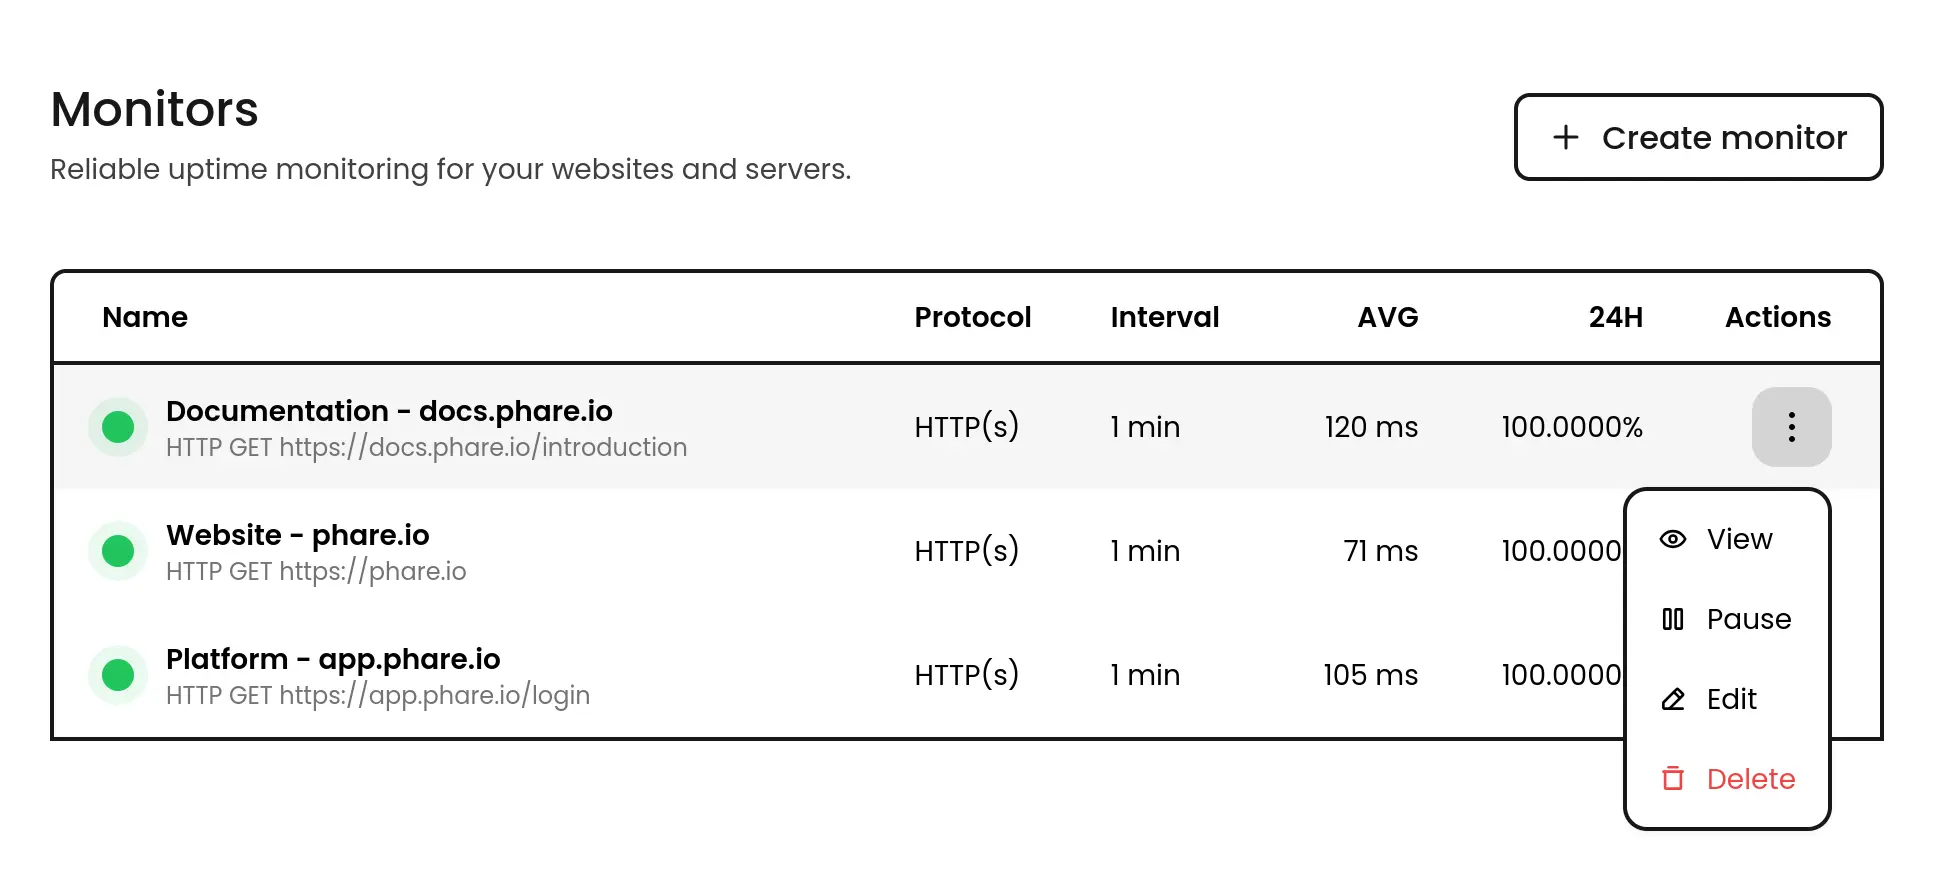
## Quickly pause and resume monitors
*November 22th, 2024*
Monitors can now be paused and resumed directly from the monitor list. This feature allows you to quickly disable monitoring for a specific monitor without having to navigate to the monitor page.
***
## Quickly pause and resume monitors
*November 22th, 2024*
Monitors can now be paused and resumed directly from the monitor list. This feature allows you to quickly disable monitoring for a specific monitor without having to navigate to the monitor page.
 ***
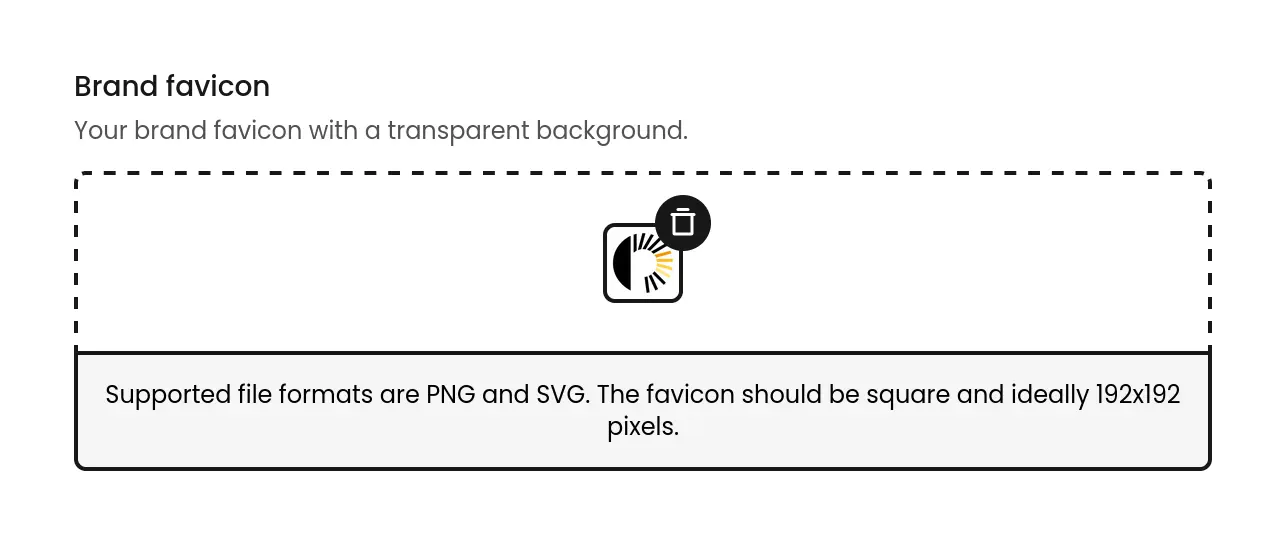
## Favicon support on status pages
*November 22th, 2024*
You can now customize the favicon displayed on your status pages. This feature allows you to add a personal touch to your status page and provide a more branded experience for your users.
***
## Favicon support on status pages
*November 22th, 2024*
You can now customize the favicon displayed on your status pages. This feature allows you to add a personal touch to your status page and provide a more branded experience for your users.
 ***
## Simplified TCP monitoring
*November 20th, 2024*
TCP monitoring has been simplified to make it easier to set up and manage monitoring your services. No more need to specify a payload and an expected response.
***
## Simplified TCP monitoring
*November 20th, 2024*
TCP monitoring has been simplified to make it easier to set up and manage monitoring your services. No more need to specify a payload and an expected response.
 ***
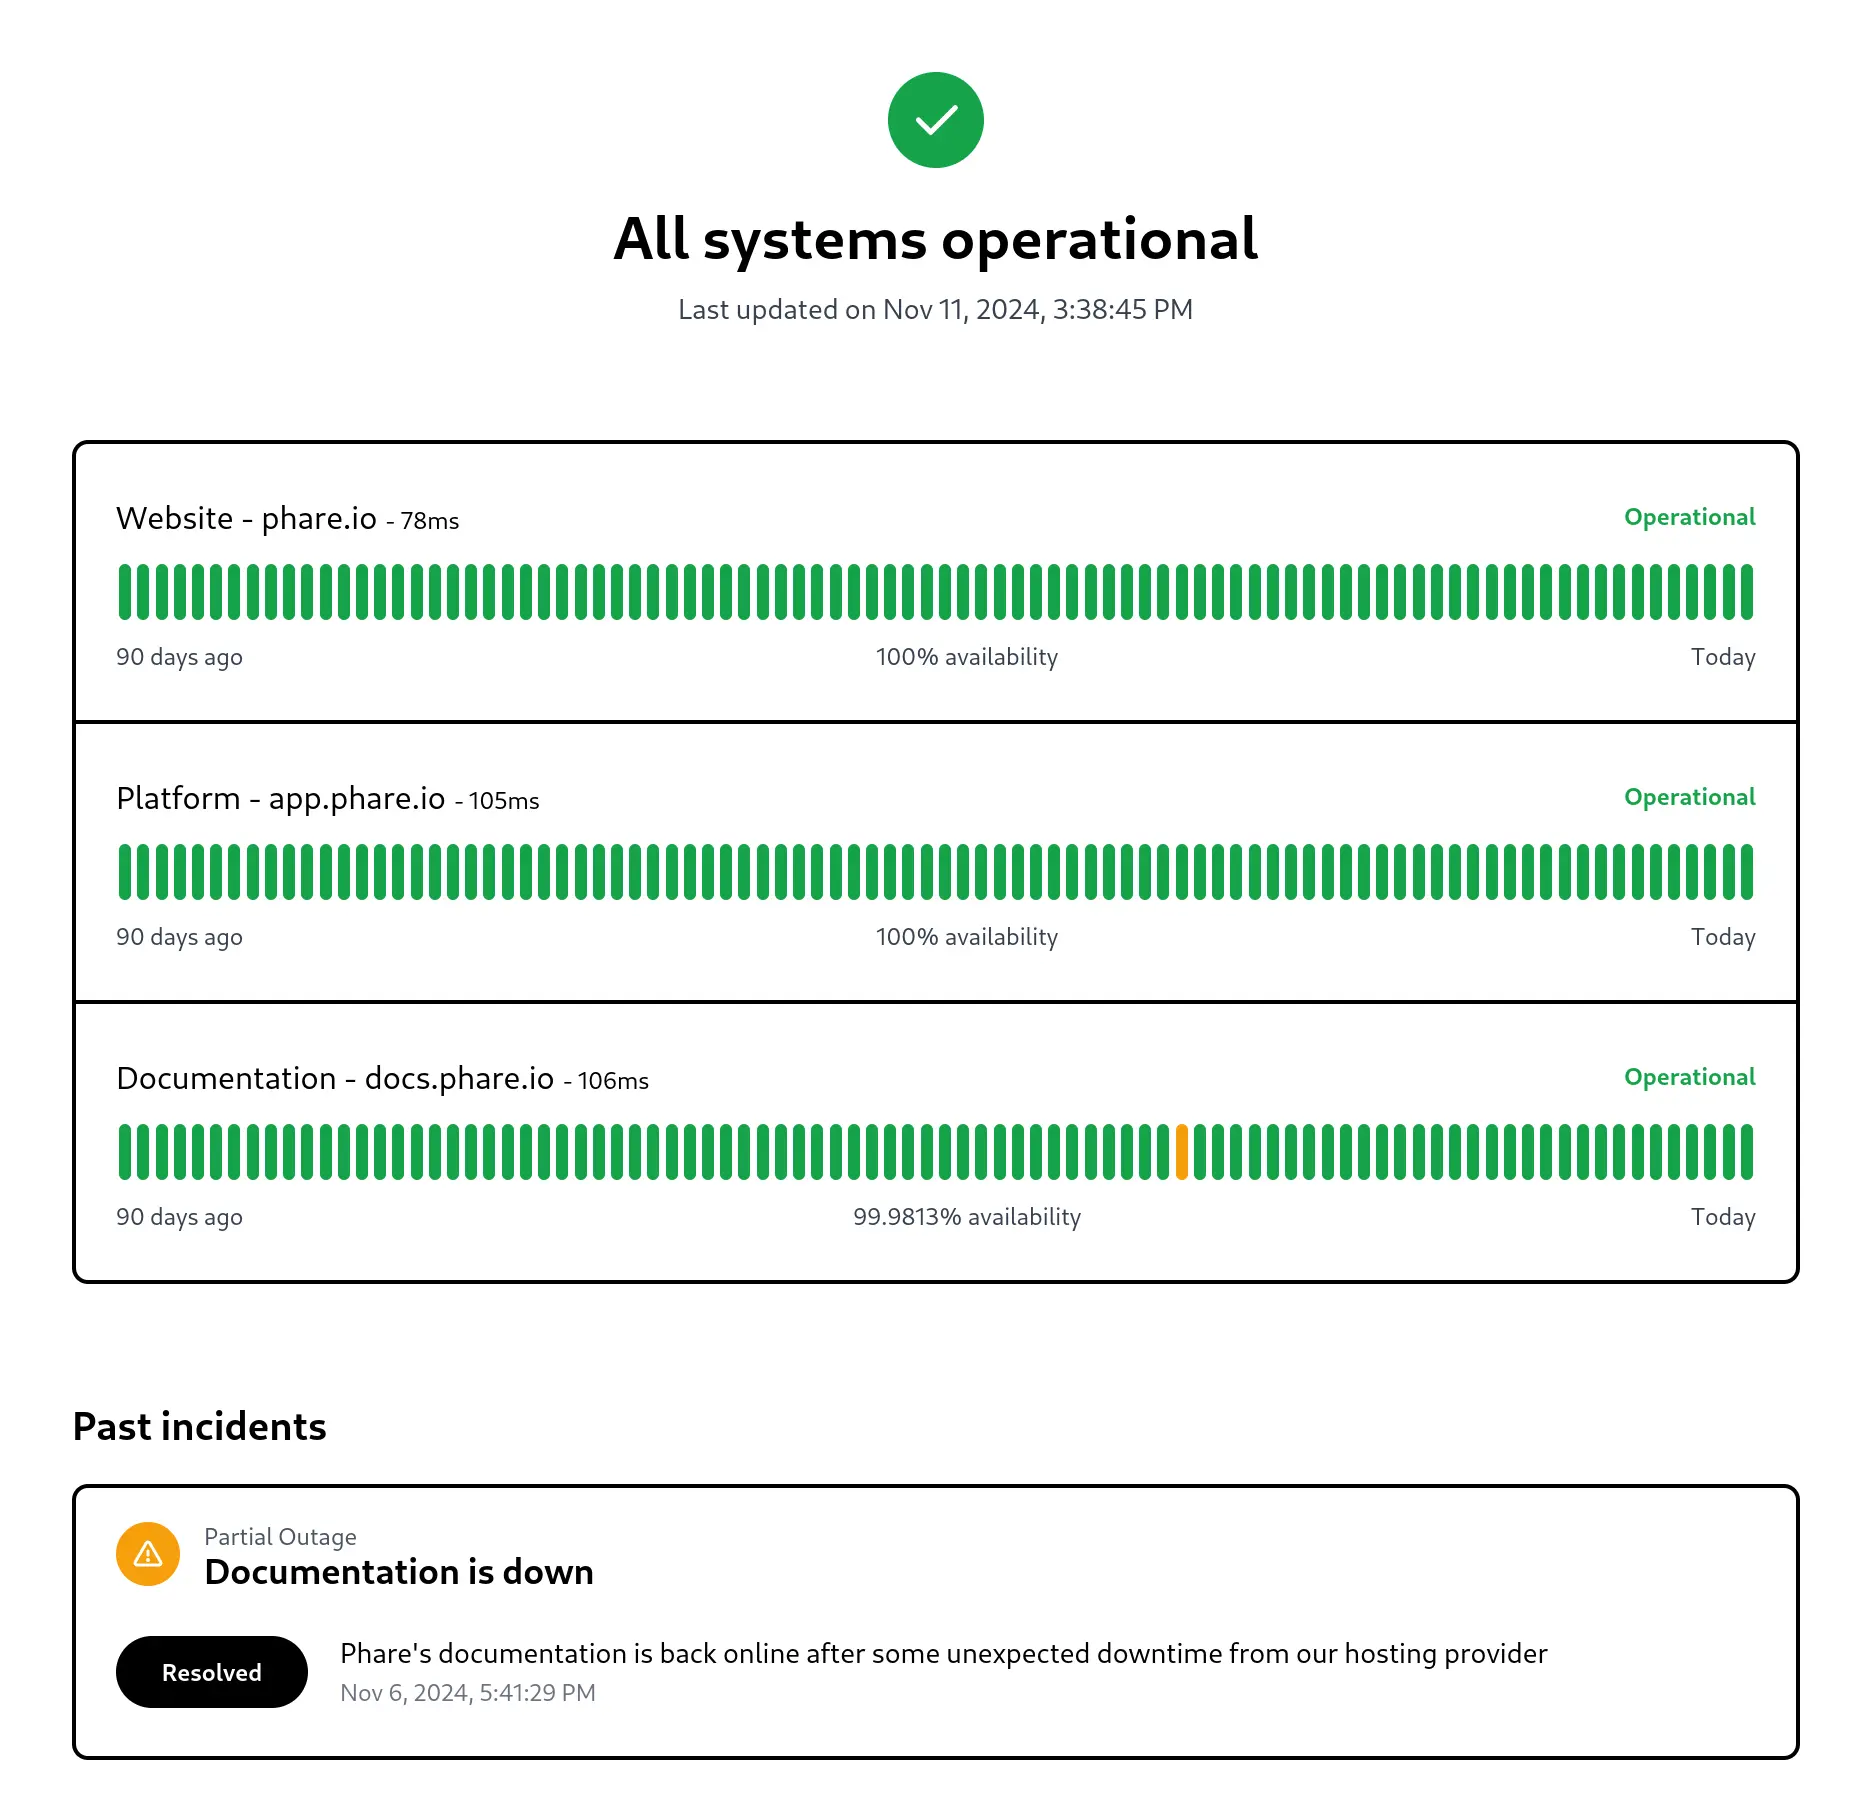
## Refreshed status pages
*November 11th, 2024*
Status pages design has been slightly refreshed to provide a better look and feel. This also includes a few bug fixes and improve how incidents and downtime is presented to your users in a more coherent way.
***
## Refreshed status pages
*November 11th, 2024*
Status pages design has been slightly refreshed to provide a better look and feel. This also includes a few bug fixes and improve how incidents and downtime is presented to your users in a more coherent way.
 ***
## Incident management enhancements
*November 8th, 2024*
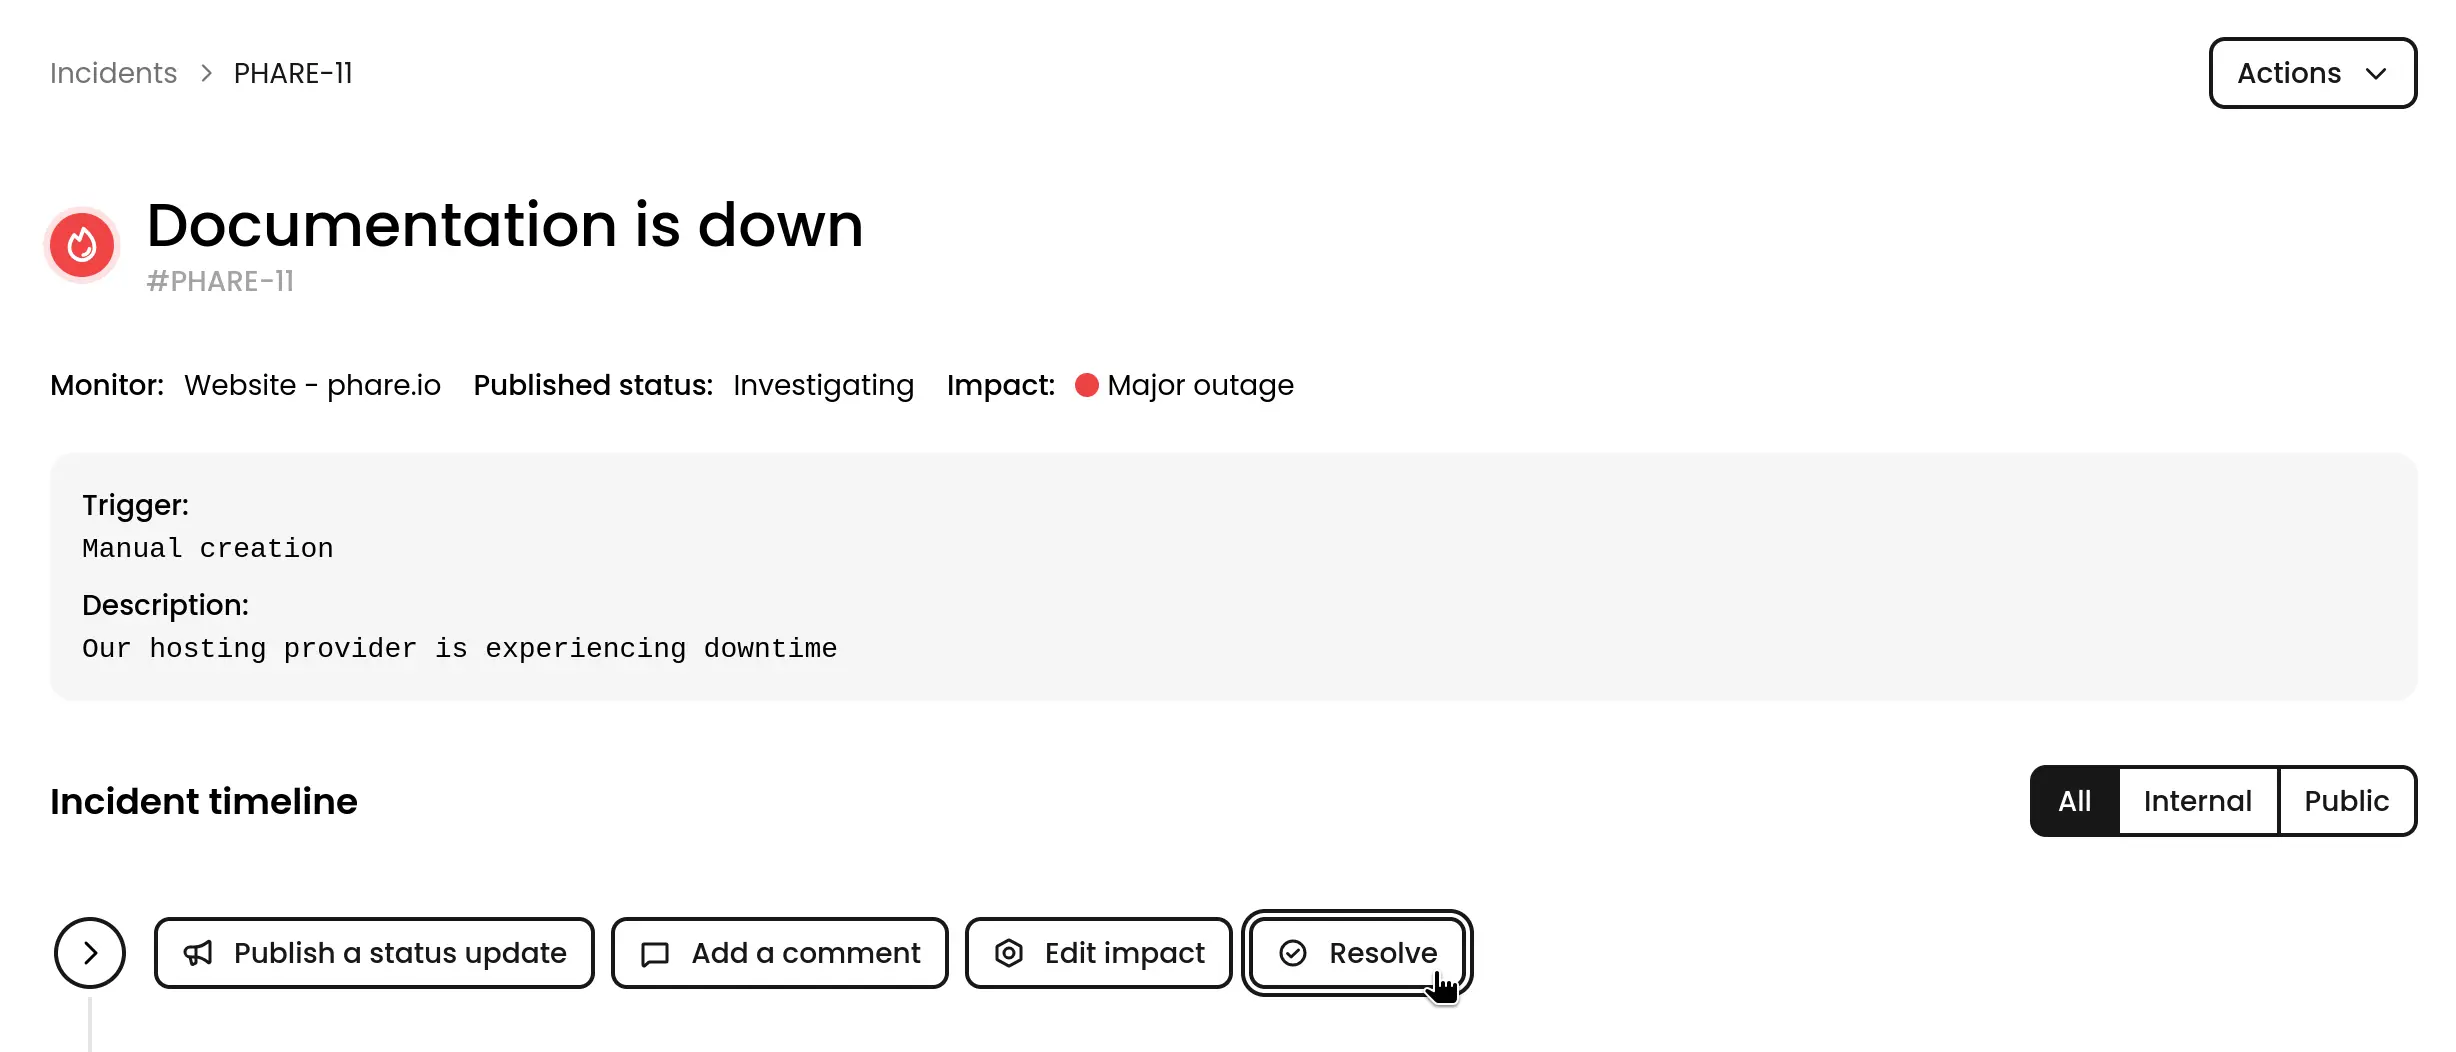
Several improvements have been introduced to the incident management system to streamline incident creation and give you more control:
### Manual incident resolution
You can now manually resolve incidents, providing greater control over the incident lifecycle and ensuring accurate status reporting.
***
## Incident management enhancements
*November 8th, 2024*
Several improvements have been introduced to the incident management system to streamline incident creation and give you more control:
### Manual incident resolution
You can now manually resolve incidents, providing greater control over the incident lifecycle and ensuring accurate status reporting.
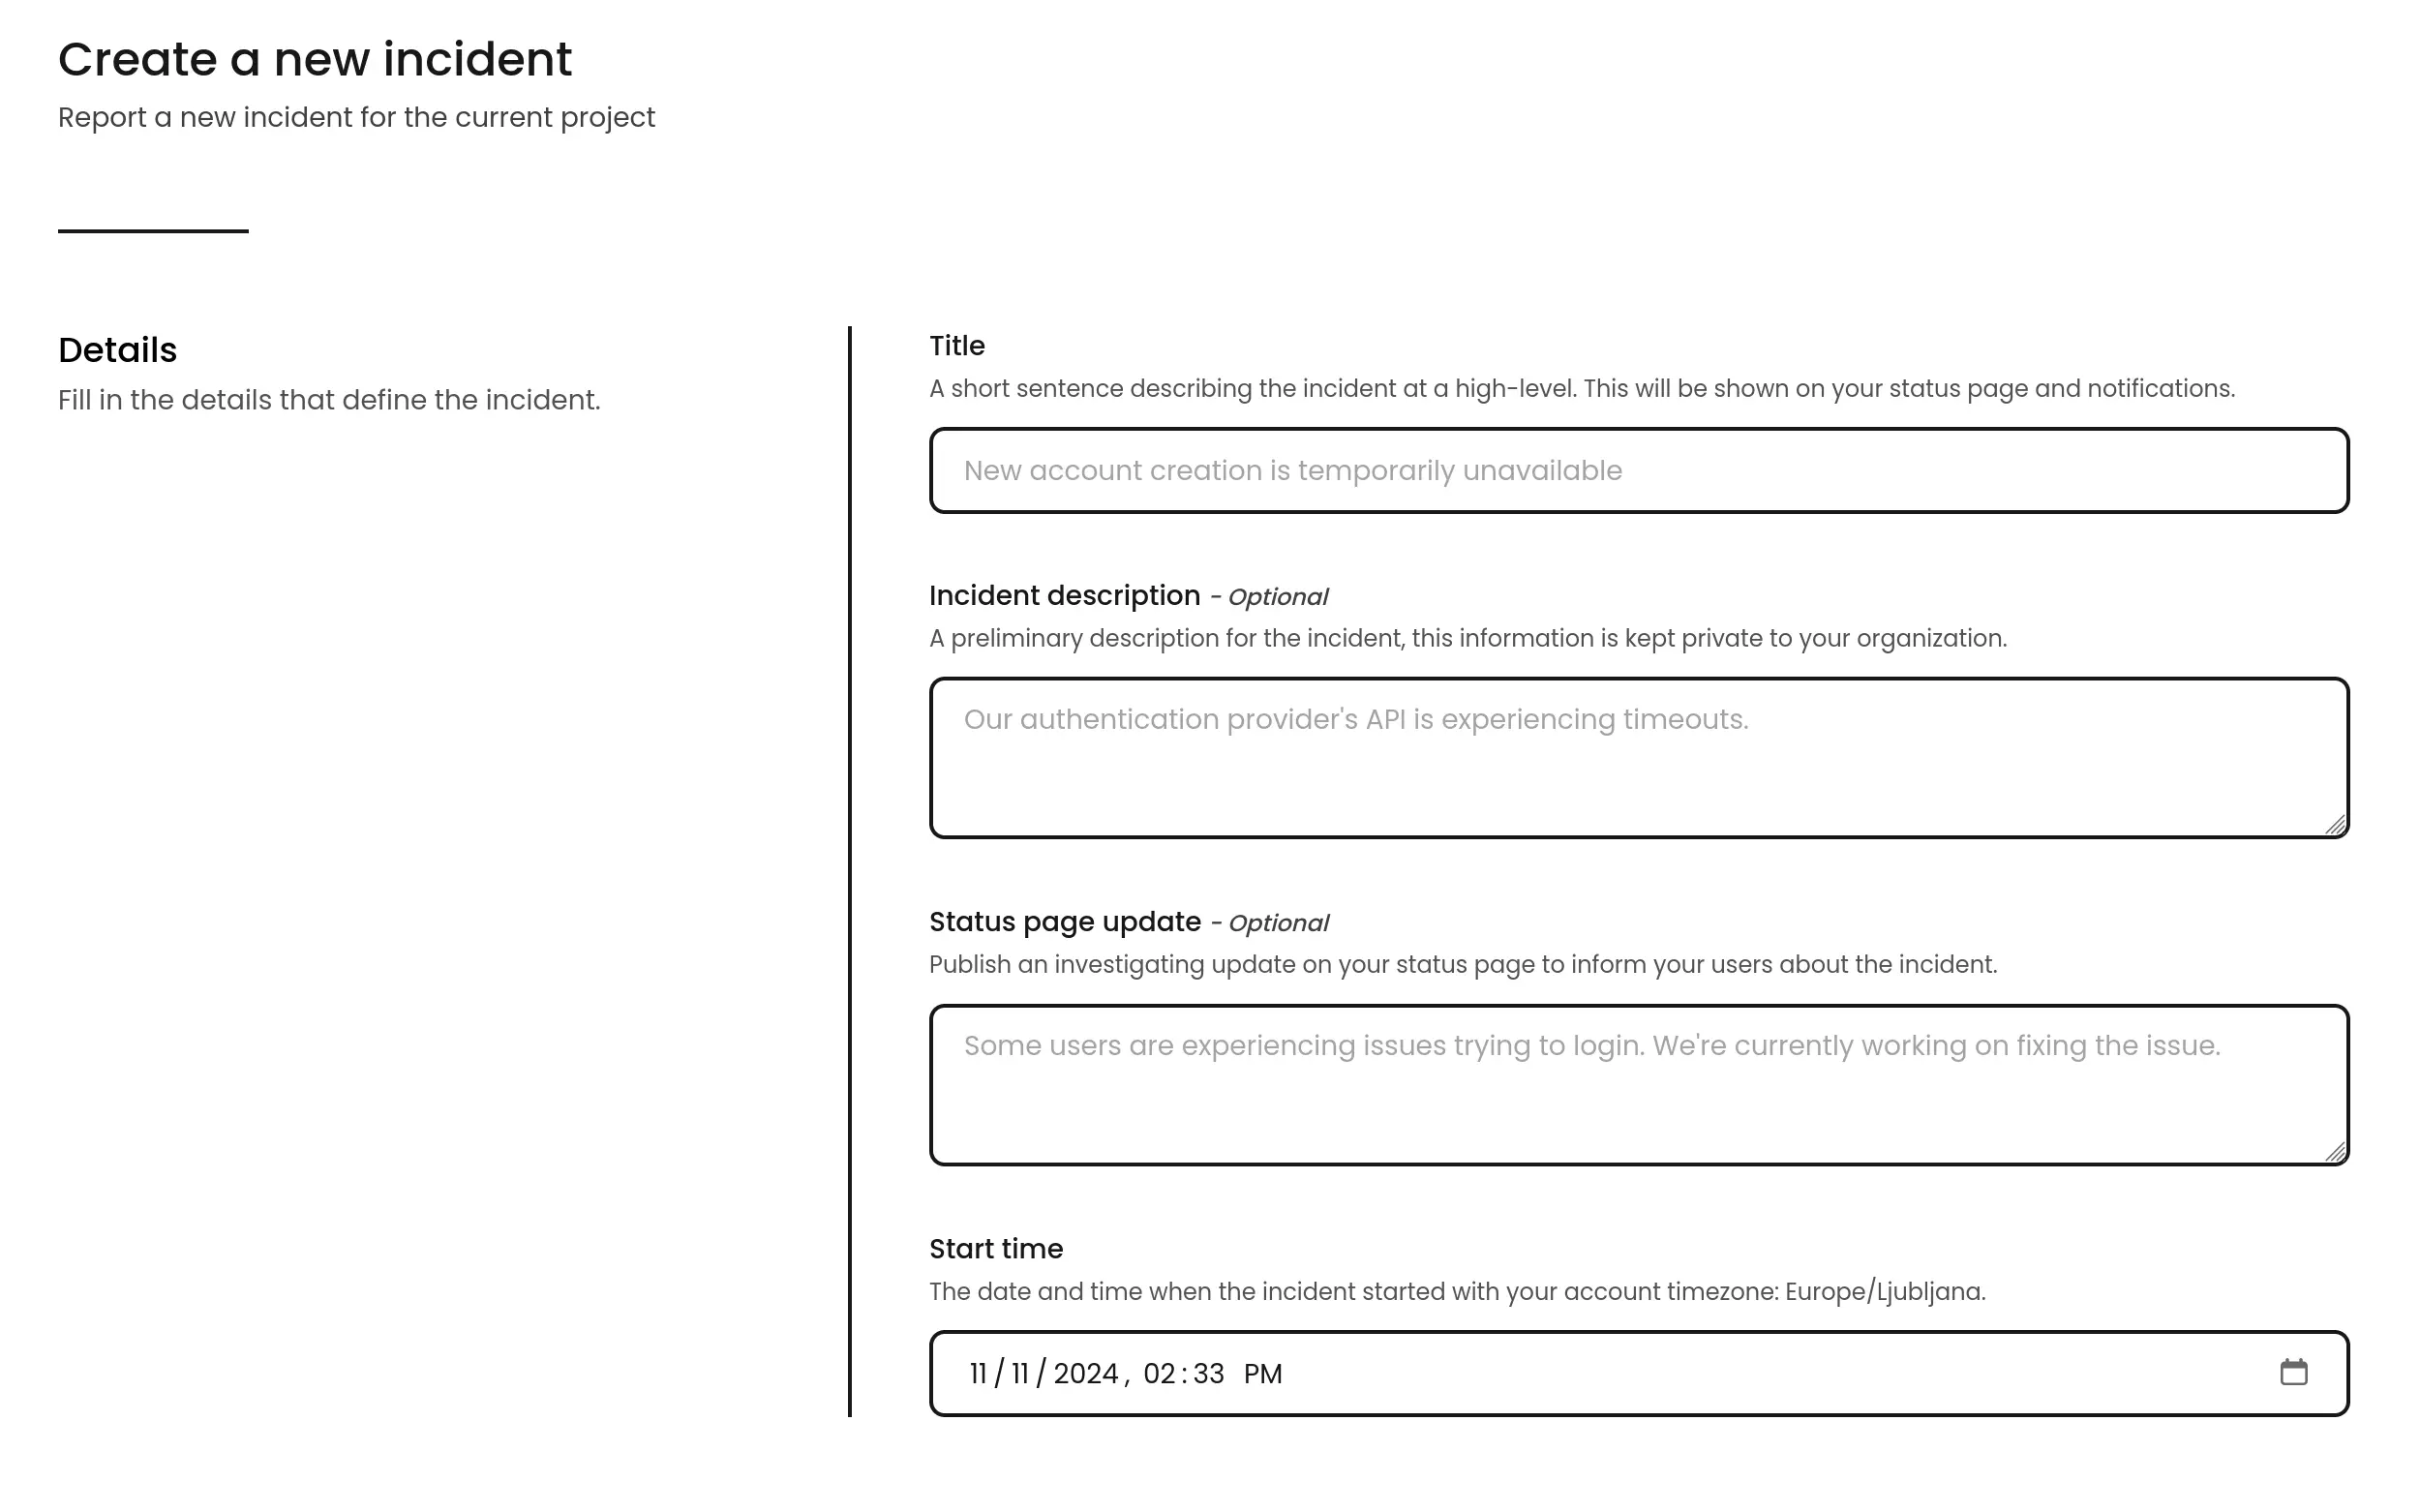
 ### Publish status update during incident creation
When creating a new incident, you can now publish a status update immediately, keeping your users informed from the very beginning.
### Publish status update during incident creation
When creating a new incident, you can now publish a status update immediately, keeping your users informed from the very beginning.
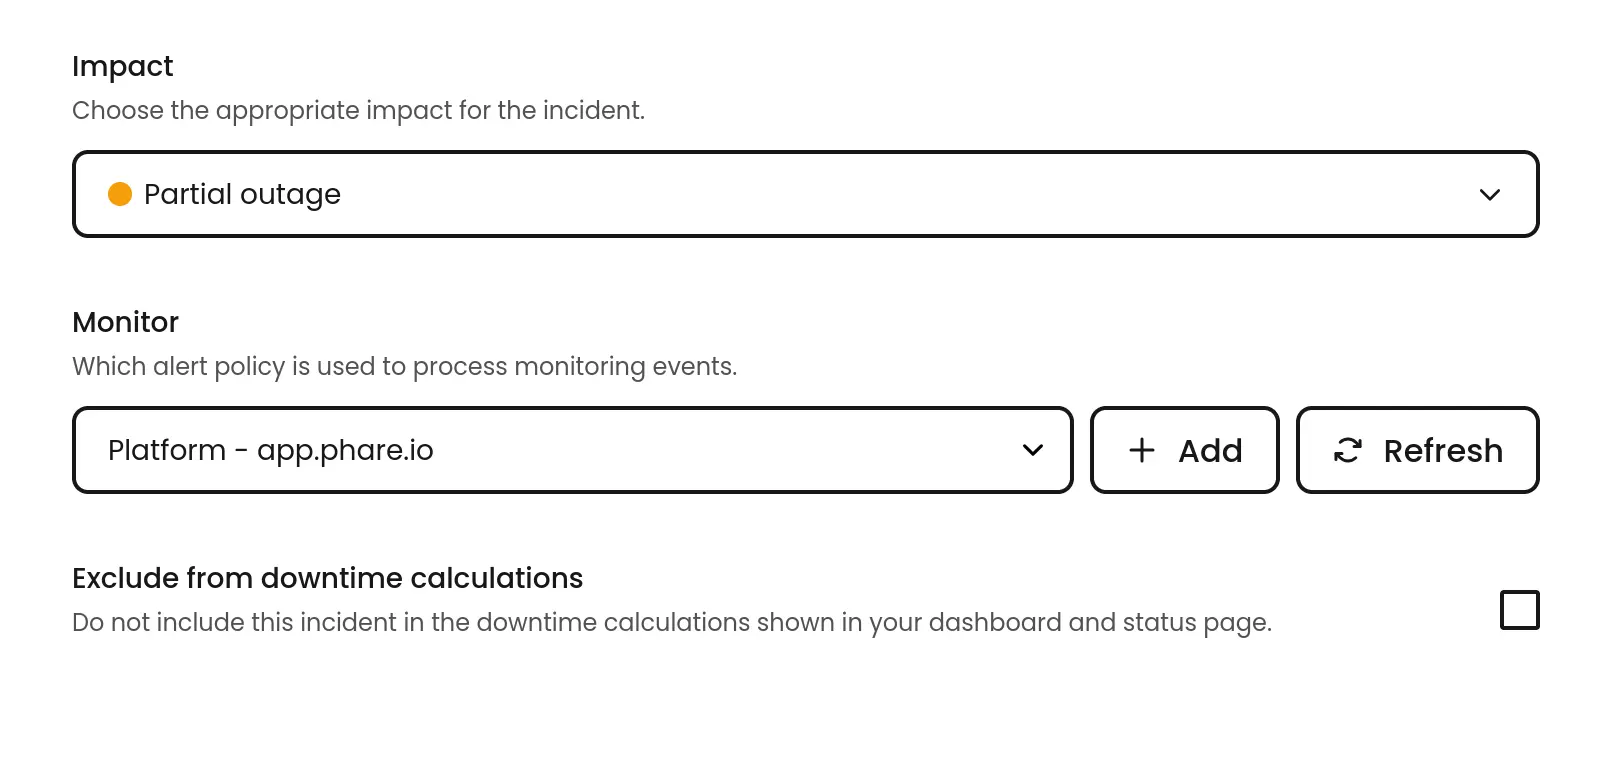
 ### Control on incident downtime calculation
You now have the ability to exclude an incident from the downtime calculation, allowing you to maintain accurate uptime metrics and avoid skewing your performance data. This feature is particularly useful for maintenance windows with downtime that are already part of your SLA, or for incidents that have minimal impact on your users.
### Control on incident downtime calculation
You now have the ability to exclude an incident from the downtime calculation, allowing you to maintain accurate uptime metrics and avoid skewing your performance data. This feature is particularly useful for maintenance windows with downtime that are already part of your SLA, or for incidents that have minimal impact on your users.
 ***
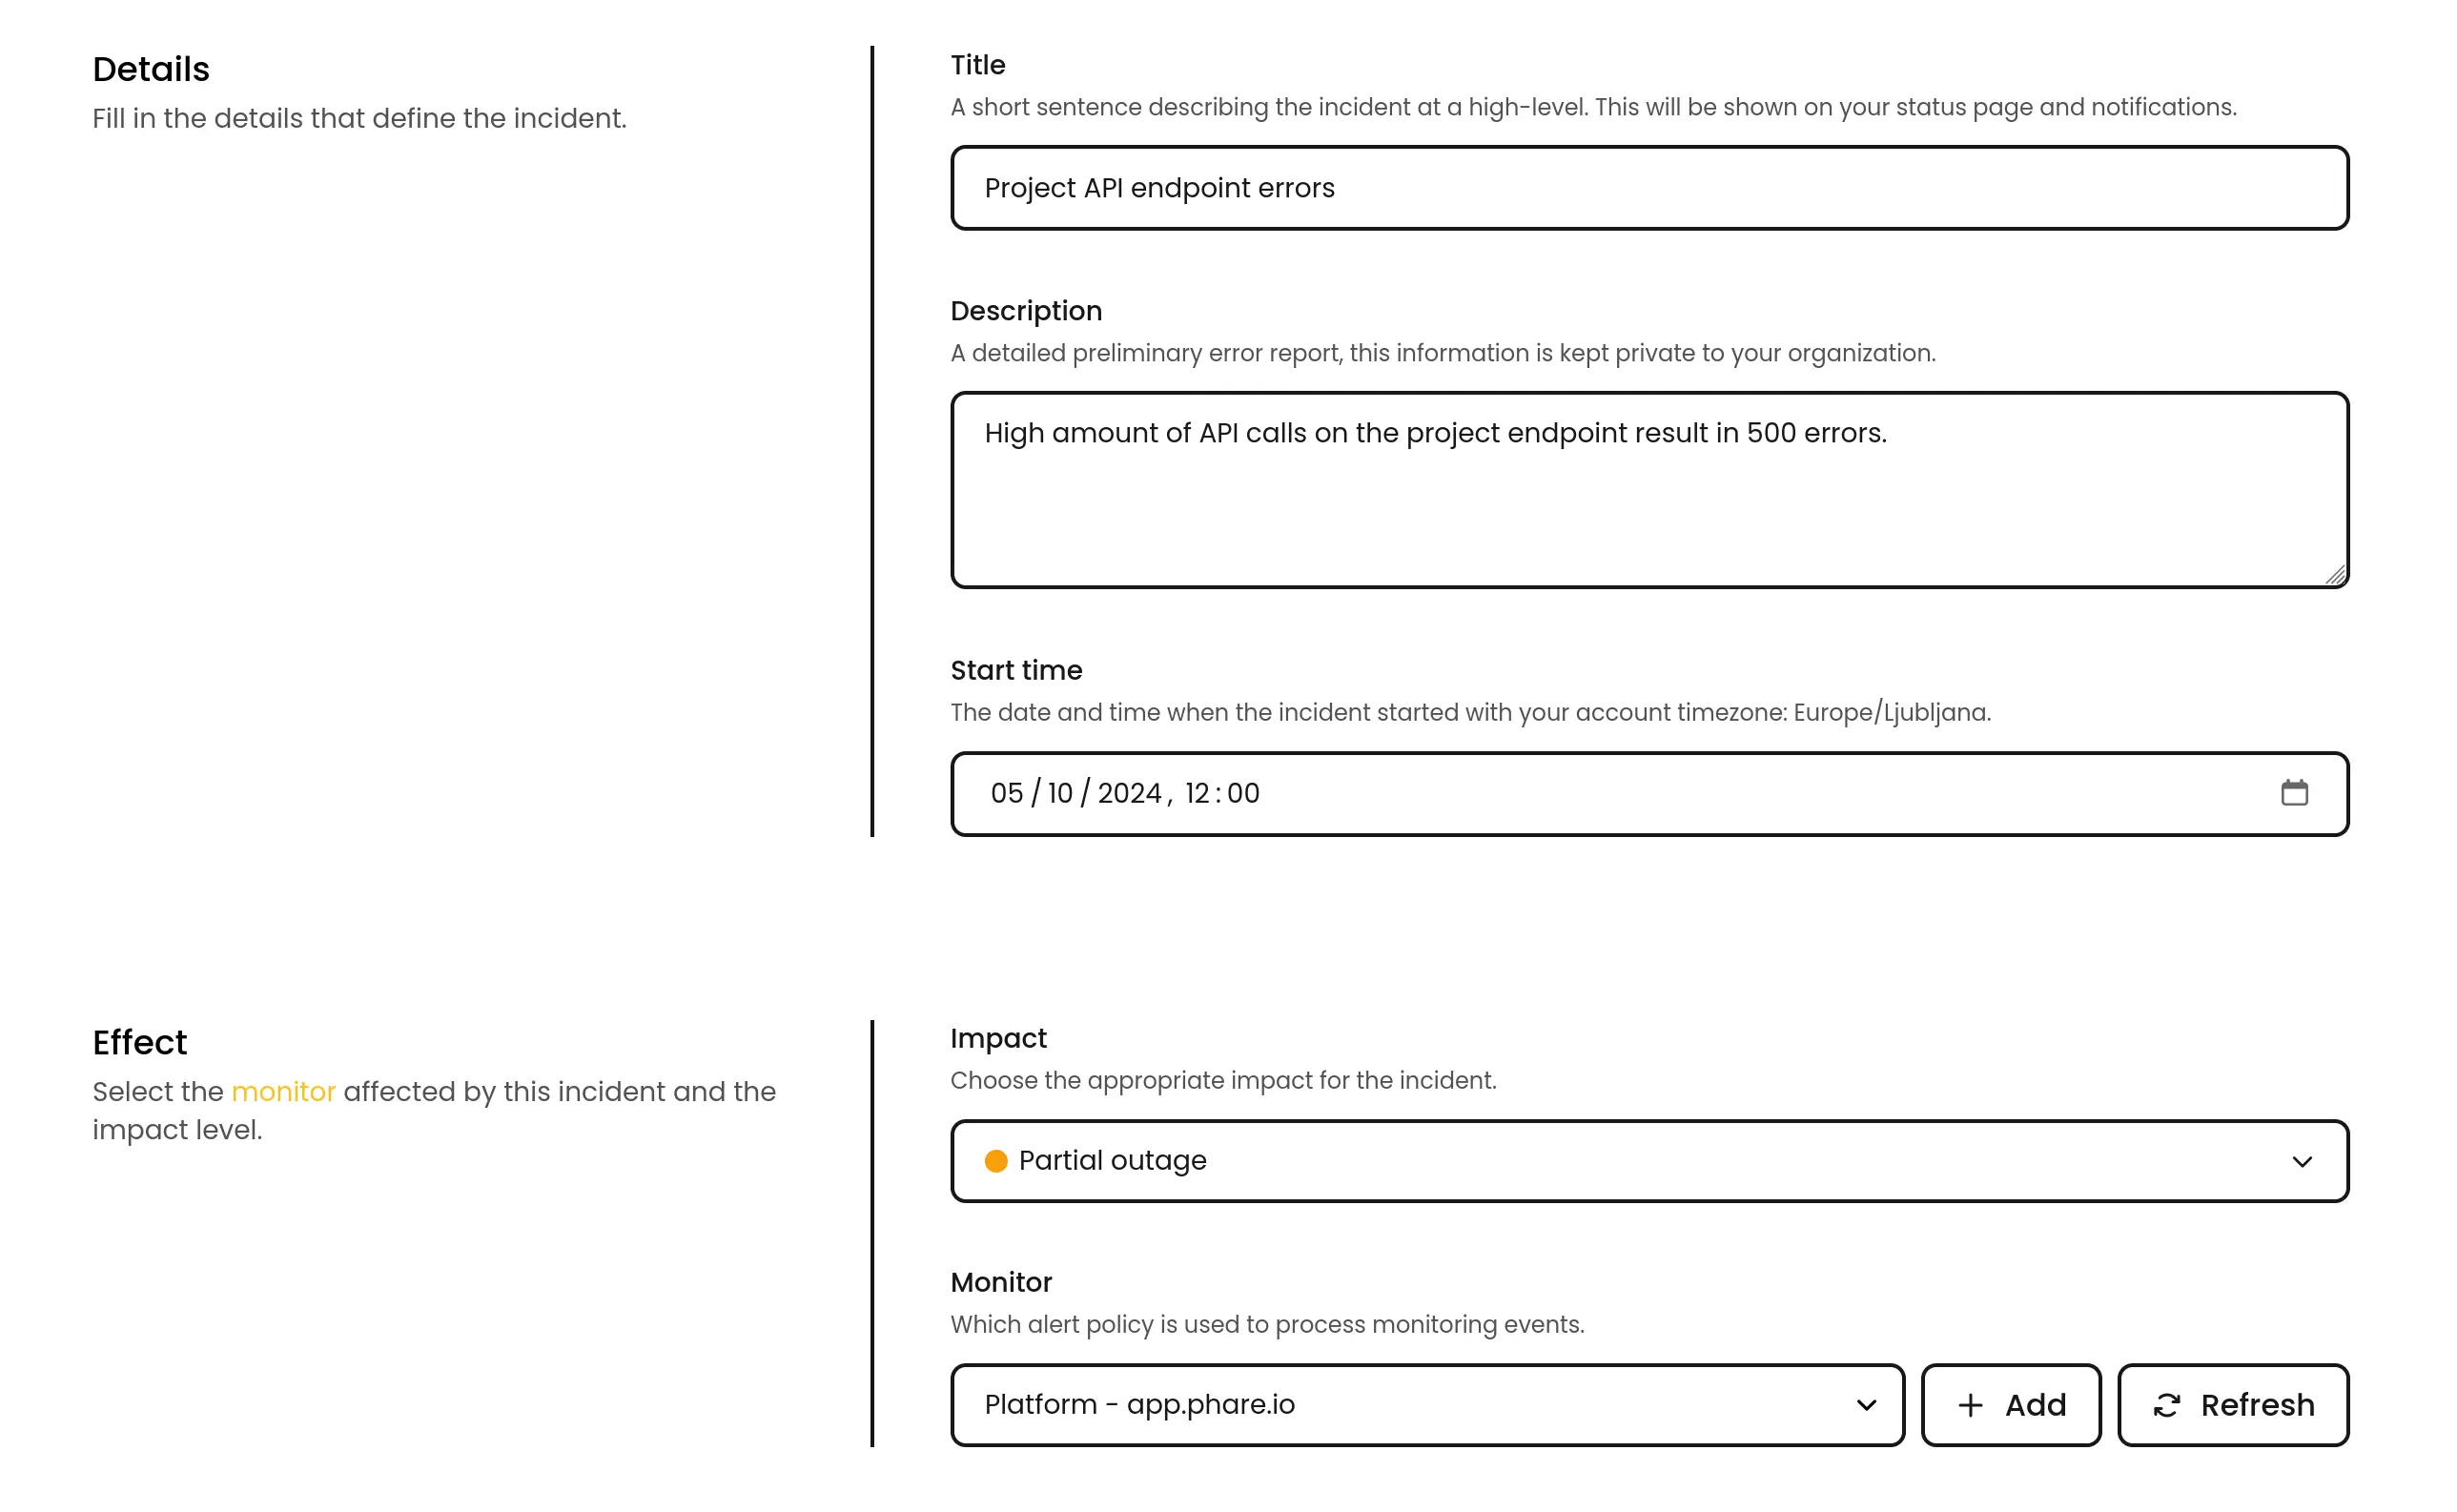
## Incident creation
*October 7th, 2024*
Incidents can now be created manually, this feature allows you to easily track and manage incidents that are not automatically detected by uptime monitoring checks.
It is now also possible to modify incident created automatically by the platform, allowing you to customize incident titles shown on your status page, and add more details to the incident report.
Manually created incident uses alert policies under the hood, and are not automatically resolved when associated monitors are successful.
We hope that you will be able to better communicate with your users during incidents with this new feature.
***
## Incident creation
*October 7th, 2024*
Incidents can now be created manually, this feature allows you to easily track and manage incidents that are not automatically detected by uptime monitoring checks.
It is now also possible to modify incident created automatically by the platform, allowing you to customize incident titles shown on your status page, and add more details to the incident report.
Manually created incident uses alert policies under the hood, and are not automatically resolved when associated monitors are successful.
We hope that you will be able to better communicate with your users during incidents with this new feature.
 ***
## Phare for good
*August 30th, 2024*
We are thrilled to announce the "Phare for Good" initiative, offering an extended free plan to open source projects and nonprofit organizations.
This is our way of supporting those who are making a positive impact by providing our full suite of monitoring and incident management tools, completely free.
If you're driving change through technology or social causes, we're here to help keep your online presence strong and reliable.
Join the program here: [https://phare.io/for-good](https://phare.io/for-good)
***
## Phare for good
*August 30th, 2024*
We are thrilled to announce the "Phare for Good" initiative, offering an extended free plan to open source projects and nonprofit organizations.
This is our way of supporting those who are making a positive impact by providing our full suite of monitoring and incident management tools, completely free.
If you're driving change through technology or social causes, we're here to help keep your online presence strong and reliable.
Join the program here: [https://phare.io/for-good](https://phare.io/for-good)
 ***
## Blog
*August 22th, 2024*
We've had some exciting knowledge to share recently, so we've decided to launch an official blog for Phare. We'll post new content occasionally, but only when we have something valuable to share.
You can already read a few articles:
* [Downsampling time series data](https://phare.io/blog/downsampling-time-series-data/)
* [How we run Ghost on Docker with subdirectory routing](https://phare.io/blog/how-we-run-ghost-on-docker-with-subdirectory-routing/)
* [Best practices to configure an uptime monitoring service](https://phare.io/blog/best-practices-to-configure-an-uptime-monitoring-service/)
***
## Phare platform makeover
*August 5th, 2024*
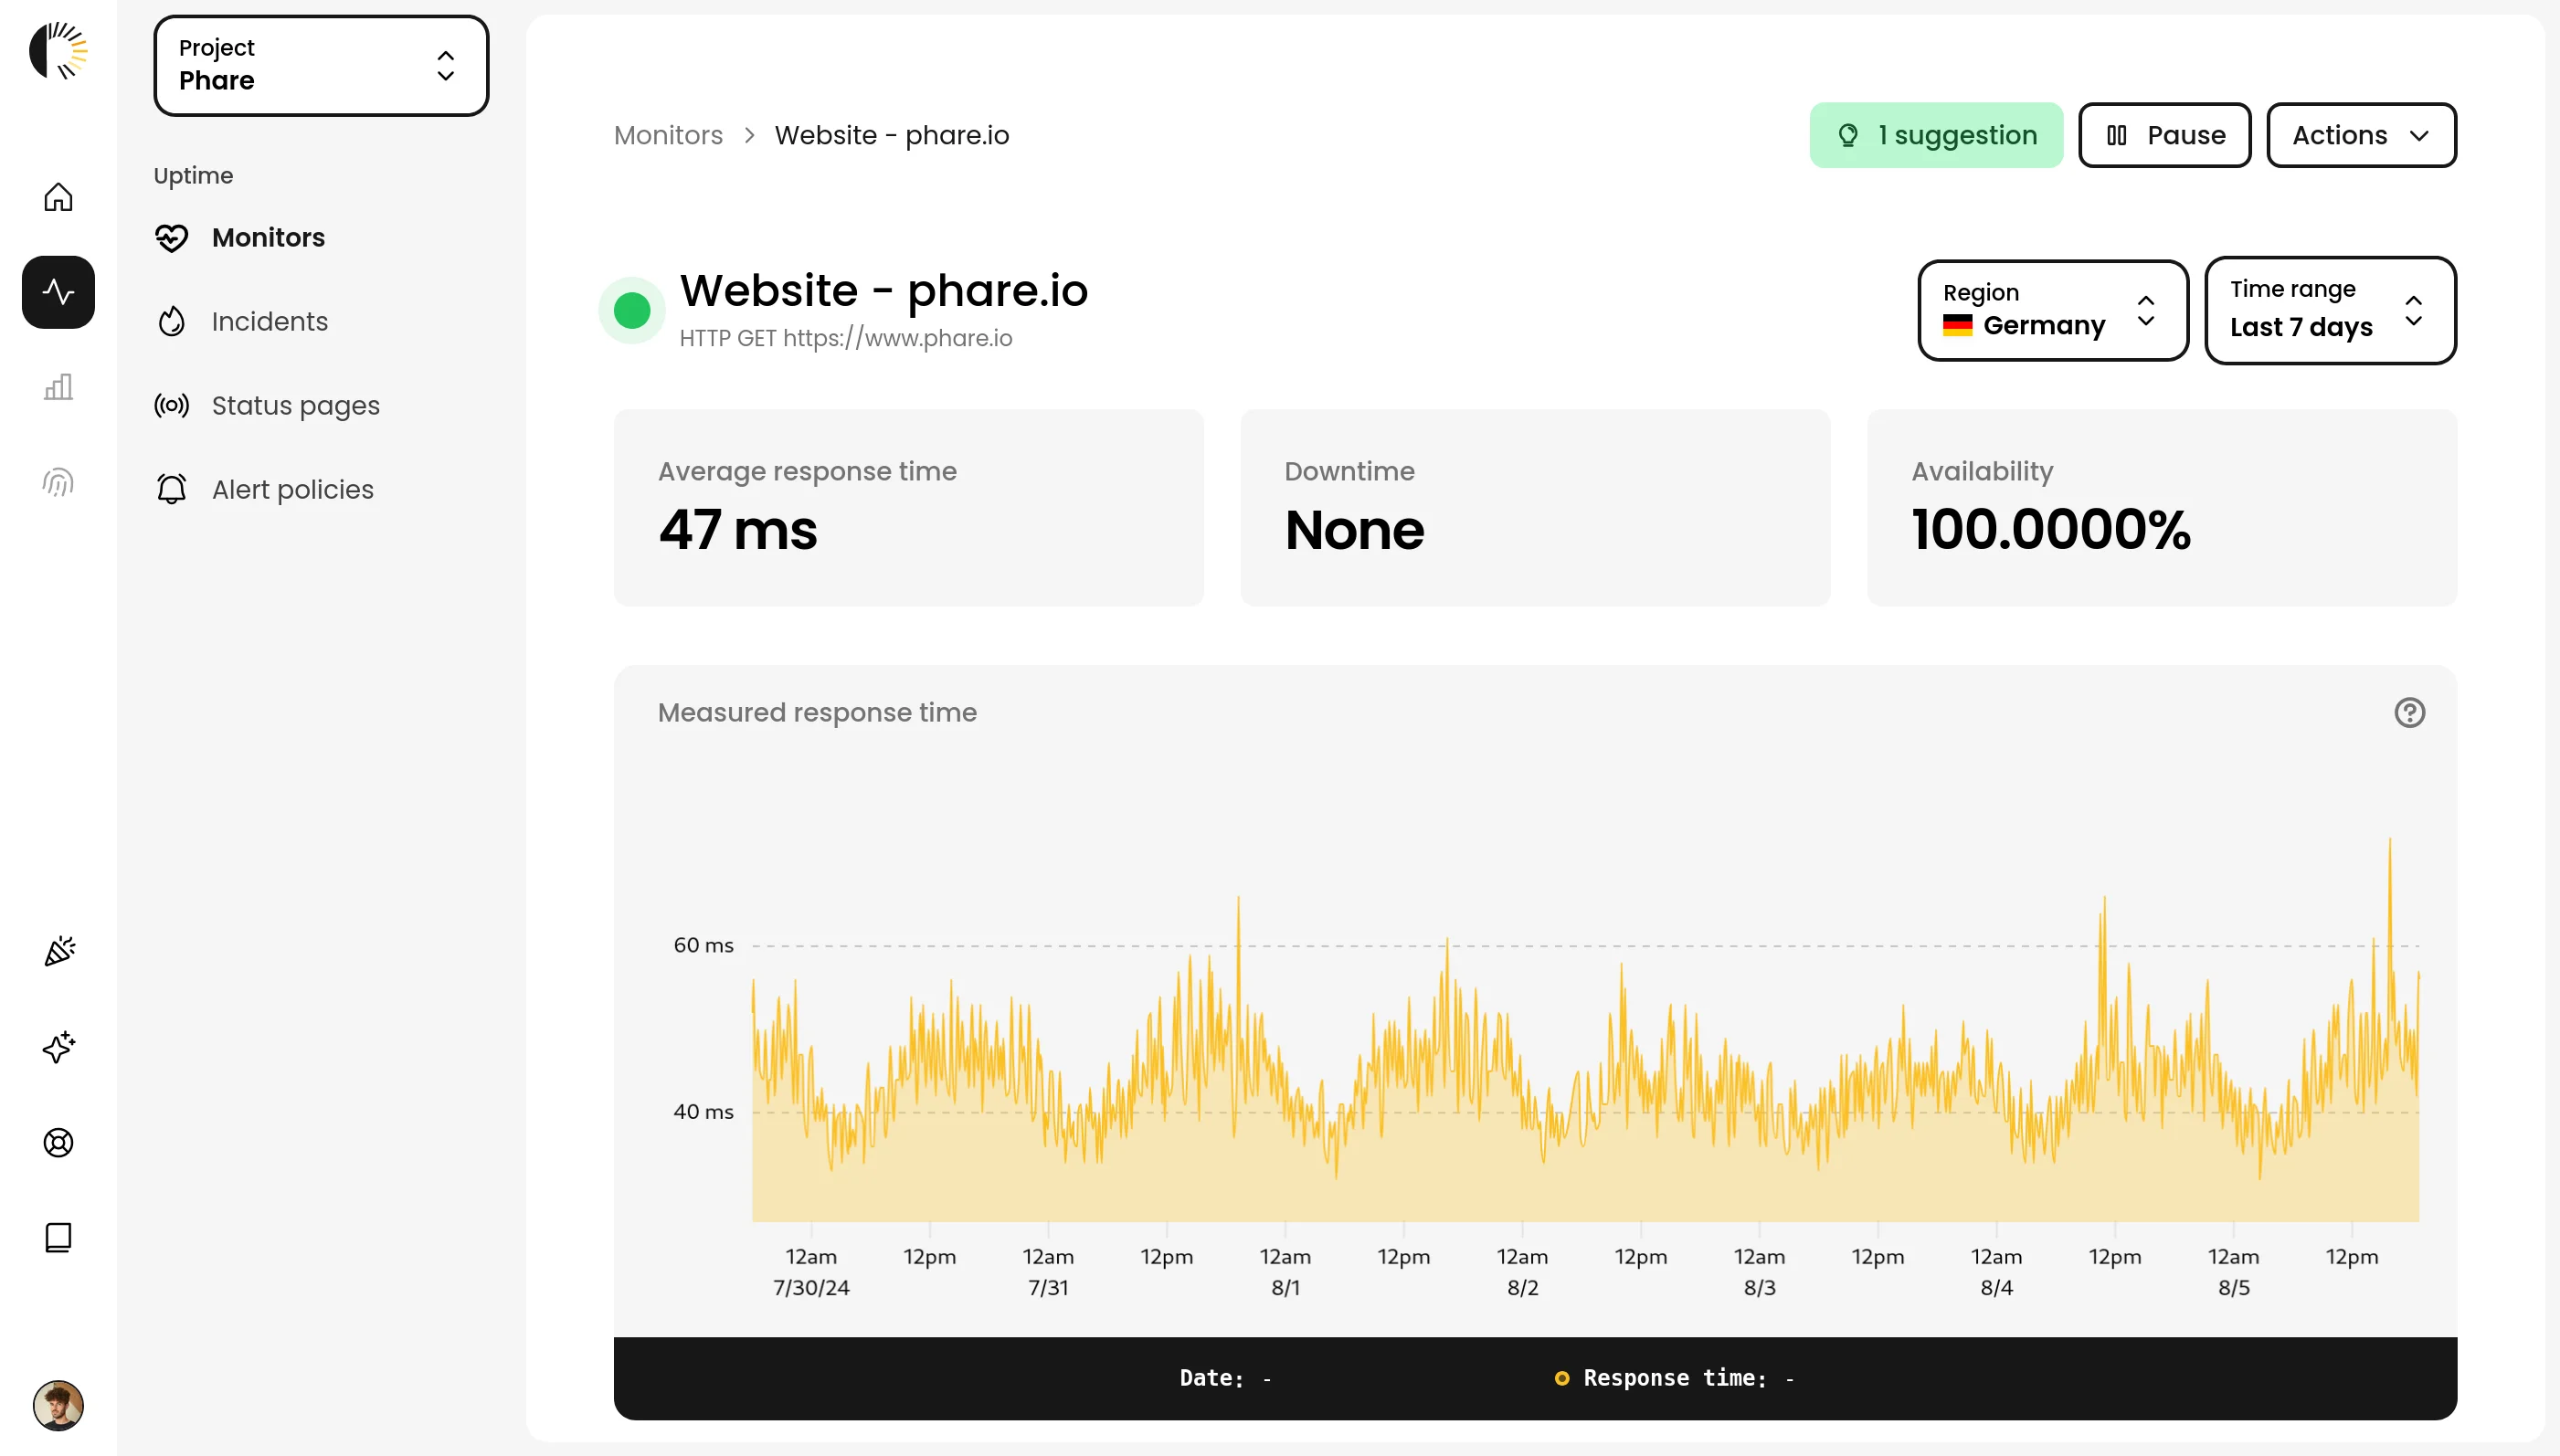
The Phare platform received a makeover focused on improving the navigation and user experience. The new design provides a cleaner and more intuitive interface, making it easier to access the features you need. Most pages have been updated with many small improvements to improve the overall user experience.
Your monitoring pages have also been redesigned slightly and given a new filter to show performance data specific to a region. This allows you to quickly identify any regional performance issues and take appropriate action.
***
## Blog
*August 22th, 2024*
We've had some exciting knowledge to share recently, so we've decided to launch an official blog for Phare. We'll post new content occasionally, but only when we have something valuable to share.
You can already read a few articles:
* [Downsampling time series data](https://phare.io/blog/downsampling-time-series-data/)
* [How we run Ghost on Docker with subdirectory routing](https://phare.io/blog/how-we-run-ghost-on-docker-with-subdirectory-routing/)
* [Best practices to configure an uptime monitoring service](https://phare.io/blog/best-practices-to-configure-an-uptime-monitoring-service/)
***
## Phare platform makeover
*August 5th, 2024*
The Phare platform received a makeover focused on improving the navigation and user experience. The new design provides a cleaner and more intuitive interface, making it easier to access the features you need. Most pages have been updated with many small improvements to improve the overall user experience.
Your monitoring pages have also been redesigned slightly and given a new filter to show performance data specific to a region. This allows you to quickly identify any regional performance issues and take appropriate action.
 ***
## Improved monitoring performance chart
*July 29th, 2024*
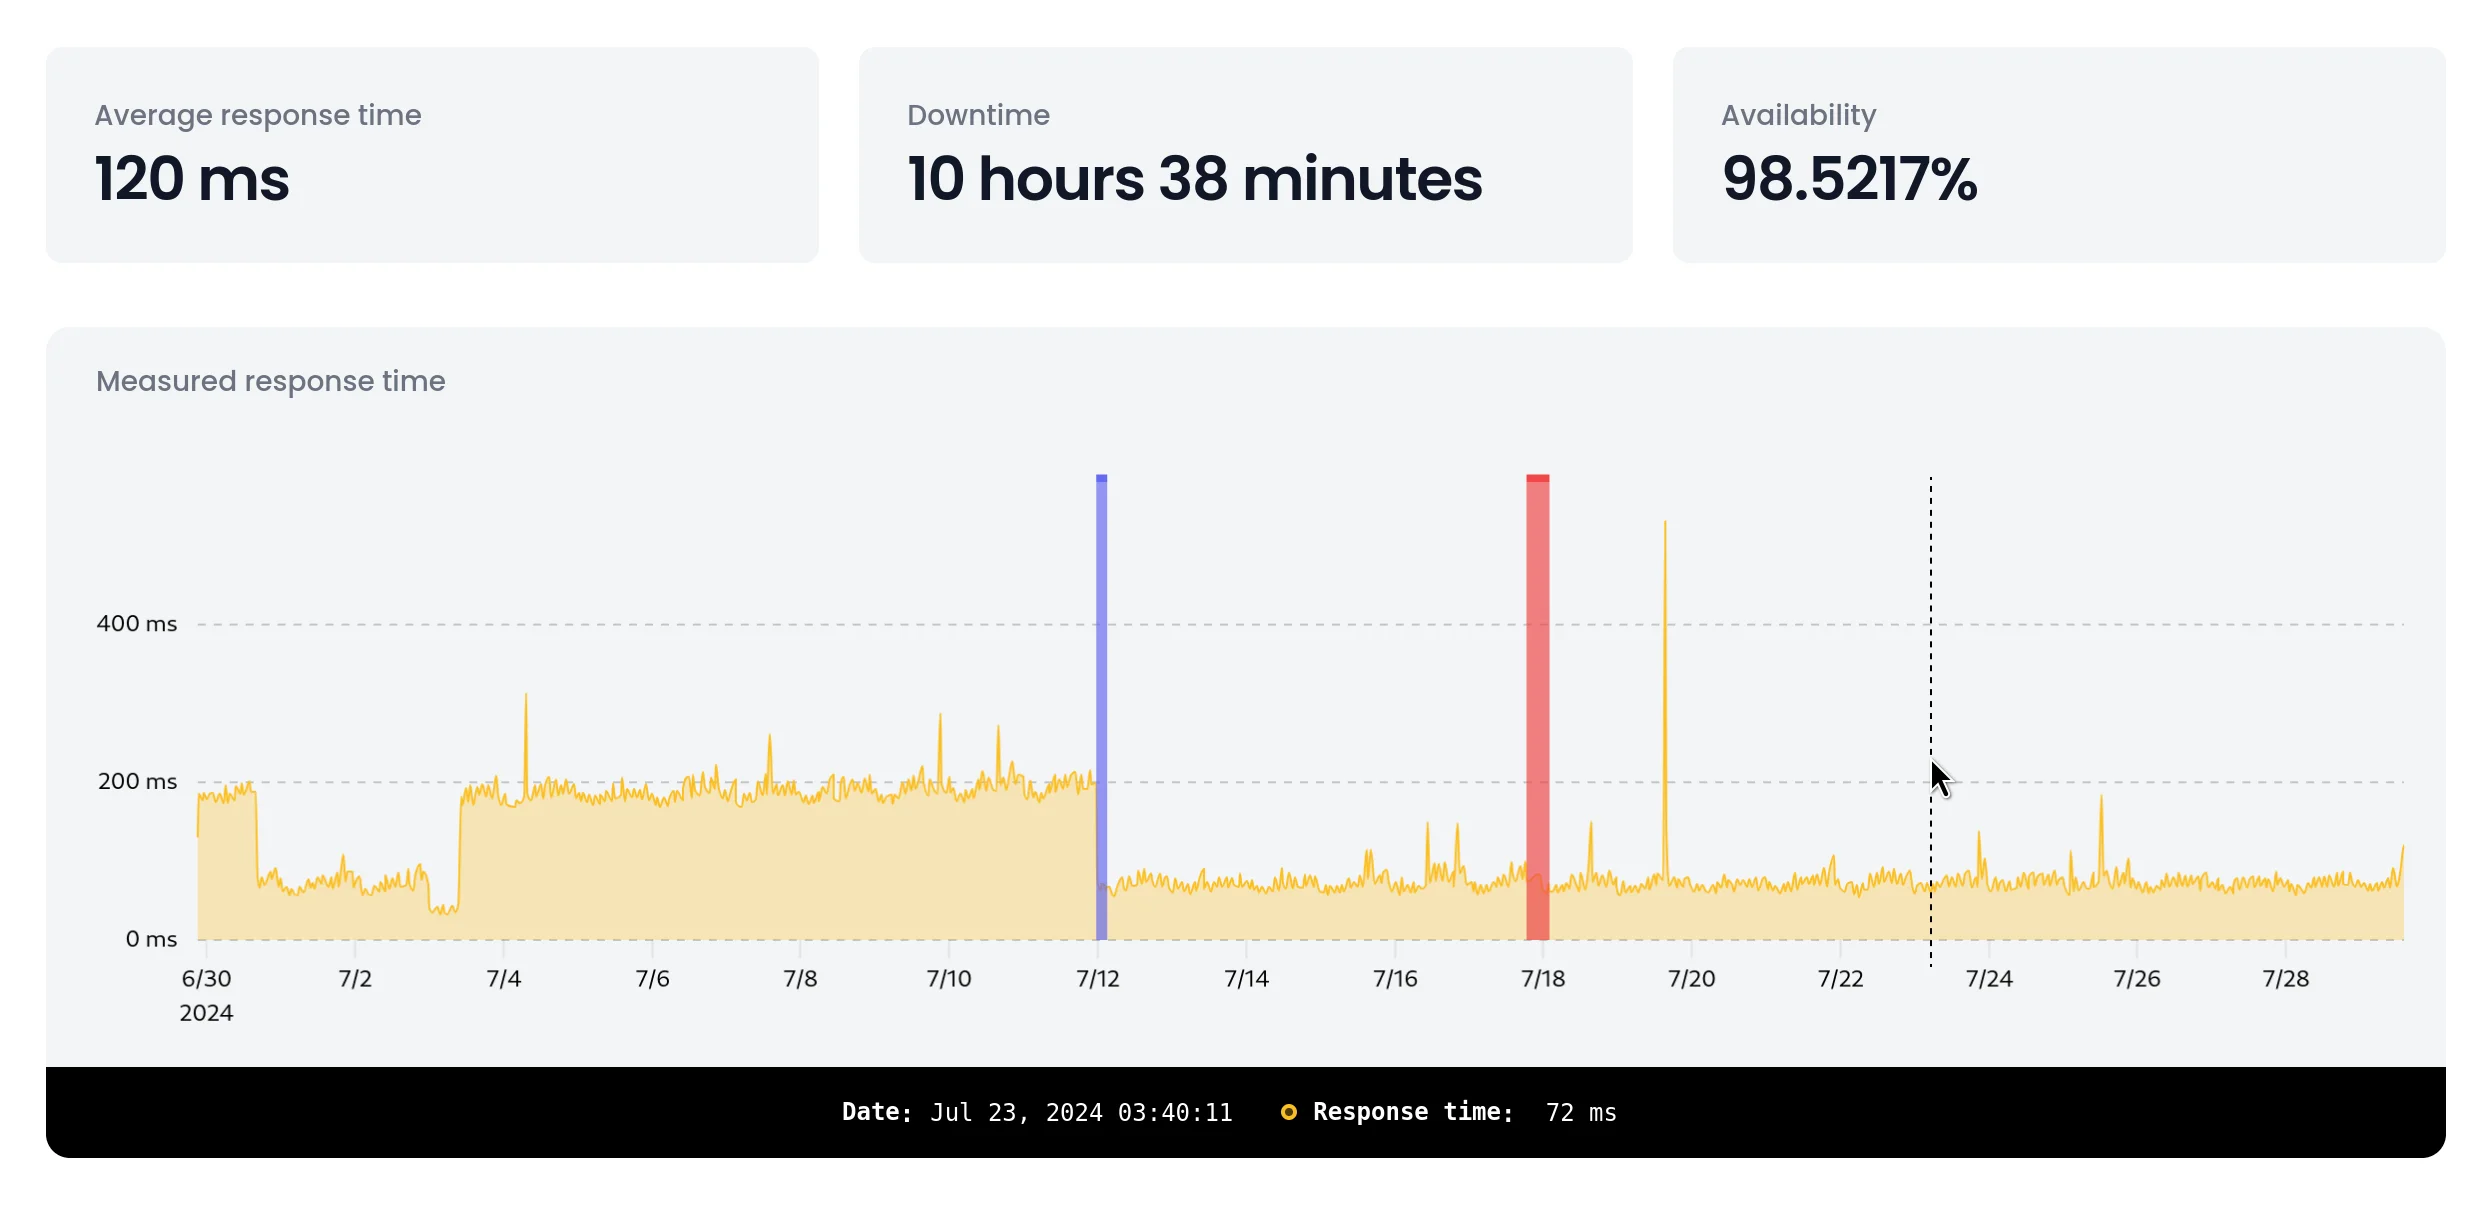
The algorithm used to generate the performance chart has been improved to provide a more accurate representation of your monitor's performance. This change allows for better anomaly removal and a more precise representation of the overall performance showed by your monitor.
Incidents are now displayed on the chart with their respective impact color, making it easier to understand any correlation at a glance.
If you're interested in learning more about how we generate the performance chart, you can read our article on [downsampling time series data](/articles/downsampling-time-series-data).
***
## Improved monitoring performance chart
*July 29th, 2024*
The algorithm used to generate the performance chart has been improved to provide a more accurate representation of your monitor's performance. This change allows for better anomaly removal and a more precise representation of the overall performance showed by your monitor.
Incidents are now displayed on the chart with their respective impact color, making it easier to understand any correlation at a glance.
If you're interested in learning more about how we generate the performance chart, you can read our article on [downsampling time series data](/articles/downsampling-time-series-data).
 ***
## Custom domains for status pages
*July 22th, 2024*
You can now use your own domain for your status pages, providing a more seamless and branded experience for your users. This feature allows you to create a custom subdomain for your status pages, such as `status.example.com`, and link it to your Phare status page.
The Phare-provided subdomain `*.status.phare.io` attached to your status page will stay active and will automatically redirect users to your custom domain if you configure one.
Instructions on how to set up a custom domain for your status page can be found in the [documentation](/uptime/status-pages#custom-domain).
***
## Custom domains for status pages
*July 22th, 2024*
You can now use your own domain for your status pages, providing a more seamless and branded experience for your users. This feature allows you to create a custom subdomain for your status pages, such as `status.example.com`, and link it to your Phare status page.
The Phare-provided subdomain `*.status.phare.io` attached to your status page will stay active and will automatically redirect users to your custom domain if you configure one.
Instructions on how to set up a custom domain for your status page can be found in the [documentation](/uptime/status-pages#custom-domain).
 ***
## Outgoing webhooks integration
*July 17th, 2024*
Outgoing webhooks are now available Phare platform, allowing you to connect with third-party tools or build your own integration.
The webhook payload can be customized for each alert rule event that you would like to use. You are free to use any valid JSON structure with access to many variables to help you build the perfect payload for your use case.
***
## Outgoing webhooks integration
*July 17th, 2024*
Outgoing webhooks are now available Phare platform, allowing you to connect with third-party tools or build your own integration.
The webhook payload can be customized for each alert rule event that you would like to use. You are free to use any valid JSON structure with access to many variables to help you build the perfect payload for your use case.
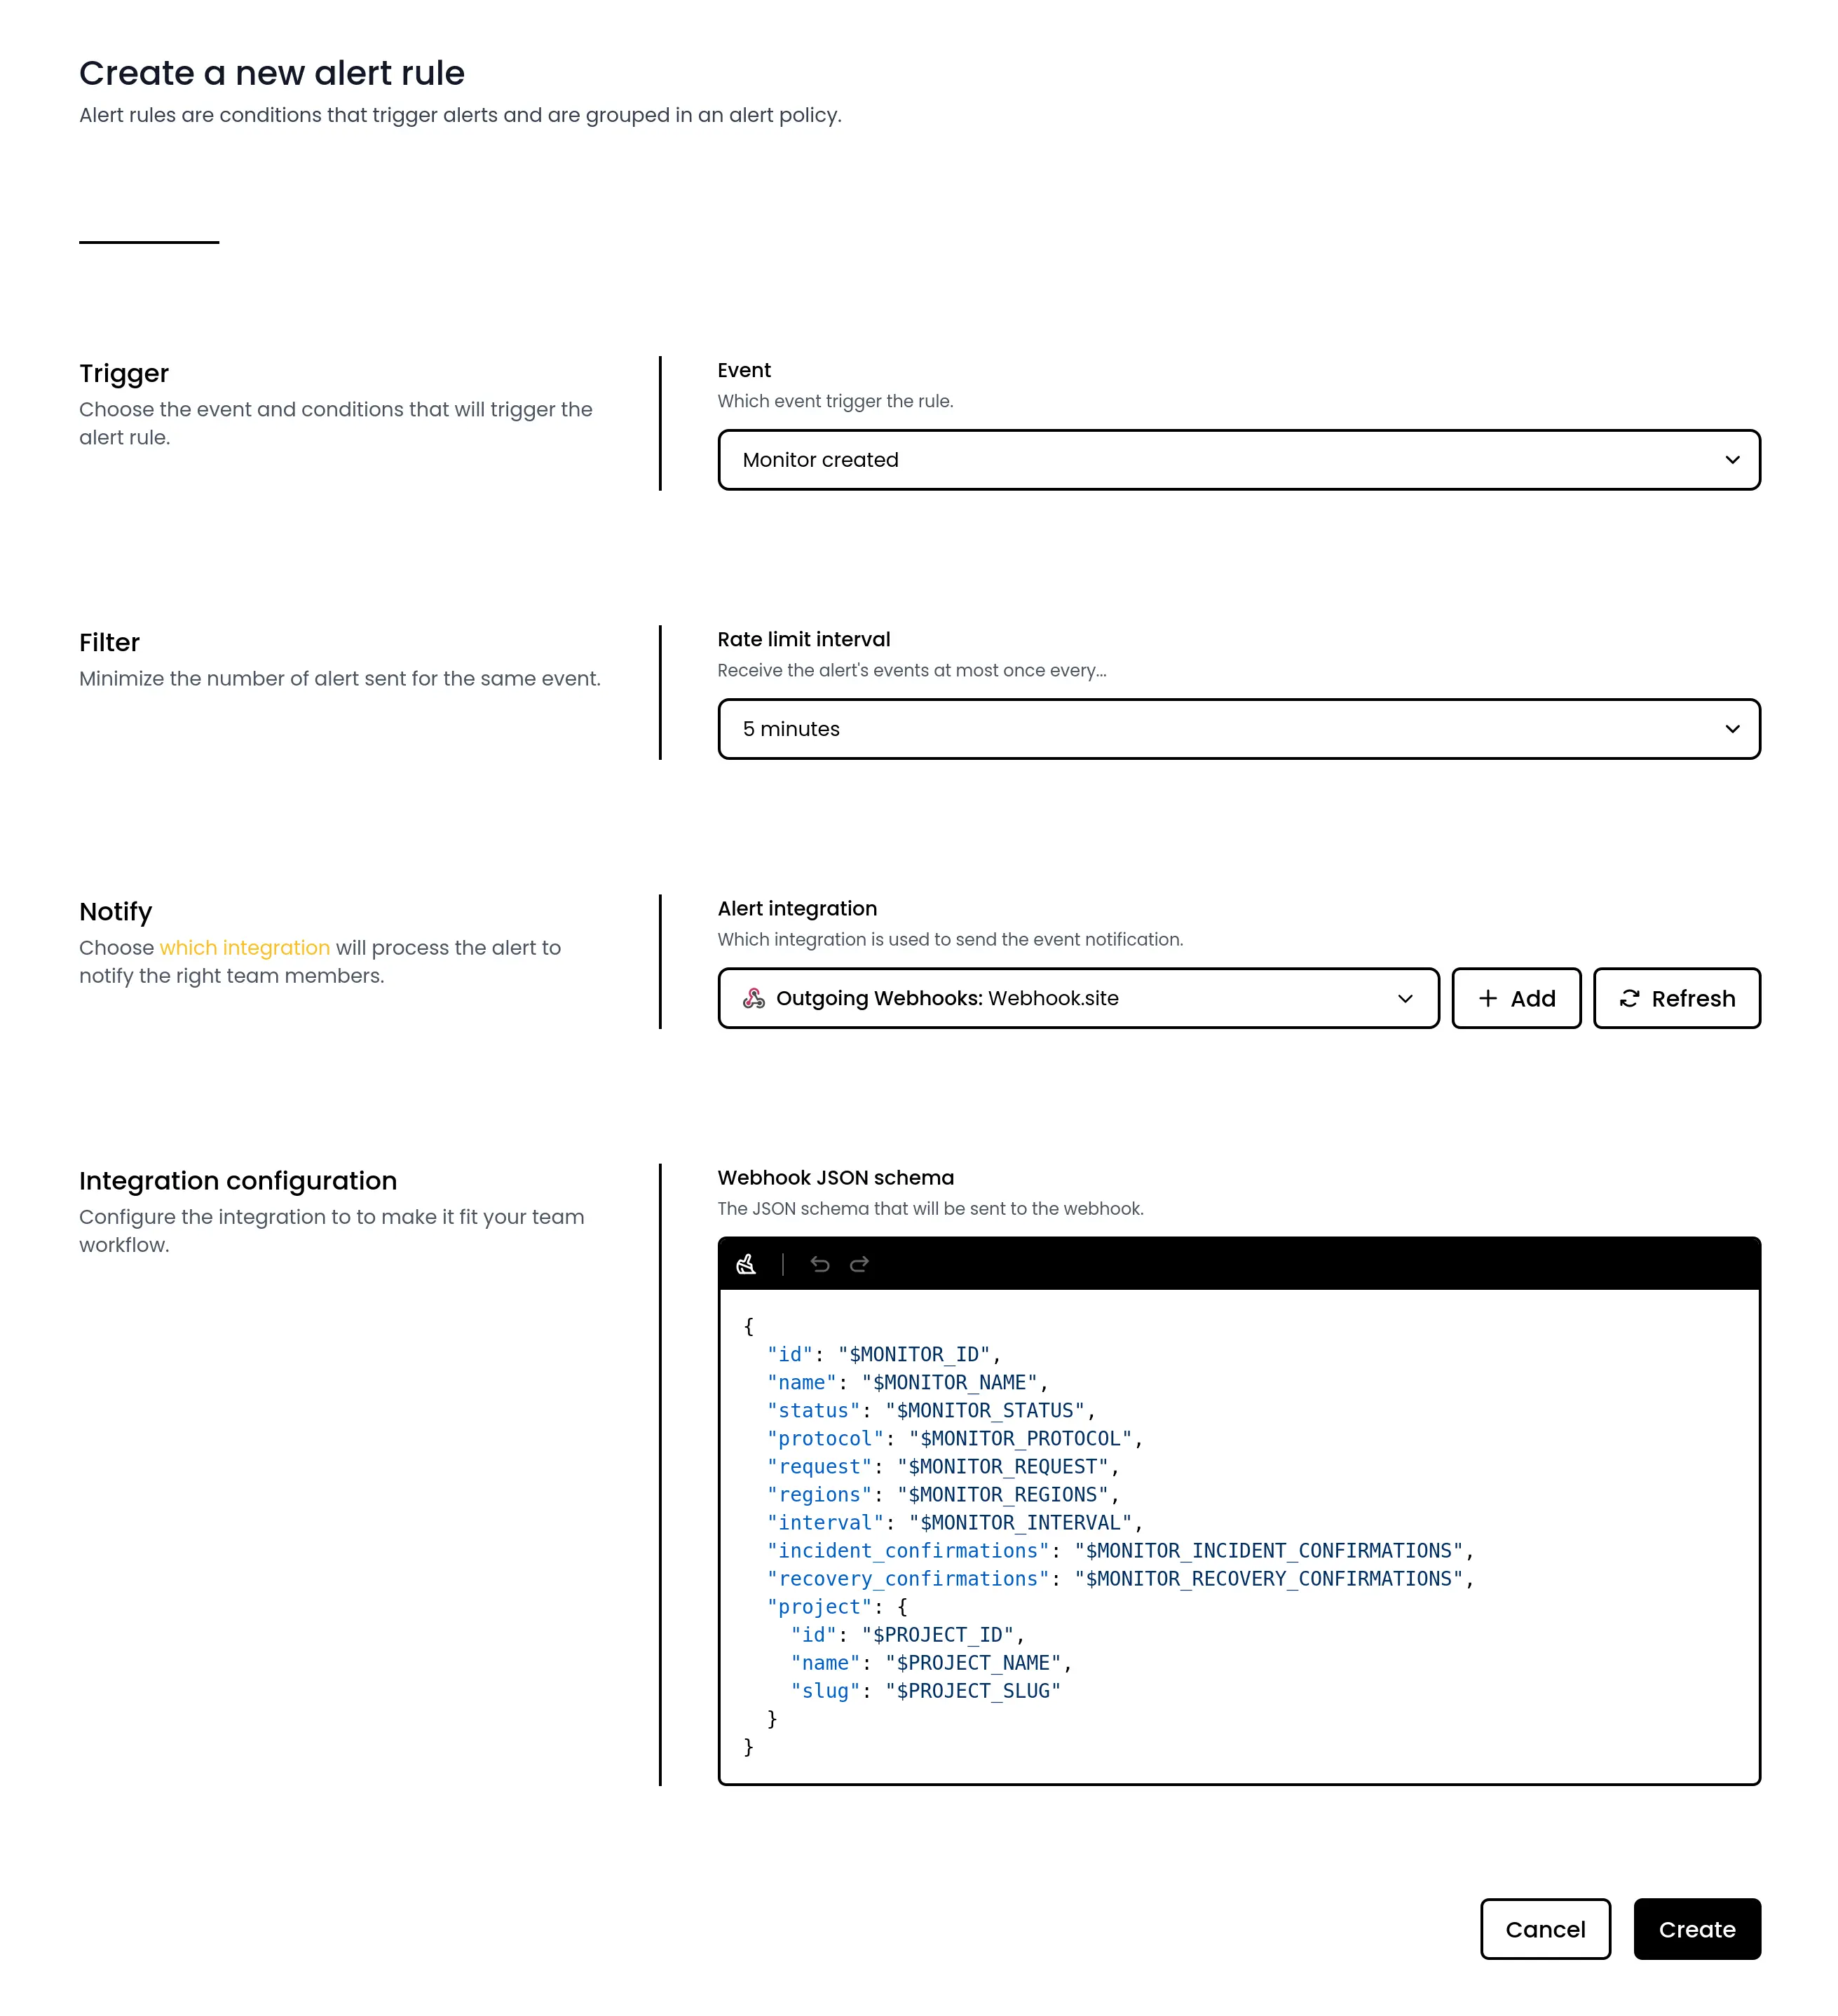 Webhooks are secured with an HMAC sha256 signature to ensure the authenticity of the payload, in a way that is resistant to replay and timing attacks. A retry policy is also in place to ensure that your webhook is safely delivered, even if your server is temporarily down.
One more thing, you can also browse the history of the payloads sent to your webhook to easily debug and monitor the integration.
Webhooks are secured with an HMAC sha256 signature to ensure the authenticity of the payload, in a way that is resistant to replay and timing attacks. A retry policy is also in place to ensure that your webhook is safely delivered, even if your server is temporarily down.
One more thing, you can also browse the history of the payloads sent to your webhook to easily debug and monitor the integration.
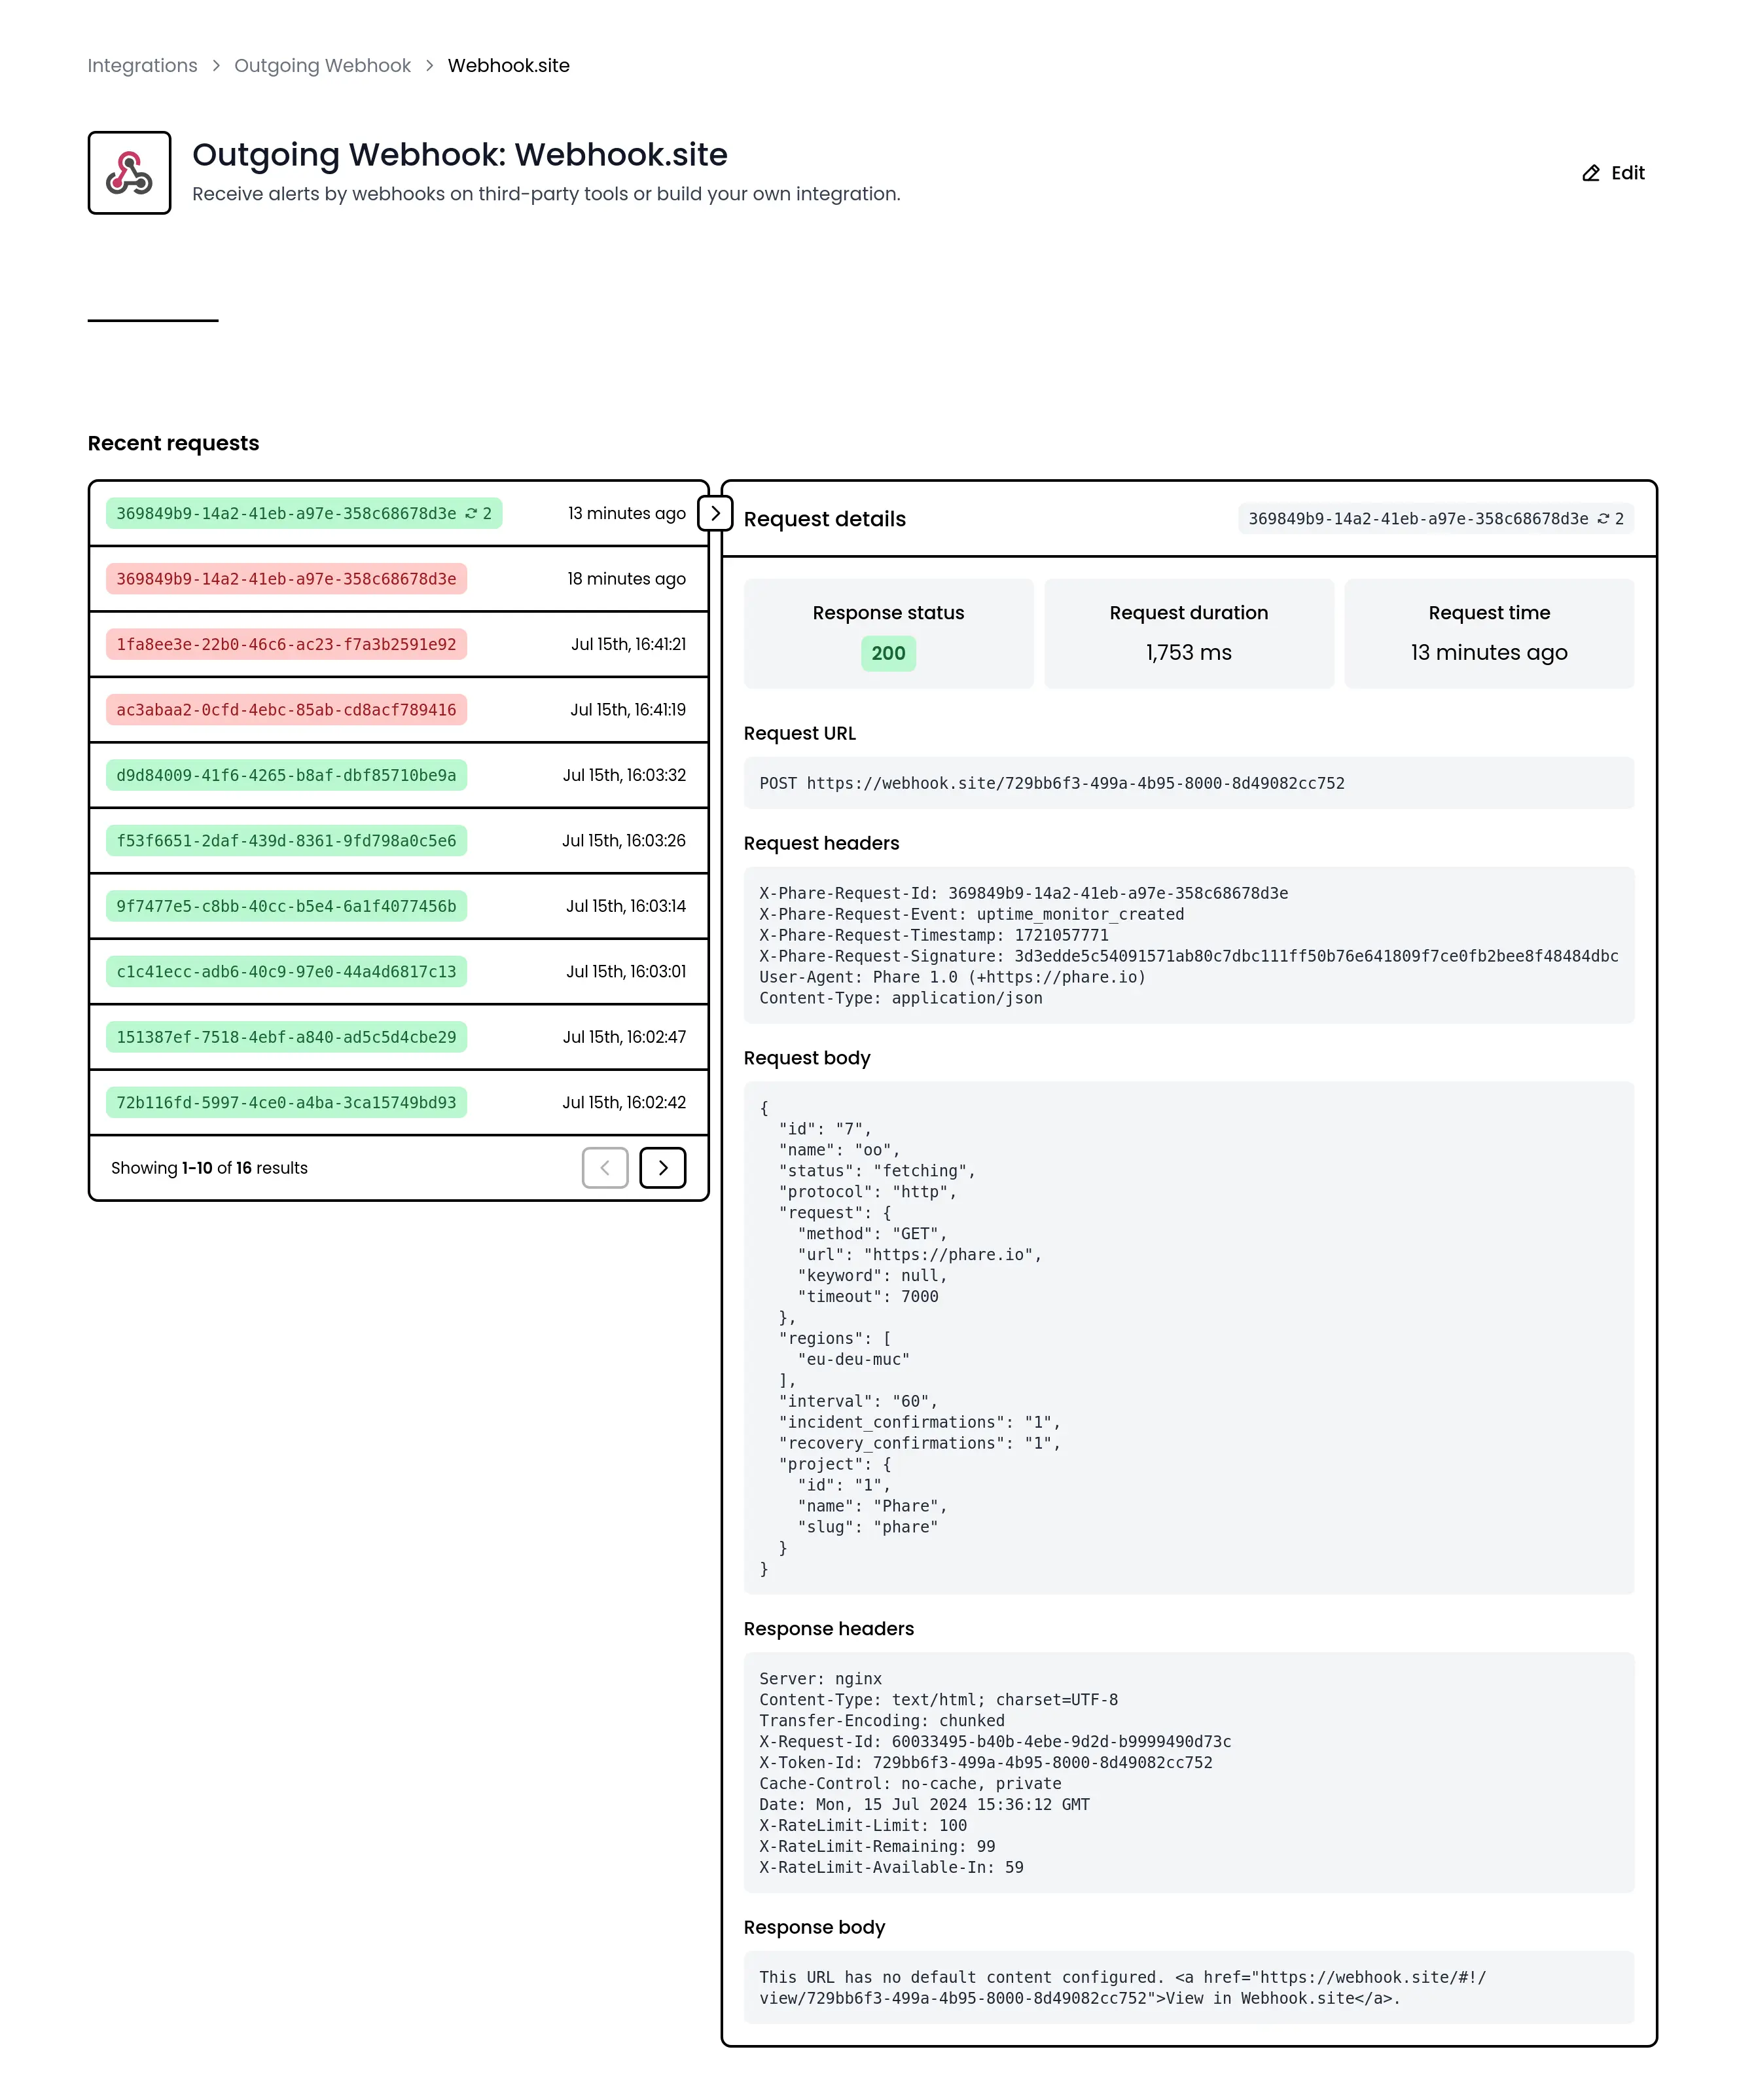 You can learn more about the outgoing webhooks integration in the [documentation](/integrations/outgoing-webhook).
***
## Billing quotas estimation
*July 11th, 2024*
Billing quotas forecasting has been released on the Phare platform. This new feature provides greater visibility into your billing quota usage, helping you manage your resources more effectively.
On your organization billing page, you can now see detailed forecasts of your quota usage. This includes predictions based on your current usage patterns, allowing you to plan ahead and avoid service interruptions.
You can learn more about the outgoing webhooks integration in the [documentation](/integrations/outgoing-webhook).
***
## Billing quotas estimation
*July 11th, 2024*
Billing quotas forecasting has been released on the Phare platform. This new feature provides greater visibility into your billing quota usage, helping you manage your resources more effectively.
On your organization billing page, you can now see detailed forecasts of your quota usage. This includes predictions based on your current usage patterns, allowing you to plan ahead and avoid service interruptions.
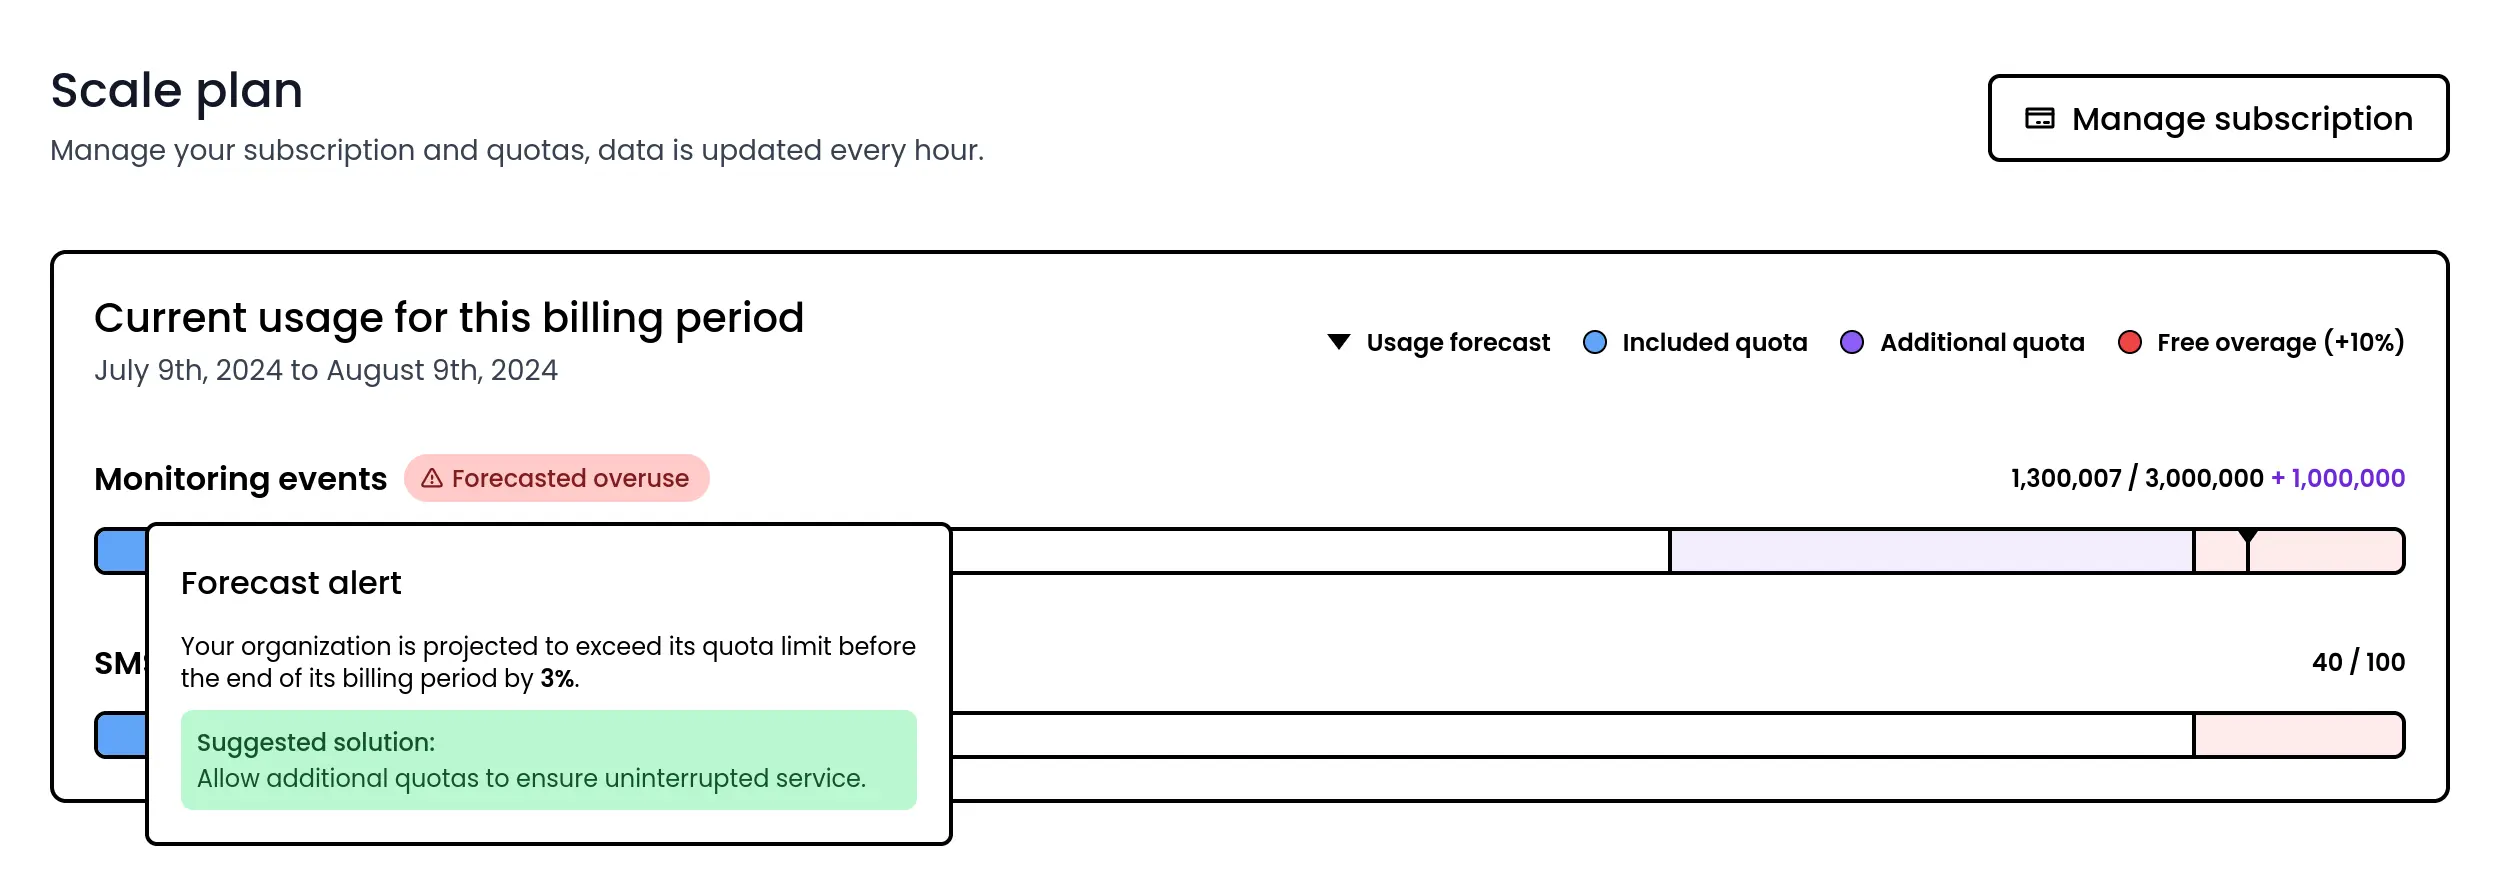 You will also be alerted when creating or updating a monitor if the action exceeds your monthly quota. This real-time feedback helps you make informed decisions and ensures that your monitoring setup remains within your desired limits.
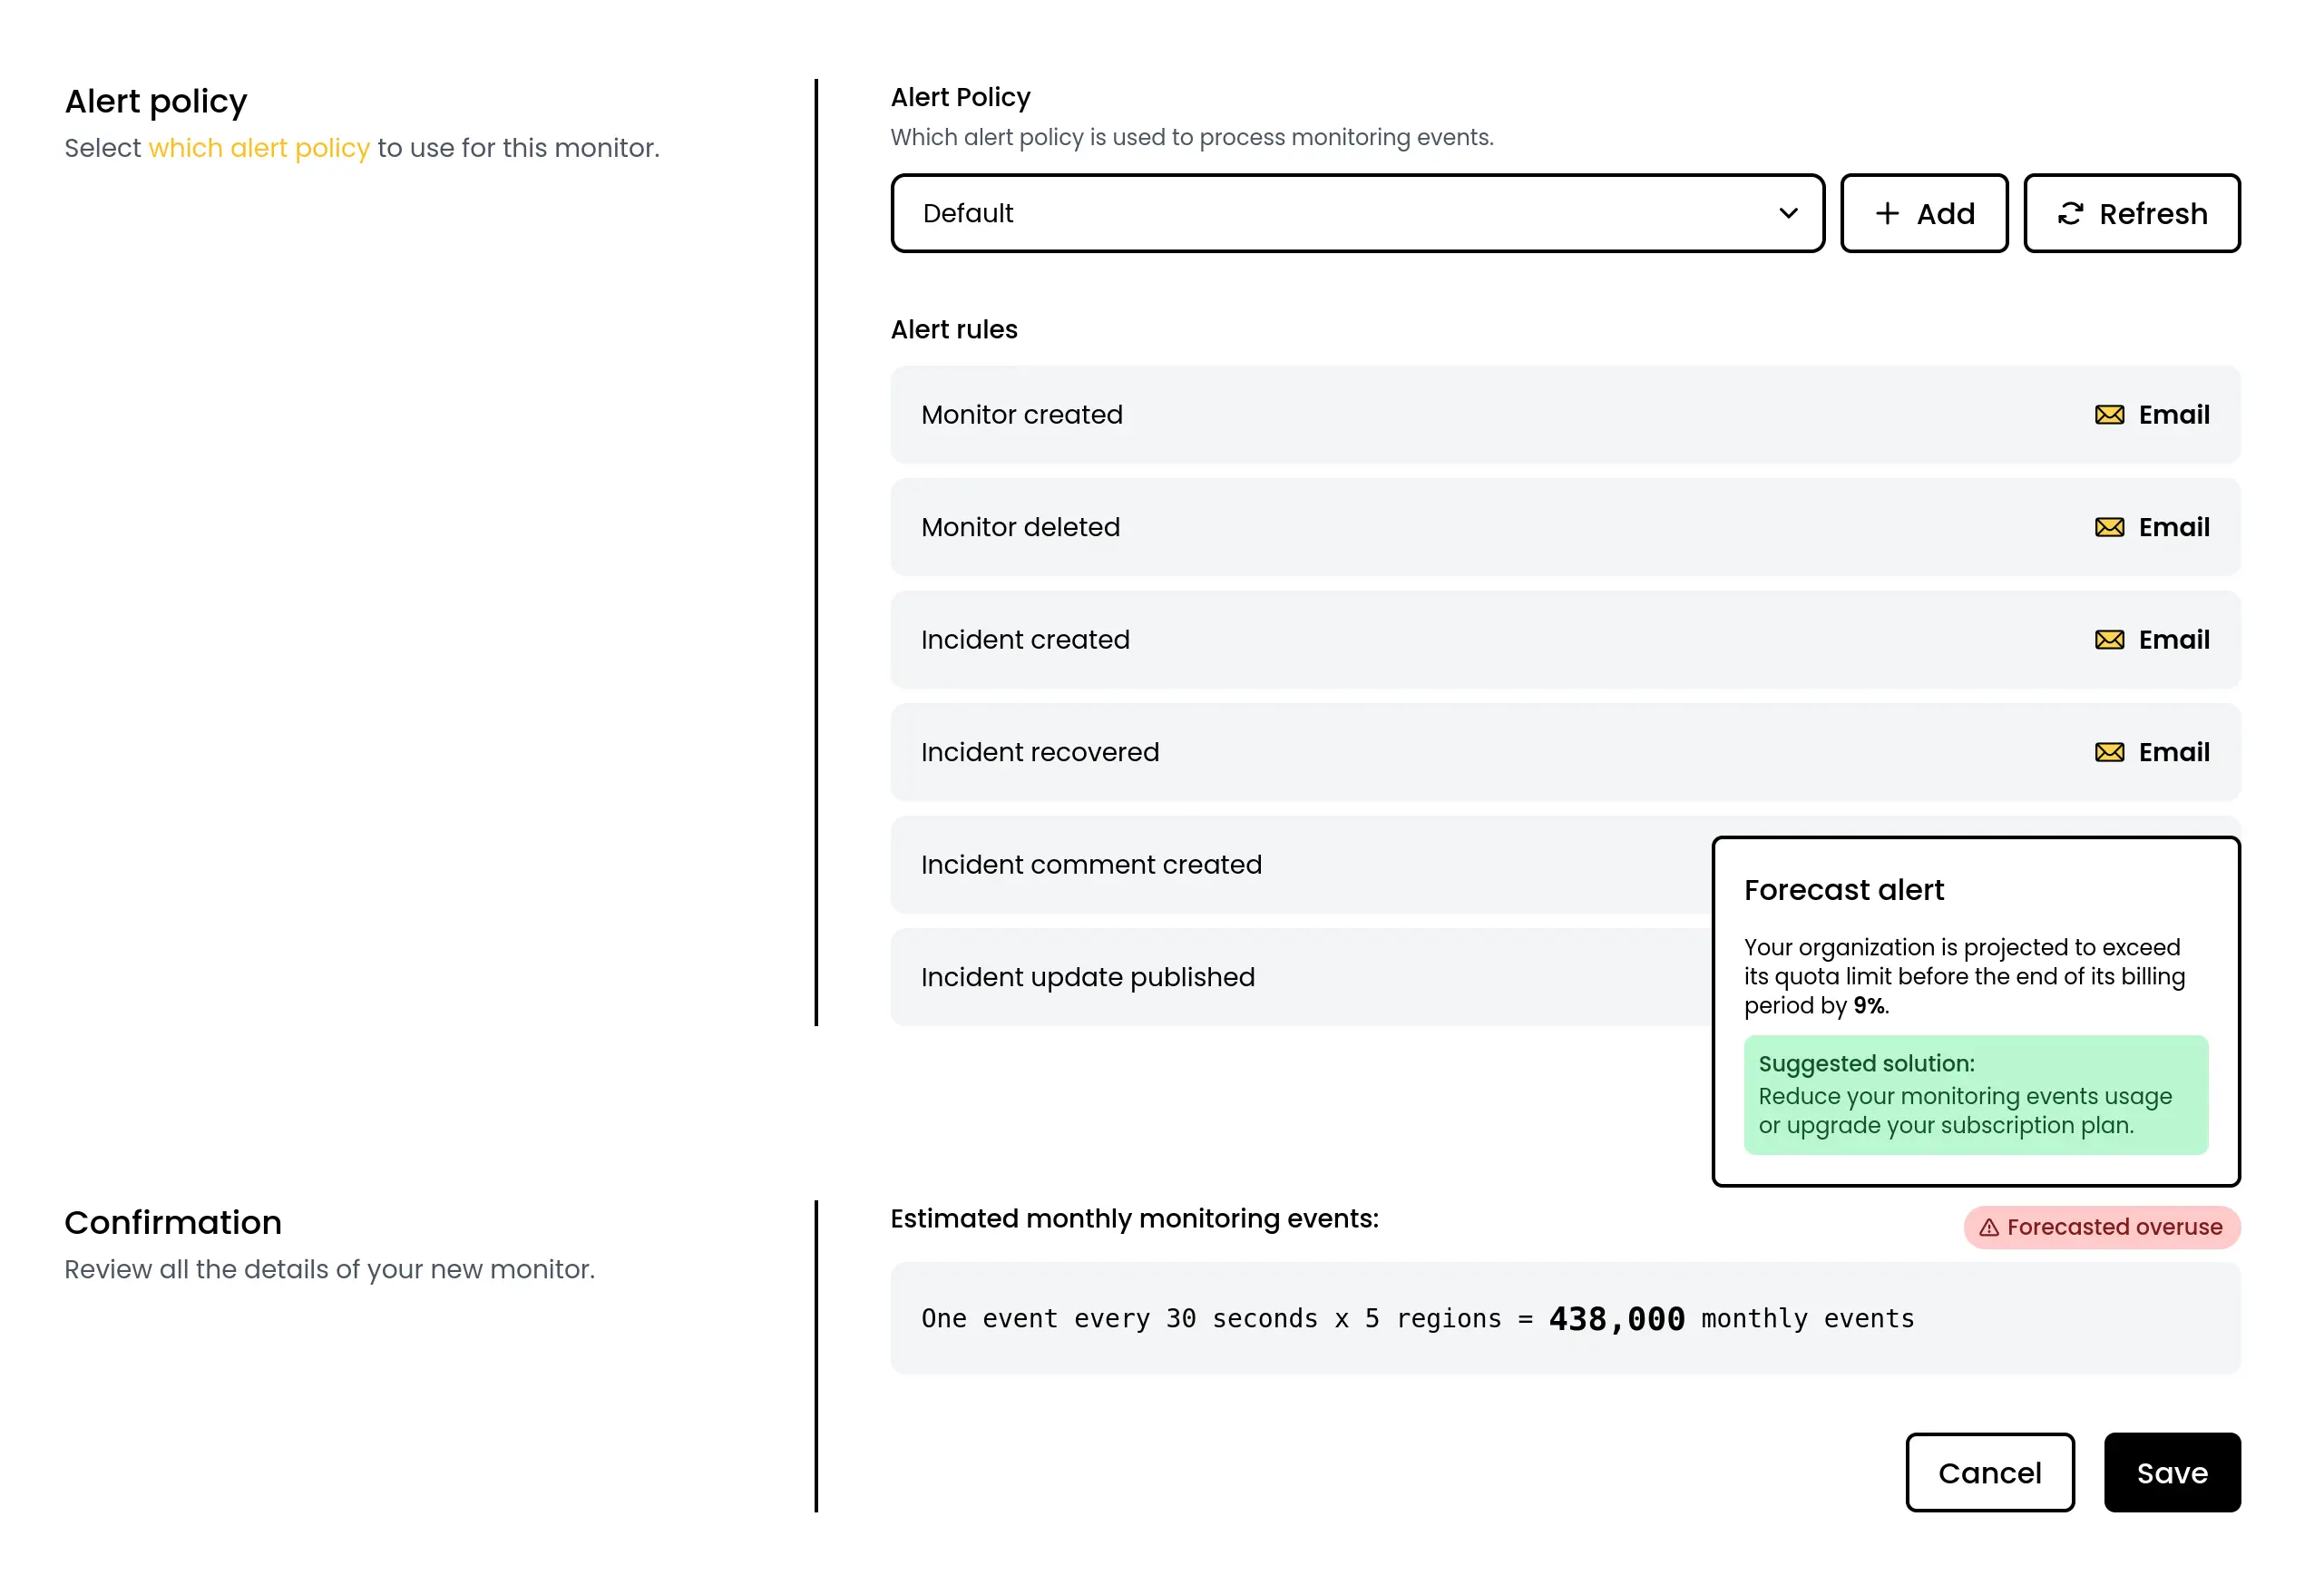 Billing transparency is a key part of our platform, and we are committed to providing you with the tools you need to monitor and control your usage effectively.
***
## New API endpoints: alert rules, incidents and status pages
*July 7th, 2024*
New API endpoints are available to help you programmatically interact with the Phare platform:
* [Alert rules](/api-reference/platform/alert-rules/list-alert-rules)
* [Incidents](/api-reference/uptime/incidents/list-incidents)
* [Status pages](/api-reference/uptime/status-pages/list-status-pages)
These new API endpoints enhance your ability to automate and streamline your monitoring, alerting, and incident management workflows, offering a more integrated and efficient approach to maintaining service reliability.
This release ends the current phase of API development with all major entities now available, allowing us to focus on stability to plan the end of the beta phase.
Billing transparency is a key part of our platform, and we are committed to providing you with the tools you need to monitor and control your usage effectively.
***
## New API endpoints: alert rules, incidents and status pages
*July 7th, 2024*
New API endpoints are available to help you programmatically interact with the Phare platform:
* [Alert rules](/api-reference/platform/alert-rules/list-alert-rules)
* [Incidents](/api-reference/uptime/incidents/list-incidents)
* [Status pages](/api-reference/uptime/status-pages/list-status-pages)
These new API endpoints enhance your ability to automate and streamline your monitoring, alerting, and incident management workflows, offering a more integrated and efficient approach to maintaining service reliability.
This release ends the current phase of API development with all major entities now available, allowing us to focus on stability to plan the end of the beta phase.
 ***
## Monitoring timeout customization
*July 4th, 2024*
You can now customize the timeout duration for your monitors, offering greater control over your monitoring strategy for more accurate and reliable results.
This new feature allows you to set specific timeout values, taking into account DNS resolution, connection time, response time, and any redirections. By adjusting these settings, you can fine-tune the sensitivity of your checks to better meet your specific needs.
While the default timeout value of 7 seconds is optimized for most scenarios, providing a good balance and minimizing false positives, you now have the flexibility to modify this setting to better suit your unique requirements.
***
## Monitoring timeout customization
*July 4th, 2024*
You can now customize the timeout duration for your monitors, offering greater control over your monitoring strategy for more accurate and reliable results.
This new feature allows you to set specific timeout values, taking into account DNS resolution, connection time, response time, and any redirections. By adjusting these settings, you can fine-tune the sensitivity of your checks to better meet your specific needs.
While the default timeout value of 7 seconds is optimized for most scenarios, providing a good balance and minimizing false positives, you now have the flexibility to modify this setting to better suit your unique requirements.
 ***
## Smart monitoring suggestion
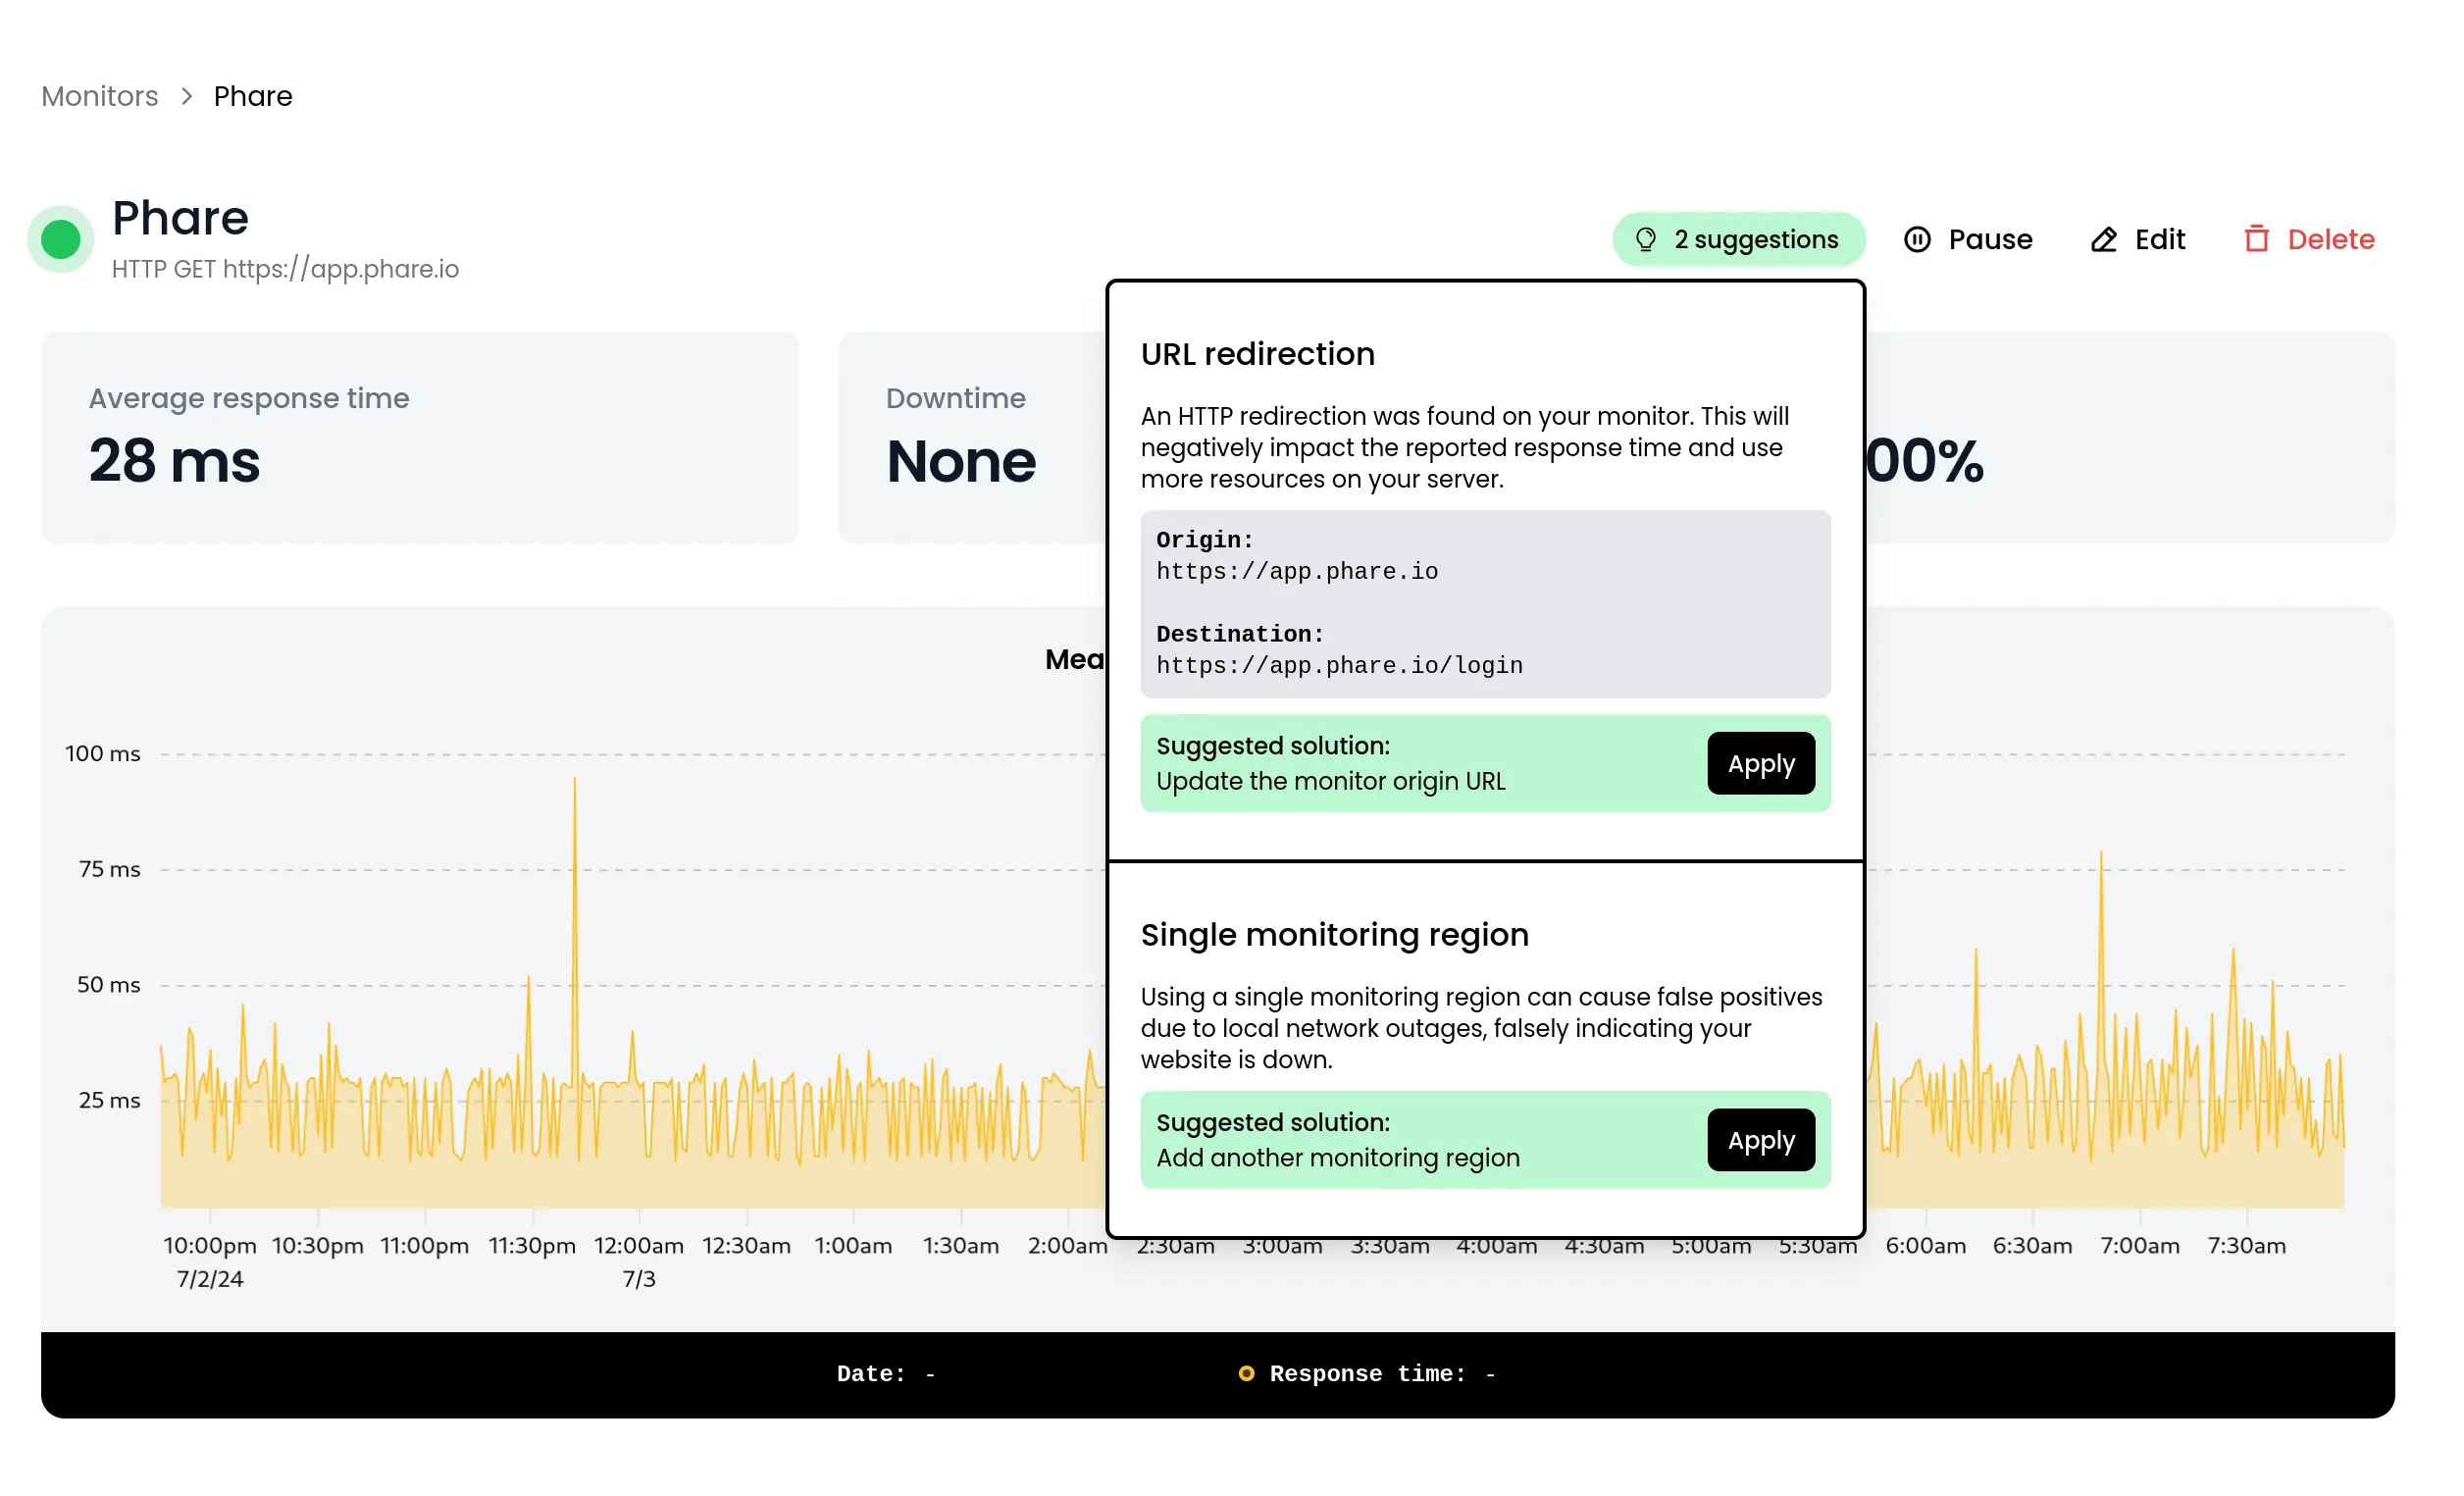
*July 3rd, 2024*
We are introducing smart monitoring suggestions, designed to help you effortlessly optimize your monitors. This new feature provides tailored recommendations to enhance the accuracy and reliability of your monitoring.
Smart Suggestions will alert you of unnecessary redirects, which can slow down your site's reported performance, and recommend using multiple regions for monitoring if you currently use only a single region. By following these suggestions, you can ensure more comprehensive coverage and faster detection of potential issues.
***
## Smart monitoring suggestion
*July 3rd, 2024*
We are introducing smart monitoring suggestions, designed to help you effortlessly optimize your monitors. This new feature provides tailored recommendations to enhance the accuracy and reliability of your monitoring.
Smart Suggestions will alert you of unnecessary redirects, which can slow down your site's reported performance, and recommend using multiple regions for monitoring if you currently use only a single region. By following these suggestions, you can ensure more comprehensive coverage and faster detection of potential issues.
 ***
## 30 second monitoring interval
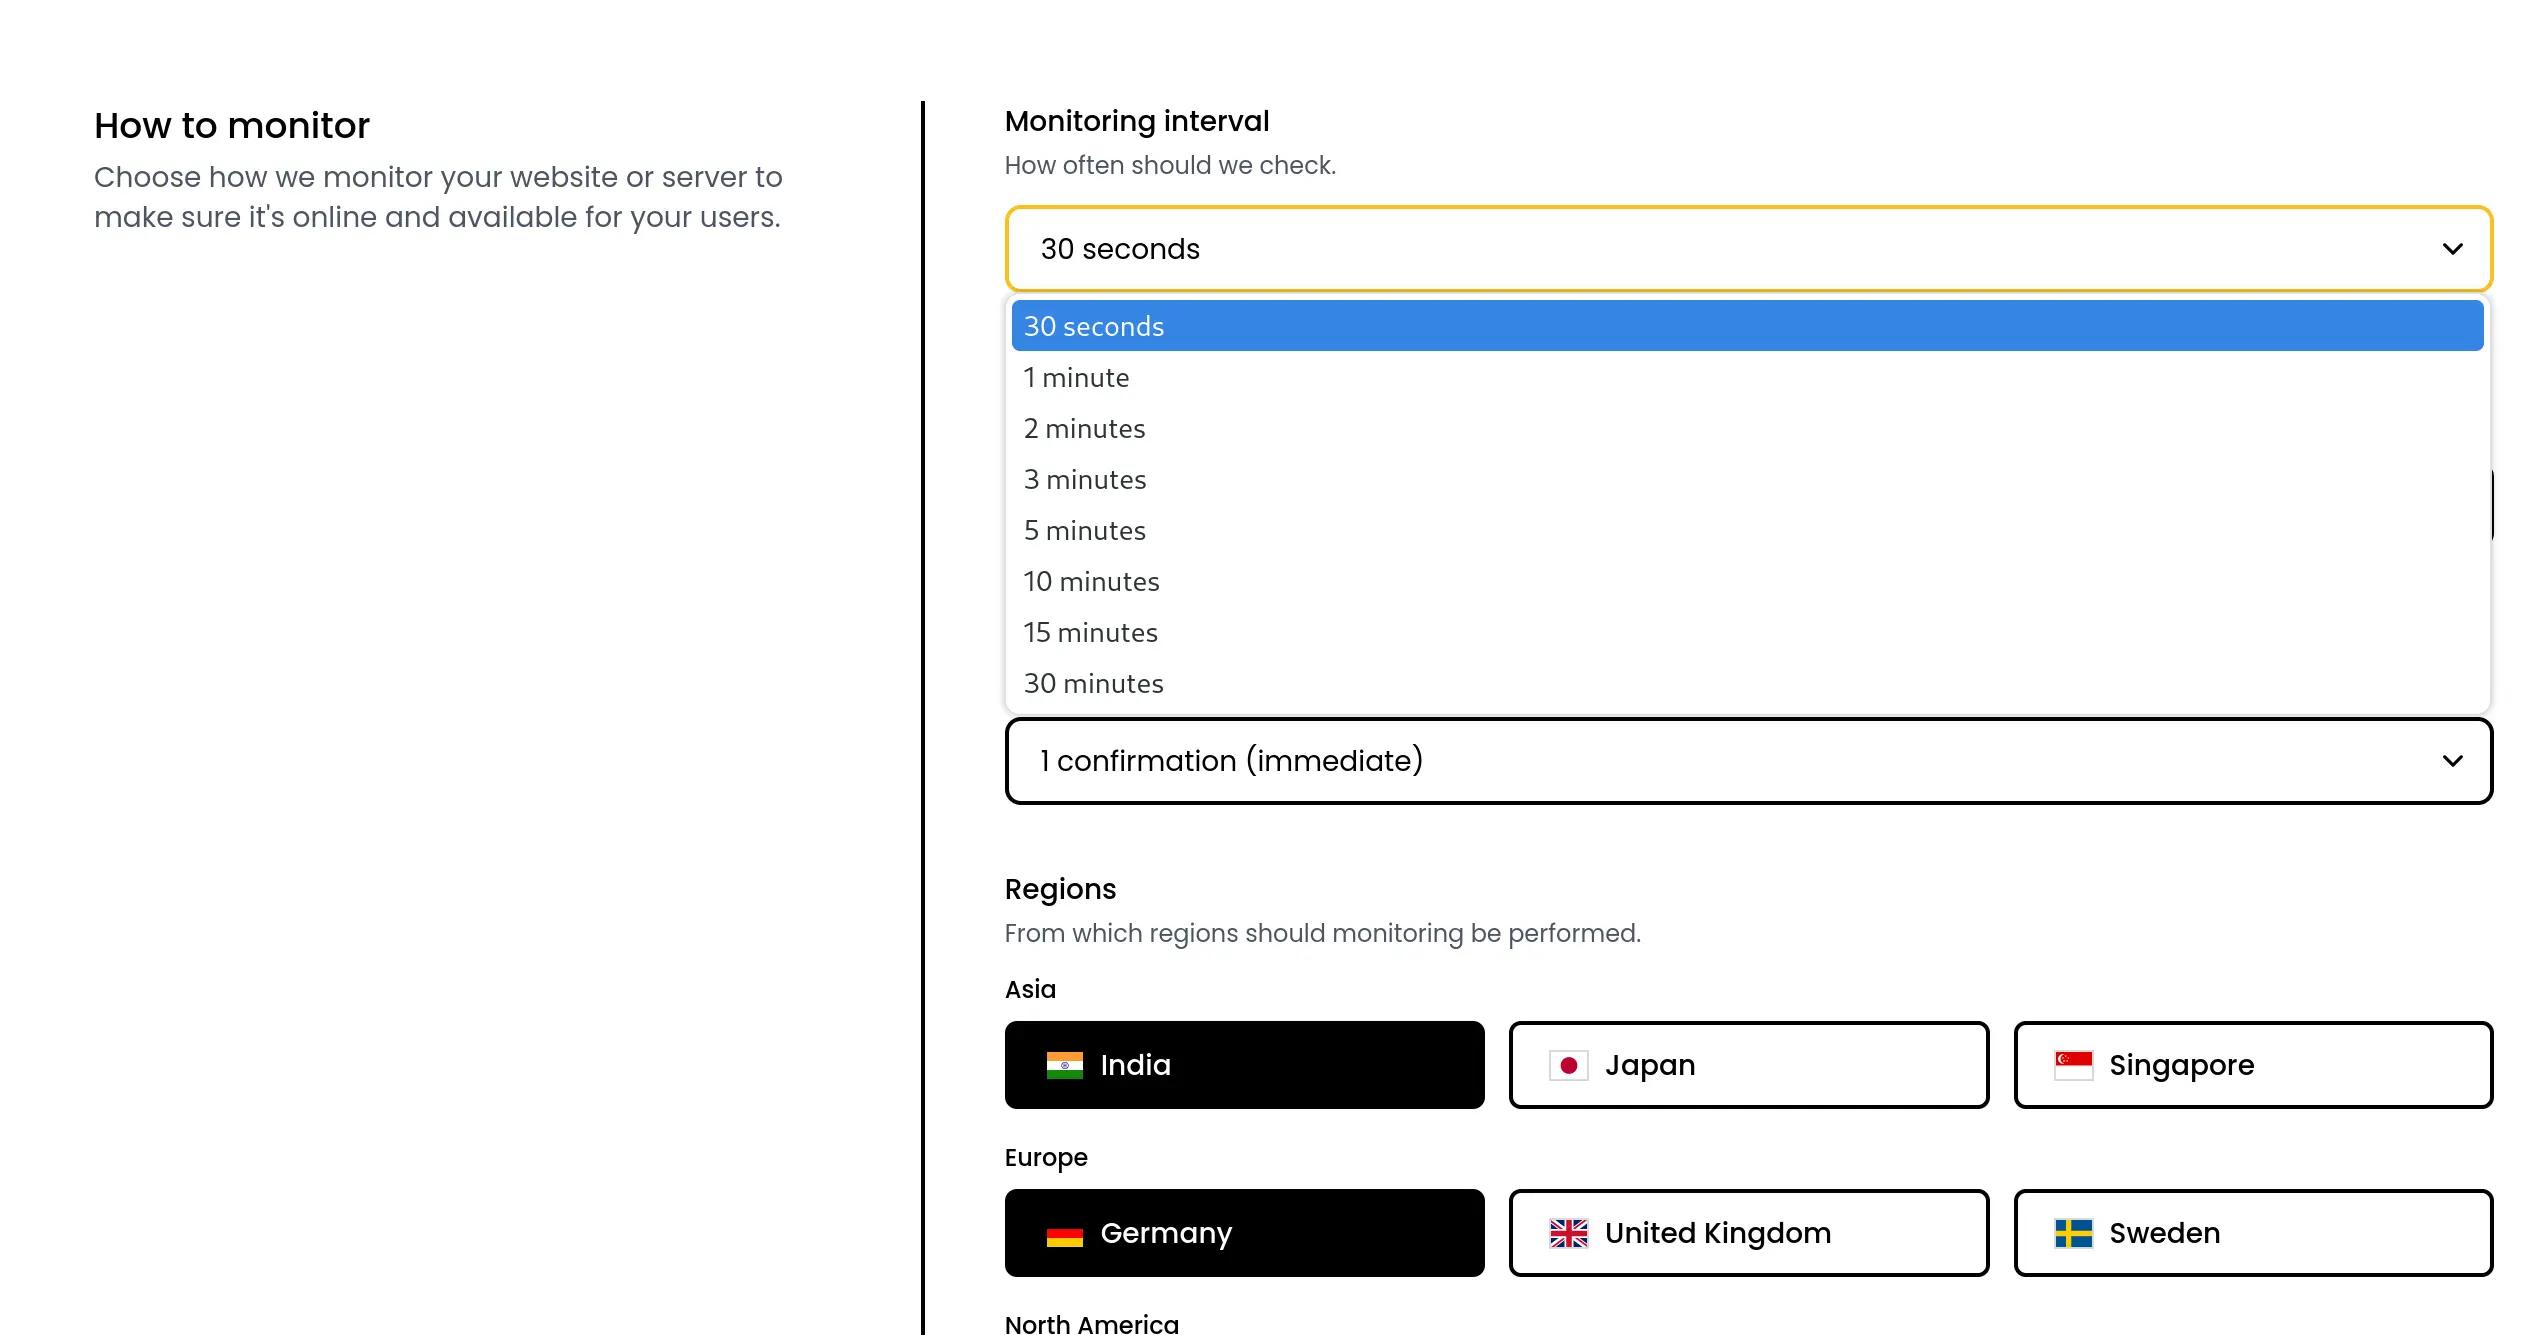
*July 2nd, 2024*
Phare enters the realm of sub-minute monitoring with the introduction of a new 30-second monitoring interval for your monitors.
With this update, you can detect and respond to issues faster than ever, ensuring that your services remain reliable with minimal downtime. The 30-second checks are available to all users, offering a higher level of detail and control over your monitoring strategy.
***
## 30 second monitoring interval
*July 2nd, 2024*
Phare enters the realm of sub-minute monitoring with the introduction of a new 30-second monitoring interval for your monitors.
With this update, you can detect and respond to issues faster than ever, ensuring that your services remain reliable with minimal downtime. The 30-second checks are available to all users, offering a higher level of detail and control over your monitoring strategy.
 ***
## New changelog
*July 1st, 2024*
Phare's changelog has been moved on our documentation site to harmonize the way that we write content on new Phare features. All previous entries where migrated to [this page](/changelog/platform/2024). We hope this new format will allow us to publish new entries faster and with a higher frequency.
***
## New monitoring regions
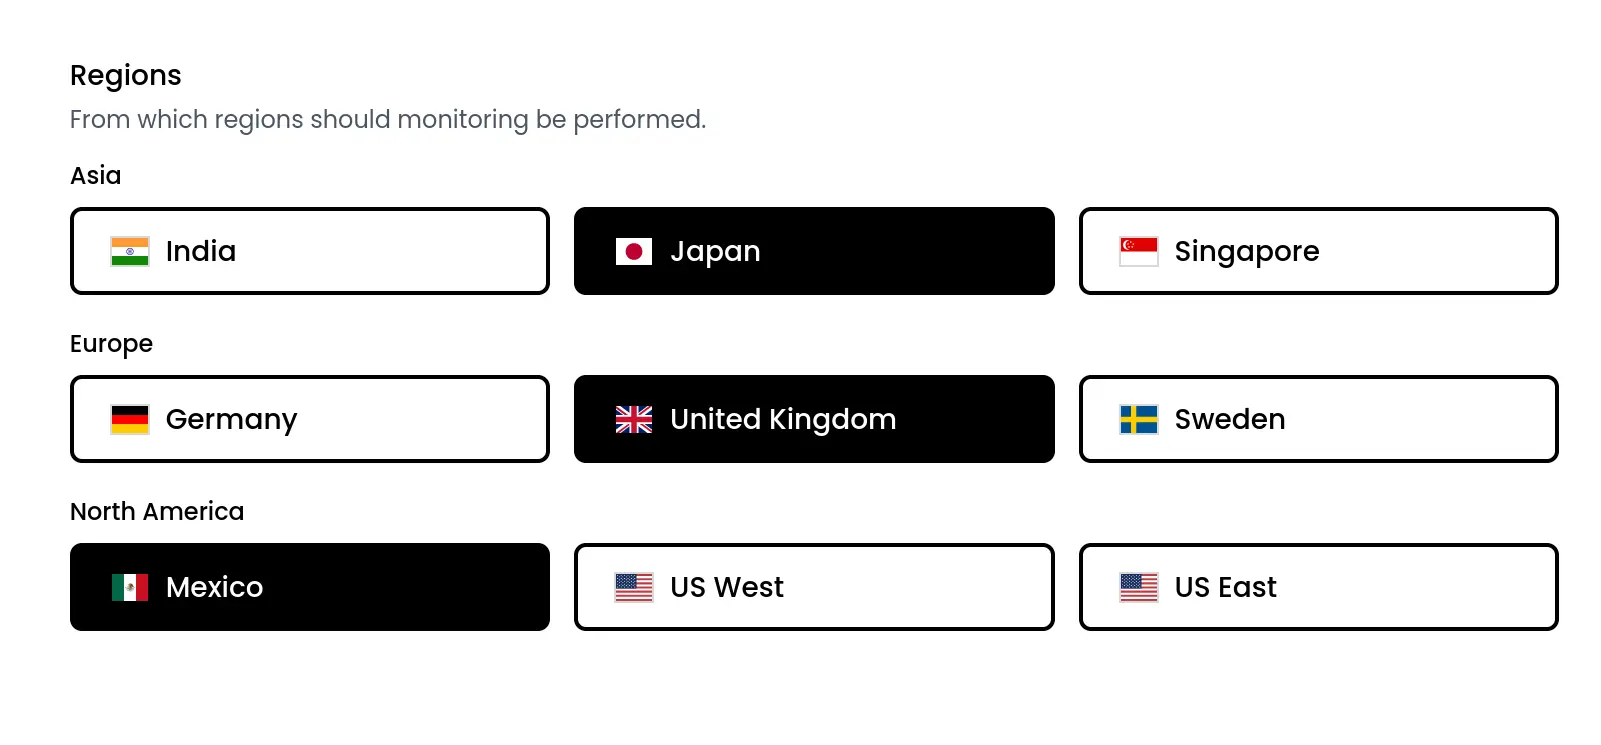
*May 28th, 2024*
Following our recent monitoring infrastructure migration, three new regions are released for uptime monitoring:
Say hello to Japan, the United Kingdom and Mexico.
***
## New changelog
*July 1st, 2024*
Phare's changelog has been moved on our documentation site to harmonize the way that we write content on new Phare features. All previous entries where migrated to [this page](/changelog/platform/2024). We hope this new format will allow us to publish new entries faster and with a higher frequency.
***
## New monitoring regions
*May 28th, 2024*
Following our recent monitoring infrastructure migration, three new regions are released for uptime monitoring:
Say hello to Japan, the United Kingdom and Mexico.
 ***
## New monitoring infrastructure
*May 26th, 2024*
Our monitoring infrastructure is the biggest operating cost and most important piece of the Phare Uptime product. As we perform millions of monitoring checks from many regions around the world, this infrastructure should be scalable, efficient and more importantly reliable. As we grew over the past few months, our previous solution based on [AWS Lambda](https://aws.amazon.com/lambda/) started to show its limit in terms of performance and cost, forcing us to look for an alternative solution.
Today we migrated all monitoring checks to a newly written infrastructure based on [Cloudflare workers](https://workers.cloudflare.com/). This solution allows us to maintain our generous free plan and a competitive price for our paid customers.
***
## Alert policies API
*May 24th, 2024*
API endpoints to [manage alert policies](/api-reference/alert-policies/list-alert-policies) have been released and documented.
***
## New monitoring infrastructure
*May 26th, 2024*
Our monitoring infrastructure is the biggest operating cost and most important piece of the Phare Uptime product. As we perform millions of monitoring checks from many regions around the world, this infrastructure should be scalable, efficient and more importantly reliable. As we grew over the past few months, our previous solution based on [AWS Lambda](https://aws.amazon.com/lambda/) started to show its limit in terms of performance and cost, forcing us to look for an alternative solution.
Today we migrated all monitoring checks to a newly written infrastructure based on [Cloudflare workers](https://workers.cloudflare.com/). This solution allows us to maintain our generous free plan and a competitive price for our paid customers.
***
## Alert policies API
*May 24th, 2024*
API endpoints to [manage alert policies](/api-reference/alert-policies/list-alert-policies) have been released and documented.
 ***
## REST API
*May 20th, 2024*
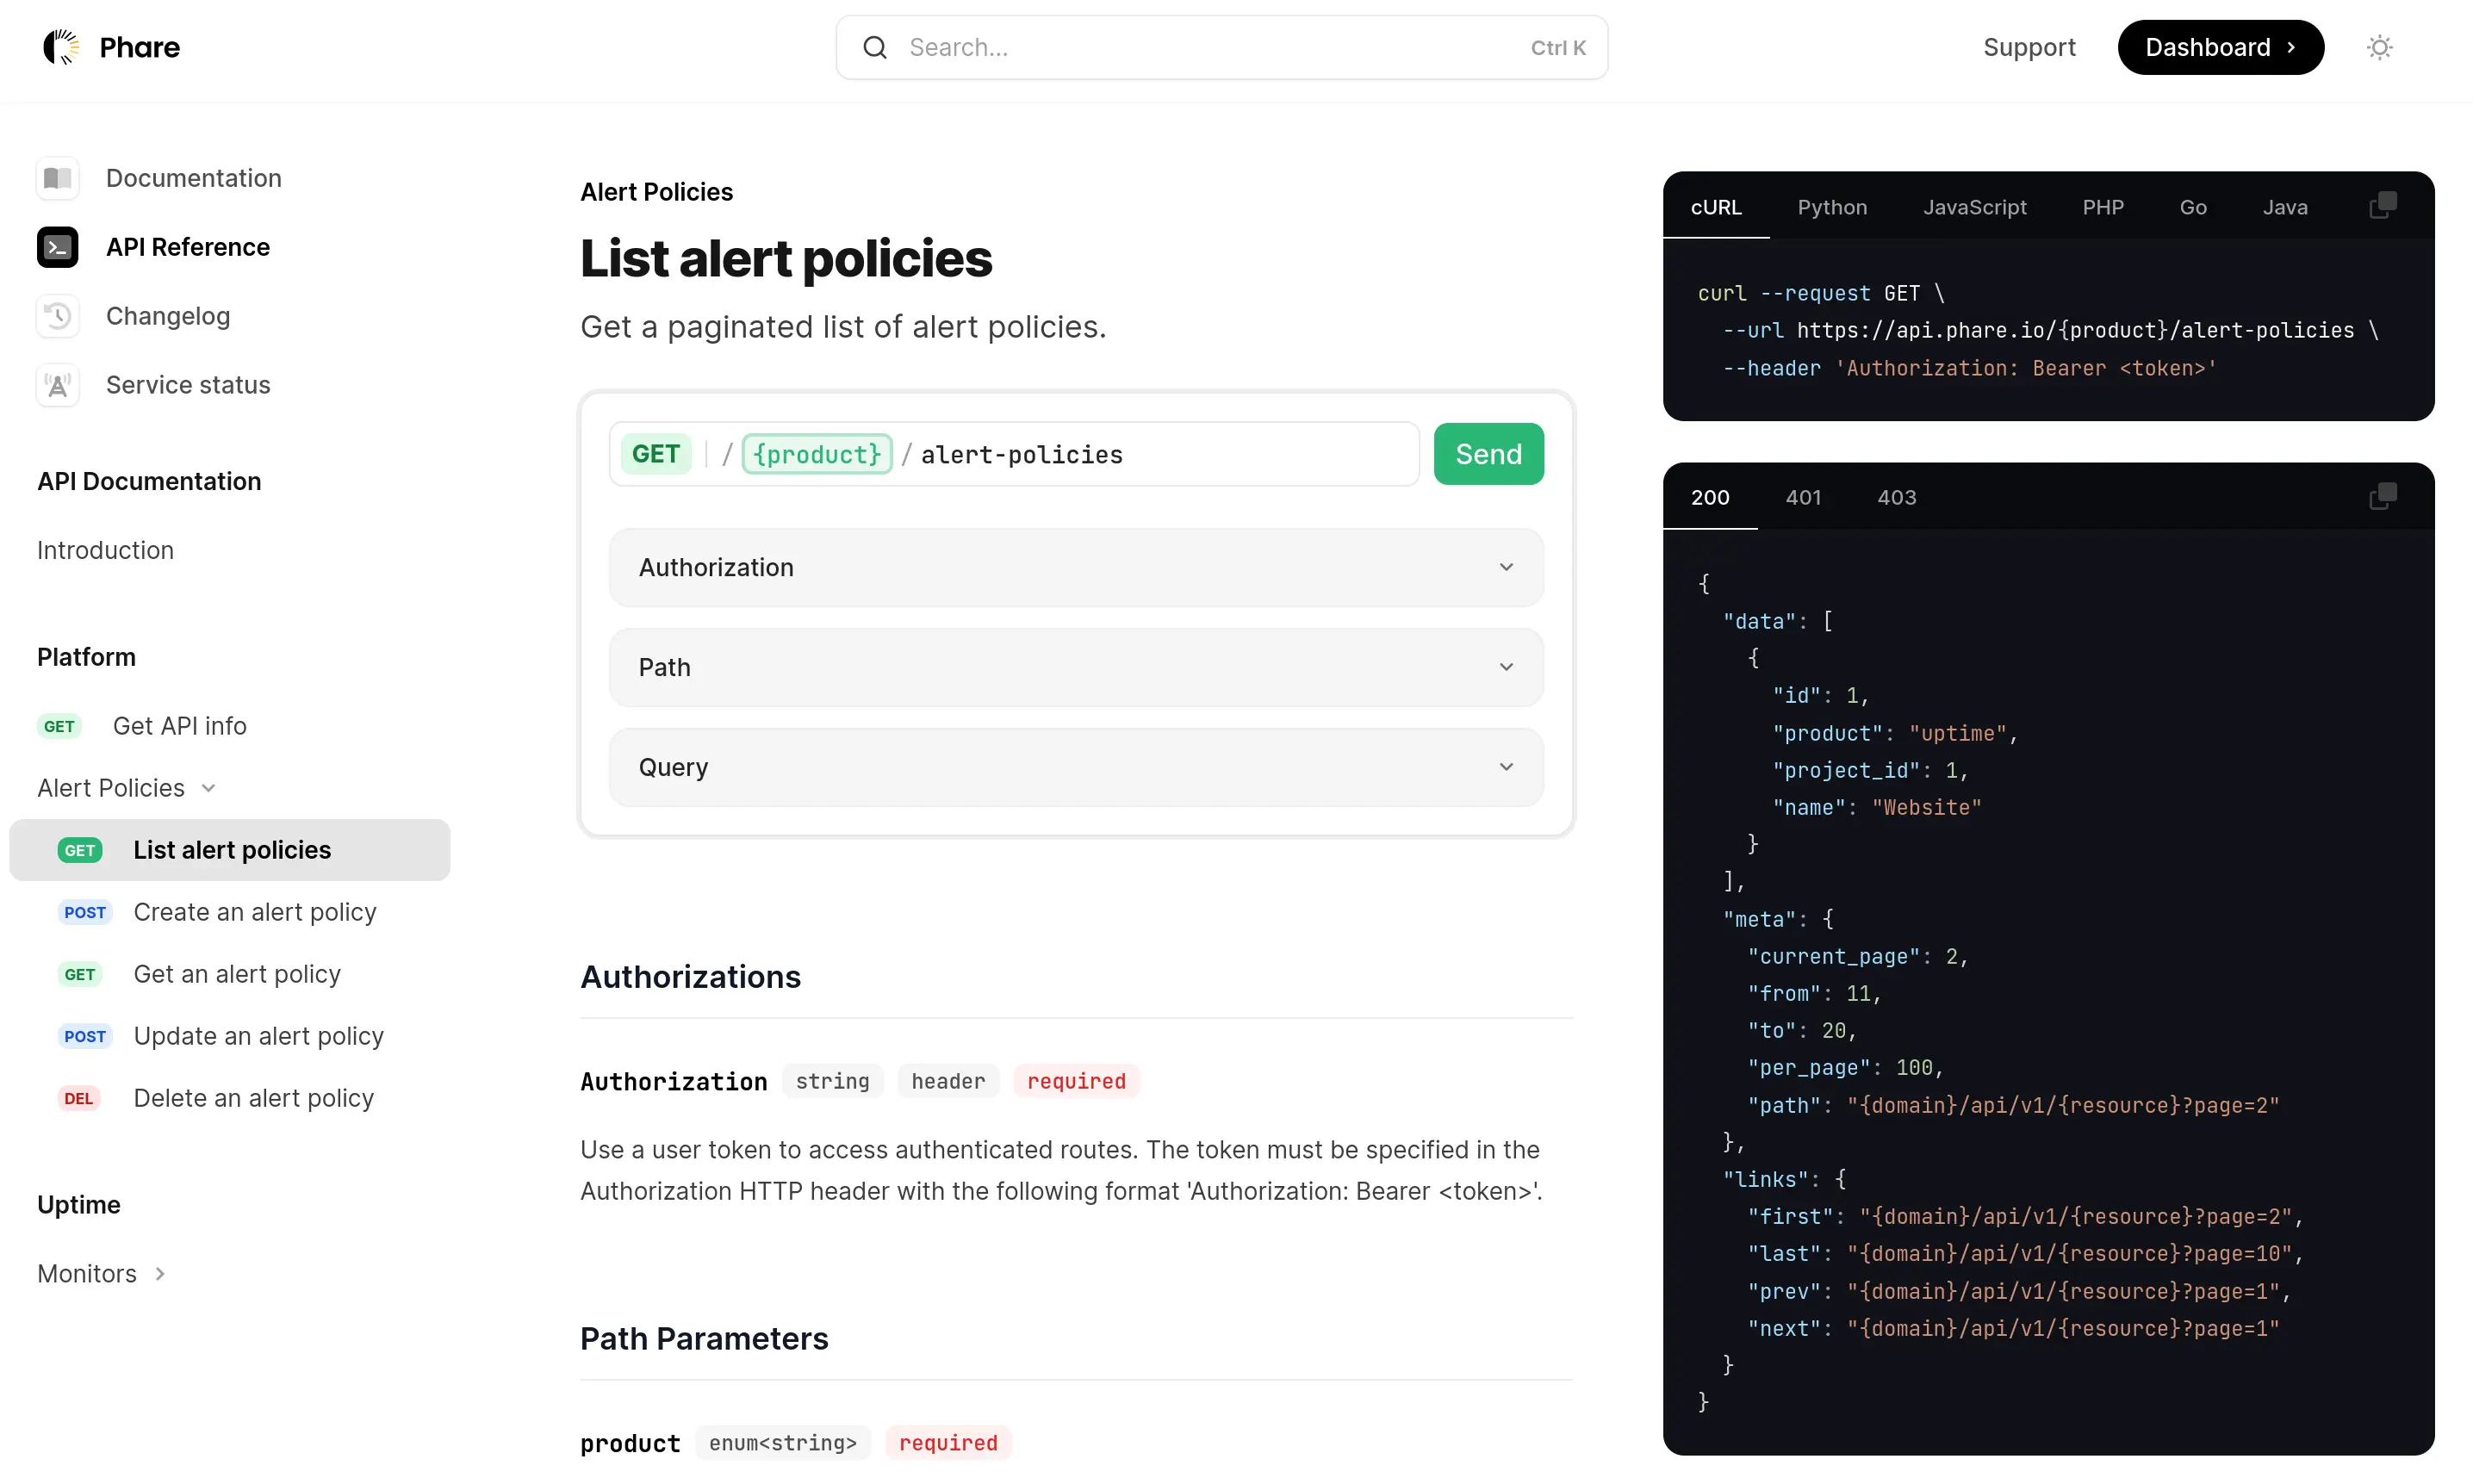
The Phare REST API has been released with associated [documentation](/api-reference/introduction). All endpoints required to manage monitors are already available, other endpoints will be added in the next few weeks until all the action you can perform in your dashboard can also be done programmatically.
You will need to generate an API key to authenticate your organization, you are able to choose an access scope (Read / Write) for each Phare product as well as access to the resources of the Phare platform.
More informations are available on the [API documentation](/api-reference/introduction) page.
***
## REST API
*May 20th, 2024*
The Phare REST API has been released with associated [documentation](/api-reference/introduction). All endpoints required to manage monitors are already available, other endpoints will be added in the next few weeks until all the action you can perform in your dashboard can also be done programmatically.
You will need to generate an API key to authenticate your organization, you are able to choose an access scope (Read / Write) for each Phare product as well as access to the resources of the Phare platform.
More informations are available on the [API documentation](/api-reference/introduction) page.
***
## New Documentation
*May 15th, 2024*
Documentation has been moved to [docs.phare.io](/introduction) and offers an improved user experience. The documentation source code has also been published to [GitHub](https://github.com/phare/docs), allowing anyone to contribute.
 ***
## Incident comment and update alert
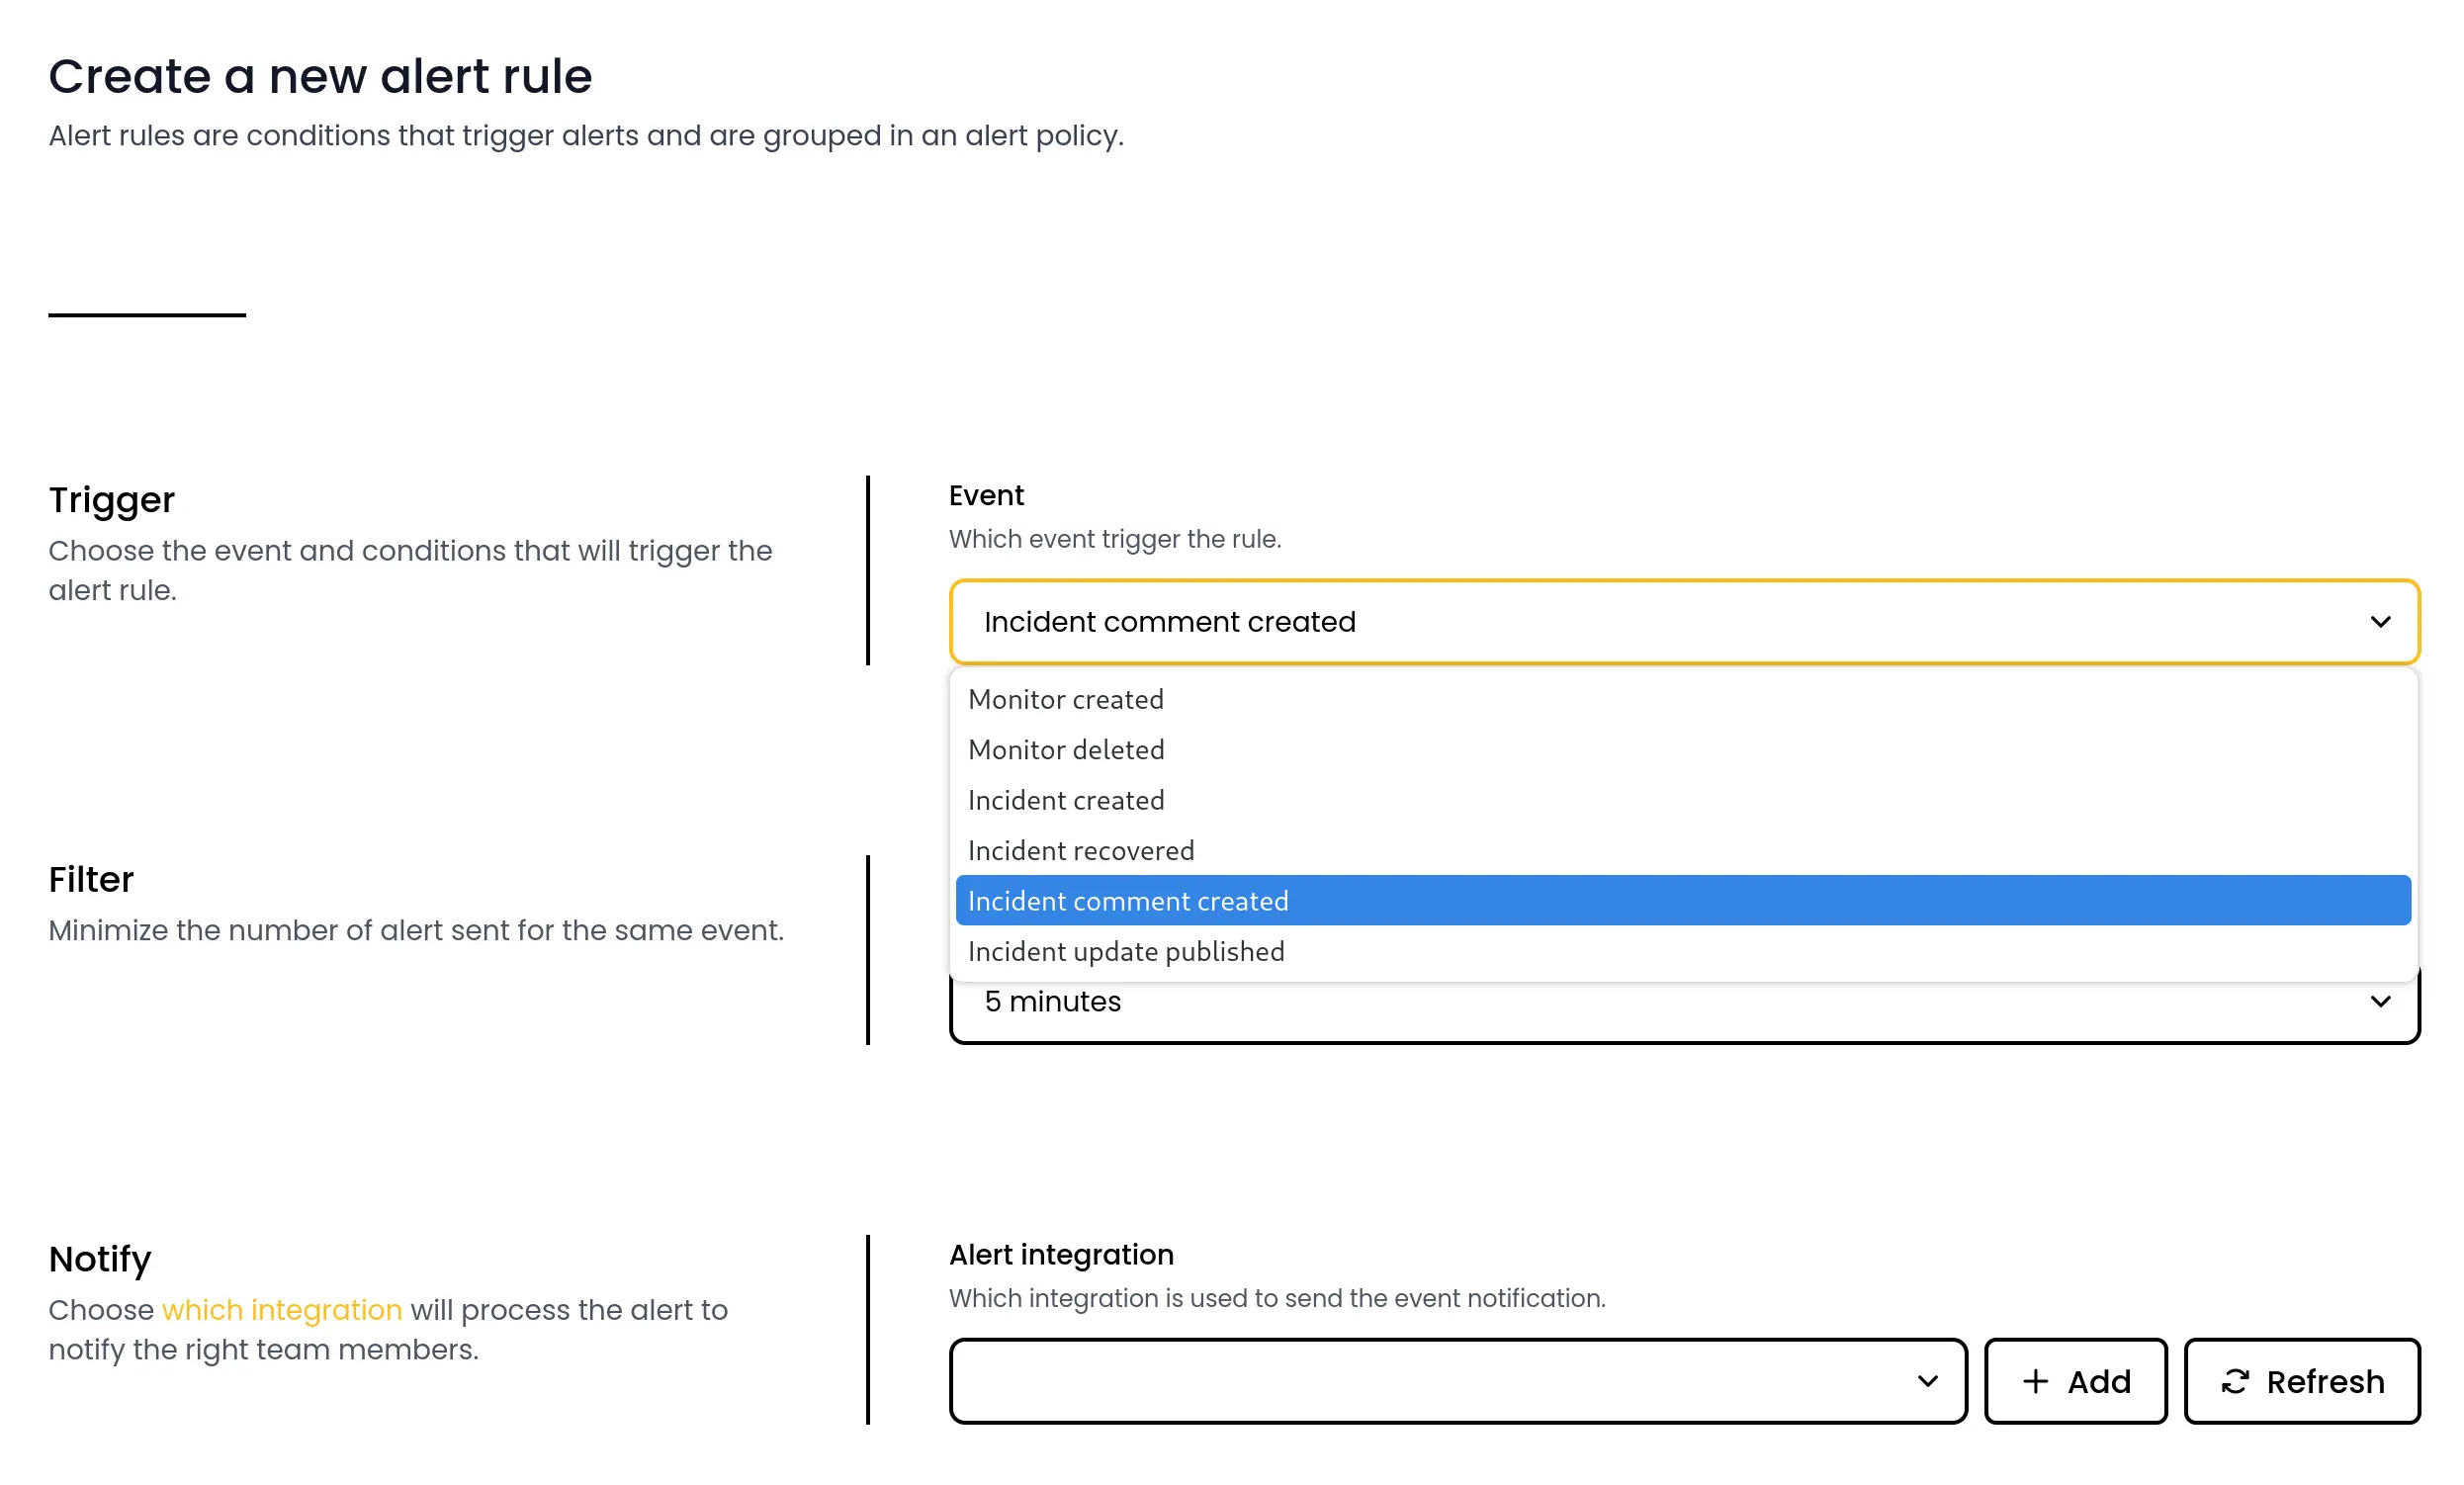
*May 7th, 2024*
Two new alert rules have been created to let you know when your team is working on resolving an incident. The first one will alert you everytime a new comment is published on an incident timeline, and the second when a team member publishes a status update for the incident.
***
## Incident comment and update alert
*May 7th, 2024*
Two new alert rules have been created to let you know when your team is working on resolving an incident. The first one will alert you everytime a new comment is published on an incident timeline, and the second when a team member publishes a status update for the incident.
 ***
## Hosting provider migration
*May 2nd, 2024*
Phare migrated to a new datacenter managed by [Hetzner](https://www.hetzner.com/) in Germany. The switch was made on May 2nd and resulted in \~6 minutes of downtime on uptime monitoring and \~10 minutes of downtime on dashboard access. This infrastructure migration was performed to improve speed and reliability of the service.
A lot of work has also been put into disaster recovery, with four times more backup point every day and multi-region (all in Europe) replication.
This ensures that the service can be put back up with the smallest possible downtime in case our current datacenter has a major outage.
# Changelog
Source: https://docs.phare.io/changelog/platform/2025
Follow the updates and improvements made to the Phare platform in 2025.
## Enhanced incident details
The information available in incident reports has been extended to includes:
* ✅ *Resolved address*: See the final hostname and port.
* 🔢 *Status code*: Quickly verify the HTTP response status.
* 🧪 *Assertion results*: View detailed outcomes for each assertion.
* 📦 *Response size*: View the bytes size of the response body.
* 🧾 *Response headers*: Inspect the HTTP headers returned by the server.
* 🔍 *Request trace*: Follow the full journey of the request through each step.
The additional context should help you identify incident root causes more quickly and accurately.
***
## Hosting provider migration
*May 2nd, 2024*
Phare migrated to a new datacenter managed by [Hetzner](https://www.hetzner.com/) in Germany. The switch was made on May 2nd and resulted in \~6 minutes of downtime on uptime monitoring and \~10 minutes of downtime on dashboard access. This infrastructure migration was performed to improve speed and reliability of the service.
A lot of work has also been put into disaster recovery, with four times more backup point every day and multi-region (all in Europe) replication.
This ensures that the service can be put back up with the smallest possible downtime in case our current datacenter has a major outage.
# Changelog
Source: https://docs.phare.io/changelog/platform/2025
Follow the updates and improvements made to the Phare platform in 2025.
## Enhanced incident details
The information available in incident reports has been extended to includes:
* ✅ *Resolved address*: See the final hostname and port.
* 🔢 *Status code*: Quickly verify the HTTP response status.
* 🧪 *Assertion results*: View detailed outcomes for each assertion.
* 📦 *Response size*: View the bytes size of the response body.
* 🧾 *Response headers*: Inspect the HTTP headers returned by the server.
* 🔍 *Request trace*: Follow the full journey of the request through each step.
The additional context should help you identify incident root causes more quickly and accurately.

## Updated inactivity restriction for Hobby plan
Organizations on the **Hobby** plan are now automatically deactivated after 4 months of inactivity, instead of 6 months. This means that if your organization has no active members for 4 months, it will be deactivated and all data will be deleted after receiving two reminder emails.
This change is necessary to keep the platform sustainable, and requesting 3 sign ins per year seems reasonable to ask for a free plan.
 ## Success assertions
You can now define success assertions for your monitors, allowing you to specify custom checks for:
* Status codes (with support for wildcards and multiple codes)
* Response headers
* Response body content
## Success assertions
You can now define success assertions for your monitors, allowing you to specify custom checks for:
* Status codes (with support for wildcards and multiple codes)
* Response headers
* Response body content
 ## TLS over TCP, and new monitoring options
Monitoring secure TCP services with a TLS connection is now possible, allowing you to monitor a wider range of services. Certificates discovered during TCP monitoring are now tracked, and you can set up alert rules to be notified when they are about to expire.
All types of monitors can now skip SSL/TLS certificate validation, which is useful for testing services with self-signed certificates.
HTTP(S) monitors can now be configured to fail when facing a 3xx redirect response.
## TLS over TCP, and new monitoring options
Monitoring secure TCP services with a TLS connection is now possible, allowing you to monitor a wider range of services. Certificates discovered during TCP monitoring are now tracked, and you can set up alert rules to be notified when they are about to expire.
All types of monitors can now skip SSL/TLS certificate validation, which is useful for testing services with self-signed certificates.
HTTP(S) monitors can now be configured to fail when facing a 3xx redirect response.
 ## Refreshed design
Phare has a fresh new look! The design has been refreshed to be more modern and user-friendly, navigation should be more intuitive.
## Refreshed design
Phare has a fresh new look! The design has been refreshed to be more modern and user-friendly, navigation should be more intuitive.
 ## Integration project scope removed
It was possible to scope integrations to a specific project, which was useful for advanced use cases of large organizations. However, this feature was not widely used and made integrations needlessly complex for most users, and Phare is all about the fine line between simplicity and sophistication, so bye-bye scoped integrations.
## Integration project scope removed
It was possible to scope integrations to a specific project, which was useful for advanced use cases of large organizations. However, this feature was not widely used and made integrations needlessly complex for most users, and Phare is all about the fine line between simplicity and sophistication, so bye-bye scoped integrations.
 ## Custom HTTP headers
You can now add custom HTTP headers to your monitors. This is useful for passing authentication tokens, or any other headers required by your application.
## Custom HTTP headers
You can now add custom HTTP headers to your monitors. This is useful for passing authentication tokens, or any other headers required by your application.
 ## User agent secret key
It is now possible to set a secret key of your choice to the user agent used for monitoring. This allows you to easily identify the requests made by Phare in your application logs, or filter them accurately in your firewall rules.
The chosen secret key is passed as a user agent parameter with the following format:
```text
Mozilla/5.0 (compatible; Phare/1.0; +https://phare.io/products/uptime; Secret=your-secret-key)
```
The user agent is left unchanged if no secret key is set:
```text
Mozilla/5.0 (compatible; Phare/1.0; +https://phare.io/products/uptime)
```
## User agent secret key
It is now possible to set a secret key of your choice to the user agent used for monitoring. This allows you to easily identify the requests made by Phare in your application logs, or filter them accurately in your firewall rules.
The chosen secret key is passed as a user agent parameter with the following format:
```text
Mozilla/5.0 (compatible; Phare/1.0; +https://phare.io/products/uptime; Secret=your-secret-key)
```
The user agent is left unchanged if no secret key is set:
```text
Mozilla/5.0 (compatible; Phare/1.0; +https://phare.io/products/uptime)
```
 ## New alert event: Monitor certificate expiring
You can now create alert rules to be notified when your monitor certificates are about to expire. This new feature complements the SSL certificate tracking system introduced earlier this week, giving you proactive control over your certificate renewals.
How it works:
* Create a **Monitor Certificate Expiring** alert rule
* Select how many days in advance you want to be notified (from 1 to 60 days)
* Choose which integration to use for notifications (Email, SMS, Webhook, etc.)
* Get timely notifications so you never miss a certificate renewal again
Like other alert rules, you can scope it to a specific project or to the entire organization, and it works with all existing integrations.
## New alert event: Monitor certificate expiring
You can now create alert rules to be notified when your monitor certificates are about to expire. This new feature complements the SSL certificate tracking system introduced earlier this week, giving you proactive control over your certificate renewals.
How it works:
* Create a **Monitor Certificate Expiring** alert rule
* Select how many days in advance you want to be notified (from 1 to 60 days)
* Choose which integration to use for notifications (Email, SMS, Webhook, etc.)
* Get timely notifications so you never miss a certificate renewal again
Like other alert rules, you can scope it to a specific project or to the entire organization, and it works with all existing integrations.
 ## New alert event: Monitor certificate discovered
You can now create alert rules to be notified when a new certificate is discovered on any monitor. It's a great way to make sure they're getting renewed on time, or to get alerted of any unexpected changes to your monitors' SSL certificates.
## New alert event: Monitor certificate discovered
You can now create alert rules to be notified when a new certificate is discovered on any monitor. It's a great way to make sure they're getting renewed on time, or to get alerted of any unexpected changes to your monitors' SSL certificates.
 ## SSL certificate tracking
Phare now tracks SSL certificates as first-class objects, giving you visibility on all the certificates used in your projects.
How it works:
* Certificates are discovered and stored automatically when performing monitor checks
* Support for multiple certificates per domain and shared certificates across monitors
This allows you to quickly view all certificates used by a monitor, and all monitors using a certificate.
## SSL certificate tracking
Phare now tracks SSL certificates as first-class objects, giving you visibility on all the certificates used in your projects.
How it works:
* Certificates are discovered and stored automatically when performing monitor checks
* Support for multiple certificates per domain and shared certificates across monitors
This allows you to quickly view all certificates used by a monitor, and all monitors using a certificate.
 ## New scoped alert rules system
Alert policies have been replaced with a more intuitive scoped alert rules system. You can now define alert rules that apply at the organization or project level, making alerting easier to manage and more transparent.
How it works:
* Alert policies do not exist anymore
* Alert rules can be directly created
* Choose a scope for each rule: project-specific or organization-wide.
This greatly simplifies the alerting system, while keeping a good level of flexibility.
The [API endpoints for managing alert rules](/api-reference/platform/alert-rules/list-alert-rules) have also been updated to reflect this change, which should make it easier to manage your alert rules programmatically.
## New scoped alert rules system
Alert policies have been replaced with a more intuitive scoped alert rules system. You can now define alert rules that apply at the organization or project level, making alerting easier to manage and more transparent.
How it works:
* Alert policies do not exist anymore
* Alert rules can be directly created
* Choose a scope for each rule: project-specific or organization-wide.
This greatly simplifies the alerting system, while keeping a good level of flexibility.
The [API endpoints for managing alert rules](/api-reference/platform/alert-rules/list-alert-rules) have also been updated to reflect this change, which should make it easier to manage your alert rules programmatically.
 ## Enhanced messaging reliability and logging
To improve the resilience of the email notifications, a failover SMTP (Brevo) has been introduced to ensure uninterrupted delivery in case the primary SMTP (Scaleway) fails.
Real-time tracking of email delivery statuses has been implemented to allow for immediate detection of undelivered emails.
The Email, Telegram, and SMS integration have also been updated to provide per-recipient logs, giving you more details in case of delivery issues.
## Enhanced messaging reliability and logging
To improve the resilience of the email notifications, a failover SMTP (Brevo) has been introduced to ensure uninterrupted delivery in case the primary SMTP (Scaleway) fails.
Real-time tracking of email delivery statuses has been implemented to allow for immediate detection of undelivered emails.
The Email, Telegram, and SMS integration have also been updated to provide per-recipient logs, giving you more details in case of delivery issues.
 ## New monitoring regions and infrastructure overhaul
After two months of rollout and testing, Phare’s newest regions, Australia, Thailand, and Brazil, are now generally available. These regions bring faster, closer monitoring to key areas across APAC and South America.
All regions, new and existing, now run on an upgraded infrastructure. Expect lower latency, improved efficiency, and even more reliable insights, no changes needed.
A major step forward in global monitoring, now fully live!
## New monitoring regions and infrastructure overhaul
After two months of rollout and testing, Phare’s newest regions, Australia, Thailand, and Brazil, are now generally available. These regions bring faster, closer monitoring to key areas across APAC and South America.
All regions, new and existing, now run on an upgraded infrastructure. Expect lower latency, improved efficiency, and even more reliable insights, no changes needed.
A major step forward in global monitoring, now fully live!
## New Scale plan price
After nearly a year of intense optimization and some seriously messy spreadsheet formulas, it's finally done, Phare Scale plan is now just 5€, down from 49€!
That’s 90% off! And it’s not just about slashing prices, it’s about making powerful, high-quality tools accessible to everyone, without locking features behind expensive enterprise plans.
The pricing page has been [updated to reflect this change and clarify things](https://phare.io/pricing).
Now’s the perfect time to hop on board. Don’t miss out, let’s scale together.
 ## Discord community
Phare now has a Discord community, because sometimes you just want to drop a quick message, rant about a bug, or throw out a wild feature idea explained in a meme.
Join to chat about Phare, share feedback, report issues, or just see what’s brewing. It's also the best place to talk to the guy that write the code, and bully him into adding a dark mode (please don’t).
Jump in, say hi, and let’s have fun: [https://phare.io/discord](https://phare.io/discord)
## Discord community
Phare now has a Discord community, because sometimes you just want to drop a quick message, rant about a bug, or throw out a wild feature idea explained in a meme.
Join to chat about Phare, share feedback, report issues, or just see what’s brewing. It's also the best place to talk to the guy that write the code, and bully him into adding a dark mode (please don’t).
Jump in, say hi, and let’s have fun: [https://phare.io/discord](https://phare.io/discord)
 ## Preview regions
Six new regions are available in preview to test Phare's brand-new monitoring infrastructure. They’re free to use for the next two months but come with no guarantees yet.
Choose from US West / East 🇺🇸, Japan 🇯🇵, Germany 🇩🇪, or one of the new regions, Australia 🇦🇺 and Brazil 🇧🇷. Or why not all of them to help us test the new infrastructure at scale?
## Preview regions
Six new regions are available in preview to test Phare's brand-new monitoring infrastructure. They’re free to use for the next two months but come with no guarantees yet.
Choose from US West / East 🇺🇸, Japan 🇯🇵, Germany 🇩🇪, or one of the new regions, Australia 🇦🇺 and Brazil 🇧🇷. Or why not all of them to help us test the new infrastructure at scale?
 ## Telegram integration
A new integration with Telegram is now available to send notifications to your Telegram application. The integration supports sending messages to a group or a private chat, and can be used with all existing alert events.
Read the [Telegram integration documentation](/integrations/telegram) to get started.
## Telegram integration
A new integration with Telegram is now available to send notifications to your Telegram application. The integration supports sending messages to a group or a private chat, and can be used with all existing alert events.
Read the [Telegram integration documentation](/integrations/telegram) to get started.
 ## Improved integration reliability
A lot of work has been done to improve the reliability of all integrations with third-party services. Including a new delivery and error logs page, failure notifications, and automatic pause for failing integrations.
### Delivery and error logs
All integrations now provide a detailed logs page to help you diagnose and fix issues.
### Failure notifications
All integrations now notify the organization owner when an issue occurs. For the SMS, Email and Webhook integrations, a detailed list of failed number, address or requests is provided to help you identify the issue.
The failure notification for the Outgoing Webhook integration is only sent if all delivery attempts have failed, which means organization owner will be notified [1 hour and 18 minutes](https://docs.phare.io/integrations/outgoing-webhook#retry-policy) after the event creation.
## Improved integration reliability
A lot of work has been done to improve the reliability of all integrations with third-party services. Including a new delivery and error logs page, failure notifications, and automatic pause for failing integrations.
### Delivery and error logs
All integrations now provide a detailed logs page to help you diagnose and fix issues.
### Failure notifications
All integrations now notify the organization owner when an issue occurs. For the SMS, Email and Webhook integrations, a detailed list of failed number, address or requests is provided to help you identify the issue.
The failure notification for the Outgoing Webhook integration is only sent if all delivery attempts have failed, which means organization owner will be notified [1 hour and 18 minutes](https://docs.phare.io/integrations/outgoing-webhook#retry-policy) after the event creation.
 ### Automatic pause
Integrations that have been failing more than 3 consecutive times in a 7 days rolling window will be automatically paused. A notification will be sent to the organization owner when this happens.
### Automatic pause
Integrations that have been failing more than 3 consecutive times in a 7 days rolling window will be automatically paused. A notification will be sent to the organization owner when this happens.
## Data retention change
To improve the performance of the platform and reduce unnecessary data retention, a few rules are now enforced for organizations on the **Hobby** plan:
Organizations must have at least one active member in the past 6 months to keep their account active. Two reminder email will be sent to the organization owner before the account is deactivated. The first reminder is sent 14 days before the account deactivation, and the second reminder is sent 3 days before the account deactivation.
Monitor that have been failing uninterrupted for more than 48h will be automatically paused. A notification will be sent to the organization owner when a monitor is paused.
These rules are only enforced for organizations on the **Hobby** plan, and are necessary to keep this plan free and sustainable for everyone.
 ## Custom error pages for status pages
When visiting a status page with an error (404, 500, etc.), a custom error page is now displayed to provide a better user experience, instead of redirecting users to a phare.io error page.
## Custom error pages for status pages
When visiting a status page with an error (404, 500, etc.), a custom error page is now displayed to provide a better user experience, instead of redirecting users to a phare.io error page.
 ## Account security improvements
The security of your user account has been improved with the addition of a password confirmation step when updating your email address or deactivating two-factor authentication. This step ensures that you are the owner of the account and that no one else can make changes without your consent. The two-factor authentication activation flow has also been improved with the possibility to manually set up your authenticator app without having to scan a QR code.
## Account security improvements
The security of your user account has been improved with the addition of a password confirmation step when updating your email address or deactivating two-factor authentication. This step ensures that you are the owner of the account and that no one else can make changes without your consent. The two-factor authentication activation flow has also been improved with the possibility to manually set up your authenticator app without having to scan a QR code.
 ## Embed status badge customization
Embed status badges can now be customized with a custom background color to match your website's design. A theme selector is available to choose between light and dark mode, and a color picker to select the background color for each theme.
## Embed status badge customization
Embed status badges can now be customized with a custom background color to match your website's design. A theme selector is available to choose between light and dark mode, and a color picker to select the background color for each theme.
## Embed status badges
Three embeddable status badges are now available to display your status page's current status on your website. The badges do not load any third party scripts, are free from cookies, and adapt to your website dark and light mode.
#### Pulse badge
The pulse badge only display the current status of your status page without any additional information, making it perfect to build your own components around it.
 #### Static badge
The static badge displays the current status of your status page with a pulse and a static label.
#### Static badge
The static badge displays the current status of your status page with a pulse and a static label.
 #### Live badge
The live badge displays the current status of your status page with a pulse and a live label.
#### Live badge
The live badge displays the current status of your status page with a pulse and a live label.
 # Getting started with Phare
Source: https://docs.phare.io/getting-started
Get up and running with the Phare platform, learn how to create your account, select a plan, and set up your first project.
Ready to level up your monitoring game? This guide will walk you through the quick onboarding process to get started with Phare. By the end, you'll have your own organization account and know how to start using Phare products to run successful websites and APIs.
## Account Creation
First things first—you need a Phare account. Head over to the [registration page](https://app.phare.io/register) and sign up in just a few clicks.
Once you've created your account, watch for a confirmation email in your inbox. Click the confirmation link to verify your account and log in to Phare. Easy!
# Getting started with Phare
Source: https://docs.phare.io/getting-started
Get up and running with the Phare platform, learn how to create your account, select a plan, and set up your first project.
Ready to level up your monitoring game? This guide will walk you through the quick onboarding process to get started with Phare. By the end, you'll have your own organization account and know how to start using Phare products to run successful websites and APIs.
## Account Creation
First things first—you need a Phare account. Head over to the [registration page](https://app.phare.io/register) and sign up in just a few clicks.
Once you've created your account, watch for a confirmation email in your inbox. Click the confirmation link to verify your account and log in to Phare. Easy!
 ## Plan Selection
Now it's time to [choose your plan](https://phare.io/pricing). There's only two options: Hobby (free) and Scale (paid). Both plans pack the same powerful features, but the Hobby plan comes with more restricted usage limits. Don't worry about commitment, you can change or upgrade your plan whenever you need to.
## Plan Selection
Now it's time to [choose your plan](https://phare.io/pricing). There's only two options: Hobby (free) and Scale (paid). Both plans pack the same powerful features, but the Hobby plan comes with more restricted usage limits. Don't worry about commitment, you can change or upgrade your plan whenever you need to.
 If you go with the Scale plan, you'll be redirected over Phare's payment processor, Stripe, to fill in your billing details. They will take good care of your payment information, and Phare will never see your credit card details.
Stripe is a trusted payment processor used by some of the biggest companies in the world. They are [PCI compliant](https://docs.stripe.com/security) and have a strong track record of security.
## Project Creation
With your plan sorted, it's time to create your first project! Think of projects as containers for organizing your resources. In Phare, everything lives either directly in your organization or within a project inside your organization.
Pro tip: To keep things tidy, try mirroring your organization's actual
structure in how you set up your projects. And remember, projects also
control who can access what. So if something should only be visible to
certain team members, give it its own project.
If you go with the Scale plan, you'll be redirected over Phare's payment processor, Stripe, to fill in your billing details. They will take good care of your payment information, and Phare will never see your credit card details.
Stripe is a trusted payment processor used by some of the biggest companies in the world. They are [PCI compliant](https://docs.stripe.com/security) and have a strong track record of security.
## Project Creation
With your plan sorted, it's time to create your first project! Think of projects as containers for organizing your resources. In Phare, everything lives either directly in your organization or within a project inside your organization.
Pro tip: To keep things tidy, try mirroring your organization's actual
structure in how you set up your projects. And remember, projects also
control who can access what. So if something should only be visible to
certain team members, give it its own project.
 Congratulations!
You've completed the Phare onboarding process. Now the fun part begins, you can start exploring the different products and features Phare has to offer.
Monitor your websites and APIs, handle incidents, manage certificates
and create status pages
# Integrate Discord with Phare
Source: https://docs.phare.io/integrations/discord
Set up the Phare Discord integration to receive messages in your Discord server when your websites or APIs are down.
Bring your monitoring alerts right where your team hangs out! The Discord integration sends alerts directly to your chosen Discord channel, so you won't miss a beat when something needs attention. Set it up in your integrations dashboard.
## Configuration
Need alerts in different Discord channels? No problem! You can create multiple Discord integrations, each pointing to a specific channel. When you set up a Discord integration, you will be redirected to Discord to authorize the Phare app and select the right Discord server and channel for your alerts.
Pro tip: If you're a member of multiple Discord servers, double-check that
you're selecting the right one during the authorization step.
A name will be automatically suggested for your integration, feel free to give it a more descriptive name that helps you identify it when setting up alert rules later, especially if you're connecting to multiple channels or servers.
# Integrate Emails with Phare
Source: https://docs.phare.io/integrations/email
Set up the Phare email integration to receive alerts when your website or server is down.
Good old email, still the backbone of professional communications! Phare's Email integration makes sure critical alerts land right in your team's inboxes. Set it up in the integration section of your dashboard.
## Email validation
To keep things secure and spam-free, only email addresses belonging to registered team members can receive alerts. Don't worry, support for generic addresses and distribution lists is on the roadmap, and you can [contact support](https://phare.io/contact) if you need a workaround in the meantime.
## Configuration
You can include up to 25 team members in each Email integration. Need to notify different groups for different alerts? Just create multiple Email integrations with the right people in each.
## Receiving Emails
All alerts come from the following address:
* **[alerts@phare.io](mailto:alerts@phare.io)**
Email delivery is no joke! That's why Phare uses not one, but two reliable SMTP providers for failover and redundancy:
* [Scaleway](https://www.scaleway.com/)
* [Brevo](https://www.brevo.com/)
This dual-provider approach means your critical alerts have a better chance of reaching you, even in the rare event one provider is experiencing issues.
# Integrate Outgoing Webhooks with Phare
Source: https://docs.phare.io/integrations/outgoing-webhook
Receive alerts by webhooks on third-party tools or build your own integration.
Want to build your own custom integration or connect Phare to a tool that isn’t officially supported? Outgoing webhooks are your best friend! They send HTTP callbacks with your alert data to any endpoint you specify, perfect for DIY integrations, logging or connecting to specialized systems.
## Configuration
Setting up an outgoing webhook is straightforward, you just need two pieces of information:
* **Callback URL**: Where should the data be sent? This could be an endpoint in your own application or a third-party service that accepts webhooks.
* **Signing secret**: A secret key that proves the data came from Phare and wasn't tampered with along the way.
A secure signing secret is automatically generated for you, but you're welcome to use your own if you prefer.
Congratulations!
You've completed the Phare onboarding process. Now the fun part begins, you can start exploring the different products and features Phare has to offer.
Monitor your websites and APIs, handle incidents, manage certificates
and create status pages
# Integrate Discord with Phare
Source: https://docs.phare.io/integrations/discord
Set up the Phare Discord integration to receive messages in your Discord server when your websites or APIs are down.
Bring your monitoring alerts right where your team hangs out! The Discord integration sends alerts directly to your chosen Discord channel, so you won't miss a beat when something needs attention. Set it up in your integrations dashboard.
## Configuration
Need alerts in different Discord channels? No problem! You can create multiple Discord integrations, each pointing to a specific channel. When you set up a Discord integration, you will be redirected to Discord to authorize the Phare app and select the right Discord server and channel for your alerts.
Pro tip: If you're a member of multiple Discord servers, double-check that
you're selecting the right one during the authorization step.
A name will be automatically suggested for your integration, feel free to give it a more descriptive name that helps you identify it when setting up alert rules later, especially if you're connecting to multiple channels or servers.
# Integrate Emails with Phare
Source: https://docs.phare.io/integrations/email
Set up the Phare email integration to receive alerts when your website or server is down.
Good old email, still the backbone of professional communications! Phare's Email integration makes sure critical alerts land right in your team's inboxes. Set it up in the integration section of your dashboard.
## Email validation
To keep things secure and spam-free, only email addresses belonging to registered team members can receive alerts. Don't worry, support for generic addresses and distribution lists is on the roadmap, and you can [contact support](https://phare.io/contact) if you need a workaround in the meantime.
## Configuration
You can include up to 25 team members in each Email integration. Need to notify different groups for different alerts? Just create multiple Email integrations with the right people in each.
## Receiving Emails
All alerts come from the following address:
* **[alerts@phare.io](mailto:alerts@phare.io)**
Email delivery is no joke! That's why Phare uses not one, but two reliable SMTP providers for failover and redundancy:
* [Scaleway](https://www.scaleway.com/)
* [Brevo](https://www.brevo.com/)
This dual-provider approach means your critical alerts have a better chance of reaching you, even in the rare event one provider is experiencing issues.
# Integrate Outgoing Webhooks with Phare
Source: https://docs.phare.io/integrations/outgoing-webhook
Receive alerts by webhooks on third-party tools or build your own integration.
Want to build your own custom integration or connect Phare to a tool that isn’t officially supported? Outgoing webhooks are your best friend! They send HTTP callbacks with your alert data to any endpoint you specify, perfect for DIY integrations, logging or connecting to specialized systems.
## Configuration
Setting up an outgoing webhook is straightforward, you just need two pieces of information:
* **Callback URL**: Where should the data be sent? This could be an endpoint in your own application or a third-party service that accepts webhooks.
* **Signing secret**: A secret key that proves the data came from Phare and wasn't tampered with along the way.
A secure signing secret is automatically generated for you, but you're welcome to use your own if you prefer.
 ## Using the integration
Once your webhook is set up, you can connect it to alert rules in your projects. A default JSON payload based on the alert event you've chosen will be generated, customize it as needed to fit your specific use case.
## Using the integration
Once your webhook is set up, you can connect it to alert rules in your projects. A default JSON payload based on the alert event you've chosen will be generated, customize it as needed to fit your specific use case.
 ## Payload customization
Make your webhooks work exactly how you want! You can reshape the JSON payload structure any way you like (as long as it's valid JSON), and use variables to inject dynamic data from the triggering event.
Each alert event type has its own set of available variables. Here's what you can use:
### Monitors
| Variable | Value |
| :------------------------------------- | :--------------------------------------------------------------------------- |
| **\$PROJECT\_ID** | Id of the project this monitor belongs to |
| **\$PROJECT\_NAME** | Name of the project this monitor belongs to |
| **\$PROJECT\_SLUG** | Slug of the project this monitor belongs to |
| **\$MONITOR\_ID** | Id of the monitor |
| **\$MONITOR\_NAME** | Name of the monitor |
| **\$MONITOR\_STATUS** | Status of the monitor |
| **\$MONITOR\_PROTOCOL** | Protocol used by the monitor |
| **\$MONITOR\_REQUEST** | Object containing request information for the monitor |
| **\$MONITOR\_REGIONS** | Array of regions where the monitor is running |
| **\$MONITOR\_INTERVAL** | Interval in seconds between each check for the monitor |
| **\$MONITOR\_INCIDENT\_CONFIRMATIONS** | Number of confirmations required to trigger an incident for the monitor |
| **\$MONITOR\_RECOVERY\_CONFIRMATIONS** | Number of confirmations required to recover from an incident for the monitor |
| Variable | Value |
| :--------------------------------------------- | :--------------------------------------------------------------------------- |
| **\$PROJECT\_ID** | Id of the project this monitor belongs to |
| **\$PROJECT\_NAME** | Name of the project this monitor belongs to |
| **\$PROJECT\_SLUG** | Slug of the project this monitor belongs to |
| **\$MONITOR\_ID** | Id of the monitor |
| **\$MONITOR\_NAME** | Name of the monitor |
| **\$MONITOR\_STATUS** | Status of the monitor |
| **\$MONITOR\_PROTOCOL** | Protocol used by the monitor |
| **\$MONITOR\_REQUEST** | Object containing request information for the monitor |
| **\$MONITOR\_REGIONS** | Array of regions where the monitor is running |
| **\$MONITOR\_INTERVAL** | Interval in seconds between each check for the monitor |
| **\$MONITOR\_INCIDENT\_CONFIRMATIONS** | Number of confirmations required to trigger an incident for the monitor |
| **\$MONITOR\_RECOVERY\_CONFIRMATIONS** | Number of confirmations required to recover from an incident for the monitor |
| **\$CERTIFICATE\_SERIAL\_NUMBER** | Serial number of the certificate |
| **\$CERTIFICATE\_SUBJECT\_COMMON\_NAME** | Common name of the certificate |
| **\$CERTIFICATE\_SUBJECT\_ALTERNATIVE\_NAMES** | Subject alternative names of the certificate |
| **\$CERTIFICATE\_ISSUER\_COMMON\_NAME** | Issuer common name of the certificate |
| **\$CERTIFICATE\_ISSUER\_ORGANIZATION** | Issuer organization of the certificate |
| **\$CERTIFICATE\_NOT\_BEFORE** | Not before date of the certificate |
| **\$CERTIFICATE\_NOT\_AFTER** | Not after date of the certificate |
### Incidents
| Variable | Value |
| :------------------------------------- | :------------------------------------------------------------------------------------------------------- |
| **\$PROJECT\_ID** | Id of the project this incident belongs to |
| **\$PROJECT\_NAME** | Name of the project this incident belongs to |
| **\$PROJECT\_SLUG** | Slug of the project this incident belongs to |
| **\$MONITOR\_ID** | Id of the monitor that triggered the incident |
| **\$MONITOR\_NAME** | Name of the monitor that triggered the incident |
| **\$MONITOR\_STATUS** | Status of the monitor that triggered the incident |
| **\$MONITOR\_PROTOCOL** | Protocol used by the monitor that triggered the incident |
| **\$MONITOR\_REQUEST** | Object containing request information for the monitor that triggered the incident |
| **\$MONITOR\_REGIONS** | Array of regions where the monitor that triggered the incident is running |
| **\$MONITOR\_INTERVAL** | Interval in seconds between each check for the monitor that triggered the incident |
| **\$MONITOR\_INCIDENT\_CONFIRMATIONS** | Number of confirmations required to trigger an incident for the monitor that triggered the incident |
| **\$MONITOR\_RECOVERY\_CONFIRMATIONS** | Number of confirmations required to recover from an incident for the monitor that triggered the incident |
| **\$INCIDENT\_ID** | Id of the incident |
| **\$INCIDENT\_SLUG** | Slug of the incident |
| **\$INCIDENT\_TITLE** | Title of the incident |
| **\$INCIDENT\_ERROR** | Error message of the incident |
| **\$INCIDENT\_STATE** | State of the incident |
| **\$INCIDENT\_STATUS** | Status of the incident |
| **\$INCIDENT\_IMPACT** | Impact of the incident |
| **\$USER\_ID** | Id of the user who created the comment |
| **\$USER\_EMAIL** | Email of the user who created the comment |
| **\$INCIDENT\_COMMENT\_ID** | Id of the comment |
| **\$INCIDENT\_COMMENT\_CONTENT** | Content of the comment |
| Variable | Value |
| :------------------------------------- | :------------------------------------------------------------------------------------------------------- |
| **\$PROJECT\_ID** | Id of the project this incident belongs to |
| **\$PROJECT\_NAME** | Name of the project this incident belongs to |
| **\$PROJECT\_SLUG** | Slug of the project this incident belongs to |
| **\$MONITOR\_ID** | Id of the monitor that triggered the incident |
| **\$MONITOR\_NAME** | Name of the monitor that triggered the incident |
| **\$MONITOR\_STATUS** | Status of the monitor that triggered the incident |
| **\$MONITOR\_PROTOCOL** | Protocol used by the monitor that triggered the incident |
| **\$MONITOR\_REQUEST** | Object containing request information for the monitor that triggered the incident |
| **\$MONITOR\_REGIONS** | Array of regions where the monitor that triggered the incident is running |
| **\$MONITOR\_INTERVAL** | Interval in seconds between each check for the monitor that triggered the incident |
| **\$MONITOR\_INCIDENT\_CONFIRMATIONS** | Number of confirmations required to trigger an incident for the monitor that triggered the incident |
| **\$MONITOR\_RECOVERY\_CONFIRMATIONS** | Number of confirmations required to recover from an incident for the monitor that triggered the incident |
| **\$INCIDENT\_ID** | Id of the incident |
| **\$INCIDENT\_SLUG** | Slug of the incident |
| **\$INCIDENT\_TITLE** | Title of the incident |
| **\$INCIDENT\_ERROR** | Error message of the incident |
| **\$INCIDENT\_STATE** | State of the incident |
| **\$INCIDENT\_STATUS** | Status of the incident |
| **\$INCIDENT\_IMPACT** | Impact of the incident |
| **\$USER\_ID** | Id of the user who published the update |
| **\$USER\_EMAIL** | Email of the user who published the update |
| **\$INCIDENT\_UPDATE\_ID** | Id of the update |
| **\$INCIDENT\_UPDATE\_STATE** | State of the update |
| **\$INCIDENT\_UPDATE\_CONTENT** | Content of the update |
## Webhook security
Trust but verify! Phare outgoing webhooks come with built-in security through HMAC-SHA256 signatures. This ensures the payloads you receive:
1. Actually came from Phare
2. Haven't been tampered with in transit
3. Aren't being replayed from previous requests
To verify a webhook's authenticity, compute the HMAC-SHA256 of this concatenated string:
```text
{version}.{timestamp}.{payload}
```
The version is always `v0` (this will be bumped if the algorithm ever change). You'll find the timestamp in the `X-Phare-Request-Timestamp` header and the signature in the `X-Phare-Request-Signature` header.
Here are some code examples to help you implement verification:
```javascript Node.js
const crypto = require('crypto');
app.post('/webhook', (req, res) => {
const secret = 'your-signing-secret';
const version = 'v0';
const timestamp = req.headers['x-phare-request-timestamp'];
const signature = req.headers['x-phare-request-signature'];
const payload = version + ':' + timestamp + ':' + JSON.stringify(req.body);
const hash = crypto.createHmac('sha256', secret)
.update(payload)
.digest('hex');
if (hash === signature) {
console.log('Signature verified');
} else {
console.log('Signature verification failed');
}
})
```
```php PHP
Pro security tip: Always check that the timestamp isn't too old, it is recommended
to reject a webhook older than 5 minutes to prevent replay attacks.
## Retry policy
Network hiccups happen, which is why Phare outgoing webhooks don't give up easily. If your endpoint doesn't respond with a 2xx status code within 30 seconds, it will be retried up to five times using an exponential backoff strategy:
1. First attempt: Immediate delivery
2. First retry: After 1 minute
3. Second retry: After 5 minutes
4. Third retry: After 10 minutes
5. Final retry: After 1 hour
This means that from first attempt to last retry, your webhook could arrive anytime within a 1 hour and 18 minute window (including timeouts).
## Debugging
Webhooks not working as expected? Logs are available with the request and response details making troubleshooting a breeze, you only need to click the row you would like to inspect.
## Payload customization
Make your webhooks work exactly how you want! You can reshape the JSON payload structure any way you like (as long as it's valid JSON), and use variables to inject dynamic data from the triggering event.
Each alert event type has its own set of available variables. Here's what you can use:
### Monitors
| Variable | Value |
| :------------------------------------- | :--------------------------------------------------------------------------- |
| **\$PROJECT\_ID** | Id of the project this monitor belongs to |
| **\$PROJECT\_NAME** | Name of the project this monitor belongs to |
| **\$PROJECT\_SLUG** | Slug of the project this monitor belongs to |
| **\$MONITOR\_ID** | Id of the monitor |
| **\$MONITOR\_NAME** | Name of the monitor |
| **\$MONITOR\_STATUS** | Status of the monitor |
| **\$MONITOR\_PROTOCOL** | Protocol used by the monitor |
| **\$MONITOR\_REQUEST** | Object containing request information for the monitor |
| **\$MONITOR\_REGIONS** | Array of regions where the monitor is running |
| **\$MONITOR\_INTERVAL** | Interval in seconds between each check for the monitor |
| **\$MONITOR\_INCIDENT\_CONFIRMATIONS** | Number of confirmations required to trigger an incident for the monitor |
| **\$MONITOR\_RECOVERY\_CONFIRMATIONS** | Number of confirmations required to recover from an incident for the monitor |
| Variable | Value |
| :------------------------------------- | :--------------------------------------------------------------------------- |
| **\$PROJECT\_ID** | Id of the project this monitor belongs to |
| **\$PROJECT\_NAME** | Name of the project this monitor belongs to |
| **\$PROJECT\_SLUG** | Slug of the project this monitor belongs to |
| **\$MONITOR\_ID** | Id of the monitor |
| **\$MONITOR\_NAME** | Name of the monitor |
| **\$MONITOR\_STATUS** | Status of the monitor |
| **\$MONITOR\_PROTOCOL** | Protocol used by the monitor |
| **\$MONITOR\_REQUEST** | Object containing request information for the monitor |
| **\$MONITOR\_REGIONS** | Array of regions where the monitor is running |
| **\$MONITOR\_INTERVAL** | Interval in seconds between each check for the monitor |
| **\$MONITOR\_INCIDENT\_CONFIRMATIONS** | Number of confirmations required to trigger an incident for the monitor |
| **\$MONITOR\_RECOVERY\_CONFIRMATIONS** | Number of confirmations required to recover from an incident for the monitor |
| Variable | Value |
| :--------------------------------------------- | :--------------------------------------------------------------------------- |
| **\$PROJECT\_ID** | Id of the project this monitor belongs to |
| **\$PROJECT\_NAME** | Name of the project this monitor belongs to |
| **\$PROJECT\_SLUG** | Slug of the project this monitor belongs to |
| **\$MONITOR\_ID** | Id of the monitor |
| **\$MONITOR\_NAME** | Name of the monitor |
| **\$MONITOR\_STATUS** | Status of the monitor |
| **\$MONITOR\_PROTOCOL** | Protocol used by the monitor |
| **\$MONITOR\_REQUEST** | Object containing request information for the monitor |
| **\$MONITOR\_REGIONS** | Array of regions where the monitor is running |
| **\$MONITOR\_INTERVAL** | Interval in seconds between each check for the monitor |
| **\$MONITOR\_INCIDENT\_CONFIRMATIONS** | Number of confirmations required to trigger an incident for the monitor |
| **\$MONITOR\_RECOVERY\_CONFIRMATIONS** | Number of confirmations required to recover from an incident for the monitor |
| **\$CERTIFICATE\_SERIAL\_NUMBER** | Serial number of the certificate |
| **\$CERTIFICATE\_SUBJECT\_COMMON\_NAME** | Common name of the certificate |
| **\$CERTIFICATE\_SUBJECT\_ALTERNATIVE\_NAMES** | Subject alternative names of the certificate |
| **\$CERTIFICATE\_ISSUER\_COMMON\_NAME** | Issuer common name of the certificate |
| **\$CERTIFICATE\_ISSUER\_ORGANIZATION** | Issuer organization of the certificate |
| **\$CERTIFICATE\_NOT\_BEFORE** | Not before date of the certificate |
| **\$CERTIFICATE\_NOT\_AFTER** | Not after date of the certificate |
| Variable | Value |
| :--------------------------------------------- | :--------------------------------------------------------------------------- |
| **\$PROJECT\_ID** | Id of the project this monitor belongs to |
| **\$PROJECT\_NAME** | Name of the project this monitor belongs to |
| **\$PROJECT\_SLUG** | Slug of the project this monitor belongs to |
| **\$MONITOR\_ID** | Id of the monitor |
| **\$MONITOR\_NAME** | Name of the monitor |
| **\$MONITOR\_STATUS** | Status of the monitor |
| **\$MONITOR\_PROTOCOL** | Protocol used by the monitor |
| **\$MONITOR\_REQUEST** | Object containing request information for the monitor |
| **\$MONITOR\_REGIONS** | Array of regions where the monitor is running |
| **\$MONITOR\_INTERVAL** | Interval in seconds between each check for the monitor |
| **\$MONITOR\_INCIDENT\_CONFIRMATIONS** | Number of confirmations required to trigger an incident for the monitor |
| **\$MONITOR\_RECOVERY\_CONFIRMATIONS** | Number of confirmations required to recover from an incident for the monitor |
| **\$CERTIFICATE\_SERIAL\_NUMBER** | Serial number of the certificate |
| **\$CERTIFICATE\_SUBJECT\_COMMON\_NAME** | Common name of the certificate |
| **\$CERTIFICATE\_SUBJECT\_ALTERNATIVE\_NAMES** | Subject alternative names of the certificate |
| **\$CERTIFICATE\_ISSUER\_COMMON\_NAME** | Issuer common name of the certificate |
| **\$CERTIFICATE\_ISSUER\_ORGANIZATION** | Issuer organization of the certificate |
| **\$CERTIFICATE\_NOT\_BEFORE** | Not before date of the certificate |
| **\$CERTIFICATE\_NOT\_AFTER** | Not after date of the certificate |
### Incidents
| Variable | Value |
| :------------------------------------- | :------------------------------------------------------------------------------------------------------- |
| **\$PROJECT\_ID** | Id of the project this incident belongs to |
| **\$PROJECT\_NAME** | Name of the project this incident belongs to |
| **\$PROJECT\_SLUG** | Slug of the project this incident belongs to |
| **\$MONITOR\_ID** | Id of the monitor that triggered the incident |
| **\$MONITOR\_NAME** | Name of the monitor that triggered the incident |
| **\$MONITOR\_STATUS** | Status of the monitor that triggered the incident |
| **\$MONITOR\_PROTOCOL** | Protocol used by the monitor that triggered the incident |
| **\$MONITOR\_REQUEST** | Object containing request information for the monitor that triggered the incident |
| **\$MONITOR\_REGIONS** | Array of regions where the monitor that triggered the incident is running |
| **\$MONITOR\_INTERVAL** | Interval in seconds between each check for the monitor that triggered the incident |
| **\$MONITOR\_INCIDENT\_CONFIRMATIONS** | Number of confirmations required to trigger an incident for the monitor that triggered the incident |
| **\$MONITOR\_RECOVERY\_CONFIRMATIONS** | Number of confirmations required to recover from an incident for the monitor that triggered the incident |
| **\$INCIDENT\_ID** | Id of the incident |
| **\$INCIDENT\_SLUG** | Slug of the incident |
| **\$INCIDENT\_TITLE** | Title of the incident |
| **\$INCIDENT\_ERROR** | Error message of the incident |
| **\$INCIDENT\_STATE** | State of the incident |
| **\$INCIDENT\_STATUS** | Status of the incident |
| **\$INCIDENT\_IMPACT** | Impact of the incident |
| Variable | Value |
| :------------------------------------- | :------------------------------------------------------------------------------------------------------- |
| **\$PROJECT\_ID** | Id of the project this incident belongs to |
| **\$PROJECT\_NAME** | Name of the project this incident belongs to |
| **\$PROJECT\_SLUG** | Slug of the project this incident belongs to |
| **\$MONITOR\_ID** | Id of the monitor that triggered the incident |
| **\$MONITOR\_NAME** | Name of the monitor that triggered the incident |
| **\$MONITOR\_STATUS** | Status of the monitor that triggered the incident |
| **\$MONITOR\_PROTOCOL** | Protocol used by the monitor that triggered the incident |
| **\$MONITOR\_REQUEST** | Object containing request information for the monitor that triggered the incident |
| **\$MONITOR\_REGIONS** | Array of regions where the monitor that triggered the incident is running |
| **\$MONITOR\_INTERVAL** | Interval in seconds between each check for the monitor that triggered the incident |
| **\$MONITOR\_INCIDENT\_CONFIRMATIONS** | Number of confirmations required to trigger an incident for the monitor that triggered the incident |
| **\$MONITOR\_RECOVERY\_CONFIRMATIONS** | Number of confirmations required to recover from an incident for the monitor that triggered the incident |
| **\$INCIDENT\_ID** | Id of the incident |
| **\$INCIDENT\_SLUG** | Slug of the incident |
| **\$INCIDENT\_TITLE** | Title of the incident |
| **\$INCIDENT\_ERROR** | Error message of the incident |
| **\$INCIDENT\_STATE** | State of the incident |
| **\$INCIDENT\_STATUS** | Status of the incident |
| **\$INCIDENT\_IMPACT** | Impact of the incident |
| Variable | Value |
| :------------------------------------- | :------------------------------------------------------------------------------------------------------- |
| **\$PROJECT\_ID** | Id of the project this incident belongs to |
| **\$PROJECT\_NAME** | Name of the project this incident belongs to |
| **\$PROJECT\_SLUG** | Slug of the project this incident belongs to |
| **\$MONITOR\_ID** | Id of the monitor that triggered the incident |
| **\$MONITOR\_NAME** | Name of the monitor that triggered the incident |
| **\$MONITOR\_STATUS** | Status of the monitor that triggered the incident |
| **\$MONITOR\_PROTOCOL** | Protocol used by the monitor that triggered the incident |
| **\$MONITOR\_REQUEST** | Object containing request information for the monitor that triggered the incident |
| **\$MONITOR\_REGIONS** | Array of regions where the monitor that triggered the incident is running |
| **\$MONITOR\_INTERVAL** | Interval in seconds between each check for the monitor that triggered the incident |
| **\$MONITOR\_INCIDENT\_CONFIRMATIONS** | Number of confirmations required to trigger an incident for the monitor that triggered the incident |
| **\$MONITOR\_RECOVERY\_CONFIRMATIONS** | Number of confirmations required to recover from an incident for the monitor that triggered the incident |
| **\$INCIDENT\_ID** | Id of the incident |
| **\$INCIDENT\_SLUG** | Slug of the incident |
| **\$INCIDENT\_TITLE** | Title of the incident |
| **\$INCIDENT\_ERROR** | Error message of the incident |
| **\$INCIDENT\_STATE** | State of the incident |
| **\$INCIDENT\_STATUS** | Status of the incident |
| **\$INCIDENT\_IMPACT** | Impact of the incident |
| **\$USER\_ID** | Id of the user who created the comment |
| **\$USER\_EMAIL** | Email of the user who created the comment |
| **\$INCIDENT\_COMMENT\_ID** | Id of the comment |
| **\$INCIDENT\_COMMENT\_CONTENT** | Content of the comment |
| Variable | Value |
| :------------------------------------- | :------------------------------------------------------------------------------------------------------- |
| **\$PROJECT\_ID** | Id of the project this incident belongs to |
| **\$PROJECT\_NAME** | Name of the project this incident belongs to |
| **\$PROJECT\_SLUG** | Slug of the project this incident belongs to |
| **\$MONITOR\_ID** | Id of the monitor that triggered the incident |
| **\$MONITOR\_NAME** | Name of the monitor that triggered the incident |
| **\$MONITOR\_STATUS** | Status of the monitor that triggered the incident |
| **\$MONITOR\_PROTOCOL** | Protocol used by the monitor that triggered the incident |
| **\$MONITOR\_REQUEST** | Object containing request information for the monitor that triggered the incident |
| **\$MONITOR\_REGIONS** | Array of regions where the monitor that triggered the incident is running |
| **\$MONITOR\_INTERVAL** | Interval in seconds between each check for the monitor that triggered the incident |
| **\$MONITOR\_INCIDENT\_CONFIRMATIONS** | Number of confirmations required to trigger an incident for the monitor that triggered the incident |
| **\$MONITOR\_RECOVERY\_CONFIRMATIONS** | Number of confirmations required to recover from an incident for the monitor that triggered the incident |
| **\$INCIDENT\_ID** | Id of the incident |
| **\$INCIDENT\_SLUG** | Slug of the incident |
| **\$INCIDENT\_TITLE** | Title of the incident |
| **\$INCIDENT\_ERROR** | Error message of the incident |
| **\$INCIDENT\_STATE** | State of the incident |
| **\$INCIDENT\_STATUS** | Status of the incident |
| **\$INCIDENT\_IMPACT** | Impact of the incident |
| **\$USER\_ID** | Id of the user who published the update |
| **\$USER\_EMAIL** | Email of the user who published the update |
| **\$INCIDENT\_UPDATE\_ID** | Id of the update |
| **\$INCIDENT\_UPDATE\_STATE** | State of the update |
| **\$INCIDENT\_UPDATE\_CONTENT** | Content of the update |
## Webhook security
Trust but verify! Phare outgoing webhooks come with built-in security through HMAC-SHA256 signatures. This ensures the payloads you receive:
1. Actually came from Phare
2. Haven't been tampered with in transit
3. Aren't being replayed from previous requests
To verify a webhook's authenticity, compute the HMAC-SHA256 of this concatenated string:
```text
{version}.{timestamp}.{payload}
```
The version is always `v0` (this will be bumped if the algorithm ever change). You'll find the timestamp in the `X-Phare-Request-Timestamp` header and the signature in the `X-Phare-Request-Signature` header.
Here are some code examples to help you implement verification:
```javascript Node.js
const crypto = require('crypto');
app.post('/webhook', (req, res) => {
const secret = 'your-signing-secret';
const version = 'v0';
const timestamp = req.headers['x-phare-request-timestamp'];
const signature = req.headers['x-phare-request-signature'];
const payload = version + ':' + timestamp + ':' + JSON.stringify(req.body);
const hash = crypto.createHmac('sha256', secret)
.update(payload)
.digest('hex');
if (hash === signature) {
console.log('Signature verified');
} else {
console.log('Signature verification failed');
}
})
```
```php PHP
Pro security tip: Always check that the timestamp isn't too old, it is recommended
to reject a webhook older than 5 minutes to prevent replay attacks.
## Retry policy
Network hiccups happen, which is why Phare outgoing webhooks don't give up easily. If your endpoint doesn't respond with a 2xx status code within 30 seconds, it will be retried up to five times using an exponential backoff strategy:
1. First attempt: Immediate delivery
2. First retry: After 1 minute
3. Second retry: After 5 minutes
4. Third retry: After 10 minutes
5. Final retry: After 1 hour
This means that from first attempt to last retry, your webhook could arrive anytime within a 1 hour and 18 minute window (including timeouts).
## Debugging
Webhooks not working as expected? Logs are available with the request and response details making troubleshooting a breeze, you only need to click the row you would like to inspect.
 # Integrations overview
Source: https://docs.phare.io/integrations/overview
Seamlessly connect your favorite apps and services with Phare
Phare plays nicely with other tools, making it easy to integrate with your preferred apps and services. Whether you want to receive alerts in your favorite chat app, or send JSON data to a third-party service, you should be covered.
Setting up integrations is a breeze, visit your integrations dashboard to get started. Create as many connections as you need to ensure the right people have access to the right information.
# Integrations overview
Source: https://docs.phare.io/integrations/overview
Seamlessly connect your favorite apps and services with Phare
Phare plays nicely with other tools, making it easy to integrate with your preferred apps and services. Whether you want to receive alerts in your favorite chat app, or send JSON data to a third-party service, you should be covered.
Setting up integrations is a breeze, visit your integrations dashboard to get started. Create as many connections as you need to ensure the right people have access to the right information.
 ## Alert integrations
Alert integrations are notification channels that can be used when configuring [alert rules](/uptime/alerting). By choosing the right integration for each alert rule, you can make sure the right people get notified on their preferred platforms.
Here's the list of available alert integrations:
}
href="/integrations/pushover"
horizontal
/>
### Resilience
All alert integrations are designed to be resilient and deliver notifications during critical moments. An aggressive retry strategy ensures that if any notification fails to send, it will be retried until it goes through. This means you can rest easy knowing that your team will be alerted, even if there are temporary hiccups in the connection or with third-party services. In case a notification still fails after multiple attempts, Phare will log the error and notify the organization owner by email, so they can take action if needed.
Email are sent through two different SMTP providers, [Scaleway](https://www.scaleway.com/) and [Brevo](https://www.brevo.com/), ensuring redundancy and reliability. If one provider experiences issues, the other will step in to deliver your alerts.
### Detailed logs
## Alert integrations
Alert integrations are notification channels that can be used when configuring [alert rules](/uptime/alerting). By choosing the right integration for each alert rule, you can make sure the right people get notified on their preferred platforms.
Here's the list of available alert integrations:
}
href="/integrations/pushover"
horizontal
/>
### Resilience
All alert integrations are designed to be resilient and deliver notifications during critical moments. An aggressive retry strategy ensures that if any notification fails to send, it will be retried until it goes through. This means you can rest easy knowing that your team will be alerted, even if there are temporary hiccups in the connection or with third-party services. In case a notification still fails after multiple attempts, Phare will log the error and notify the organization owner by email, so they can take action if needed.
Email are sent through two different SMTP providers, [Scaleway](https://www.scaleway.com/) and [Brevo](https://www.brevo.com/), ensuring redundancy and reliability. If one provider experiences issues, the other will step in to deliver your alerts.
### Detailed logs
 Detailed logs of all sent notifications are available in the Phare dashboard, so you can easily track the status of your alerts and troubleshoot any issues.
***
Is your team's favorite tool missing from this list? [Contact support](https://phare.io/contact), to have it added to the roadmap!
# Integrate Pushover with Phare
Source: https://docs.phare.io/integrations/pushover
Set up the Phare integration with Pushover to receive alerts on your preferred device.
Want your monitoring alerts delivered straight to your pocket? The Pushover integration lets you receive instant notifications on your phone, tablet, or desktop. Configure it in your integrations dashboard.
## Pre-requisites
Before you can start receiving Pushover notifications from Phare, you'll need two things:
1. A Pushover account (they have a one-time purchase model, no subscriptions!)
2. A Pushover application set up to connect with Phare
You can find your user key in the [Pushover dashboard](https://pushover.net/), and create a new application via the link at the bottom of that page. Feel free to customize your app however you like, or use these ready-made settings:
* Name: Phare
* Description: Receive notifications from Phare.io
* URL: [https://phare.io](https://phare.io)
* Icon: [Phare logo](https://phare.io/img/logo-pushover.png)
Detailed logs of all sent notifications are available in the Phare dashboard, so you can easily track the status of your alerts and troubleshoot any issues.
***
Is your team's favorite tool missing from this list? [Contact support](https://phare.io/contact), to have it added to the roadmap!
# Integrate Pushover with Phare
Source: https://docs.phare.io/integrations/pushover
Set up the Phare integration with Pushover to receive alerts on your preferred device.
Want your monitoring alerts delivered straight to your pocket? The Pushover integration lets you receive instant notifications on your phone, tablet, or desktop. Configure it in your integrations dashboard.
## Pre-requisites
Before you can start receiving Pushover notifications from Phare, you'll need two things:
1. A Pushover account (they have a one-time purchase model, no subscriptions!)
2. A Pushover application set up to connect with Phare
You can find your user key in the [Pushover dashboard](https://pushover.net/), and create a new application via the link at the bottom of that page. Feel free to customize your app however you like, or use these ready-made settings:
* Name: Phare
* Description: Receive notifications from Phare.io
* URL: [https://phare.io](https://phare.io)
* Icon: [Phare logo](https://phare.io/img/logo-pushover.png)
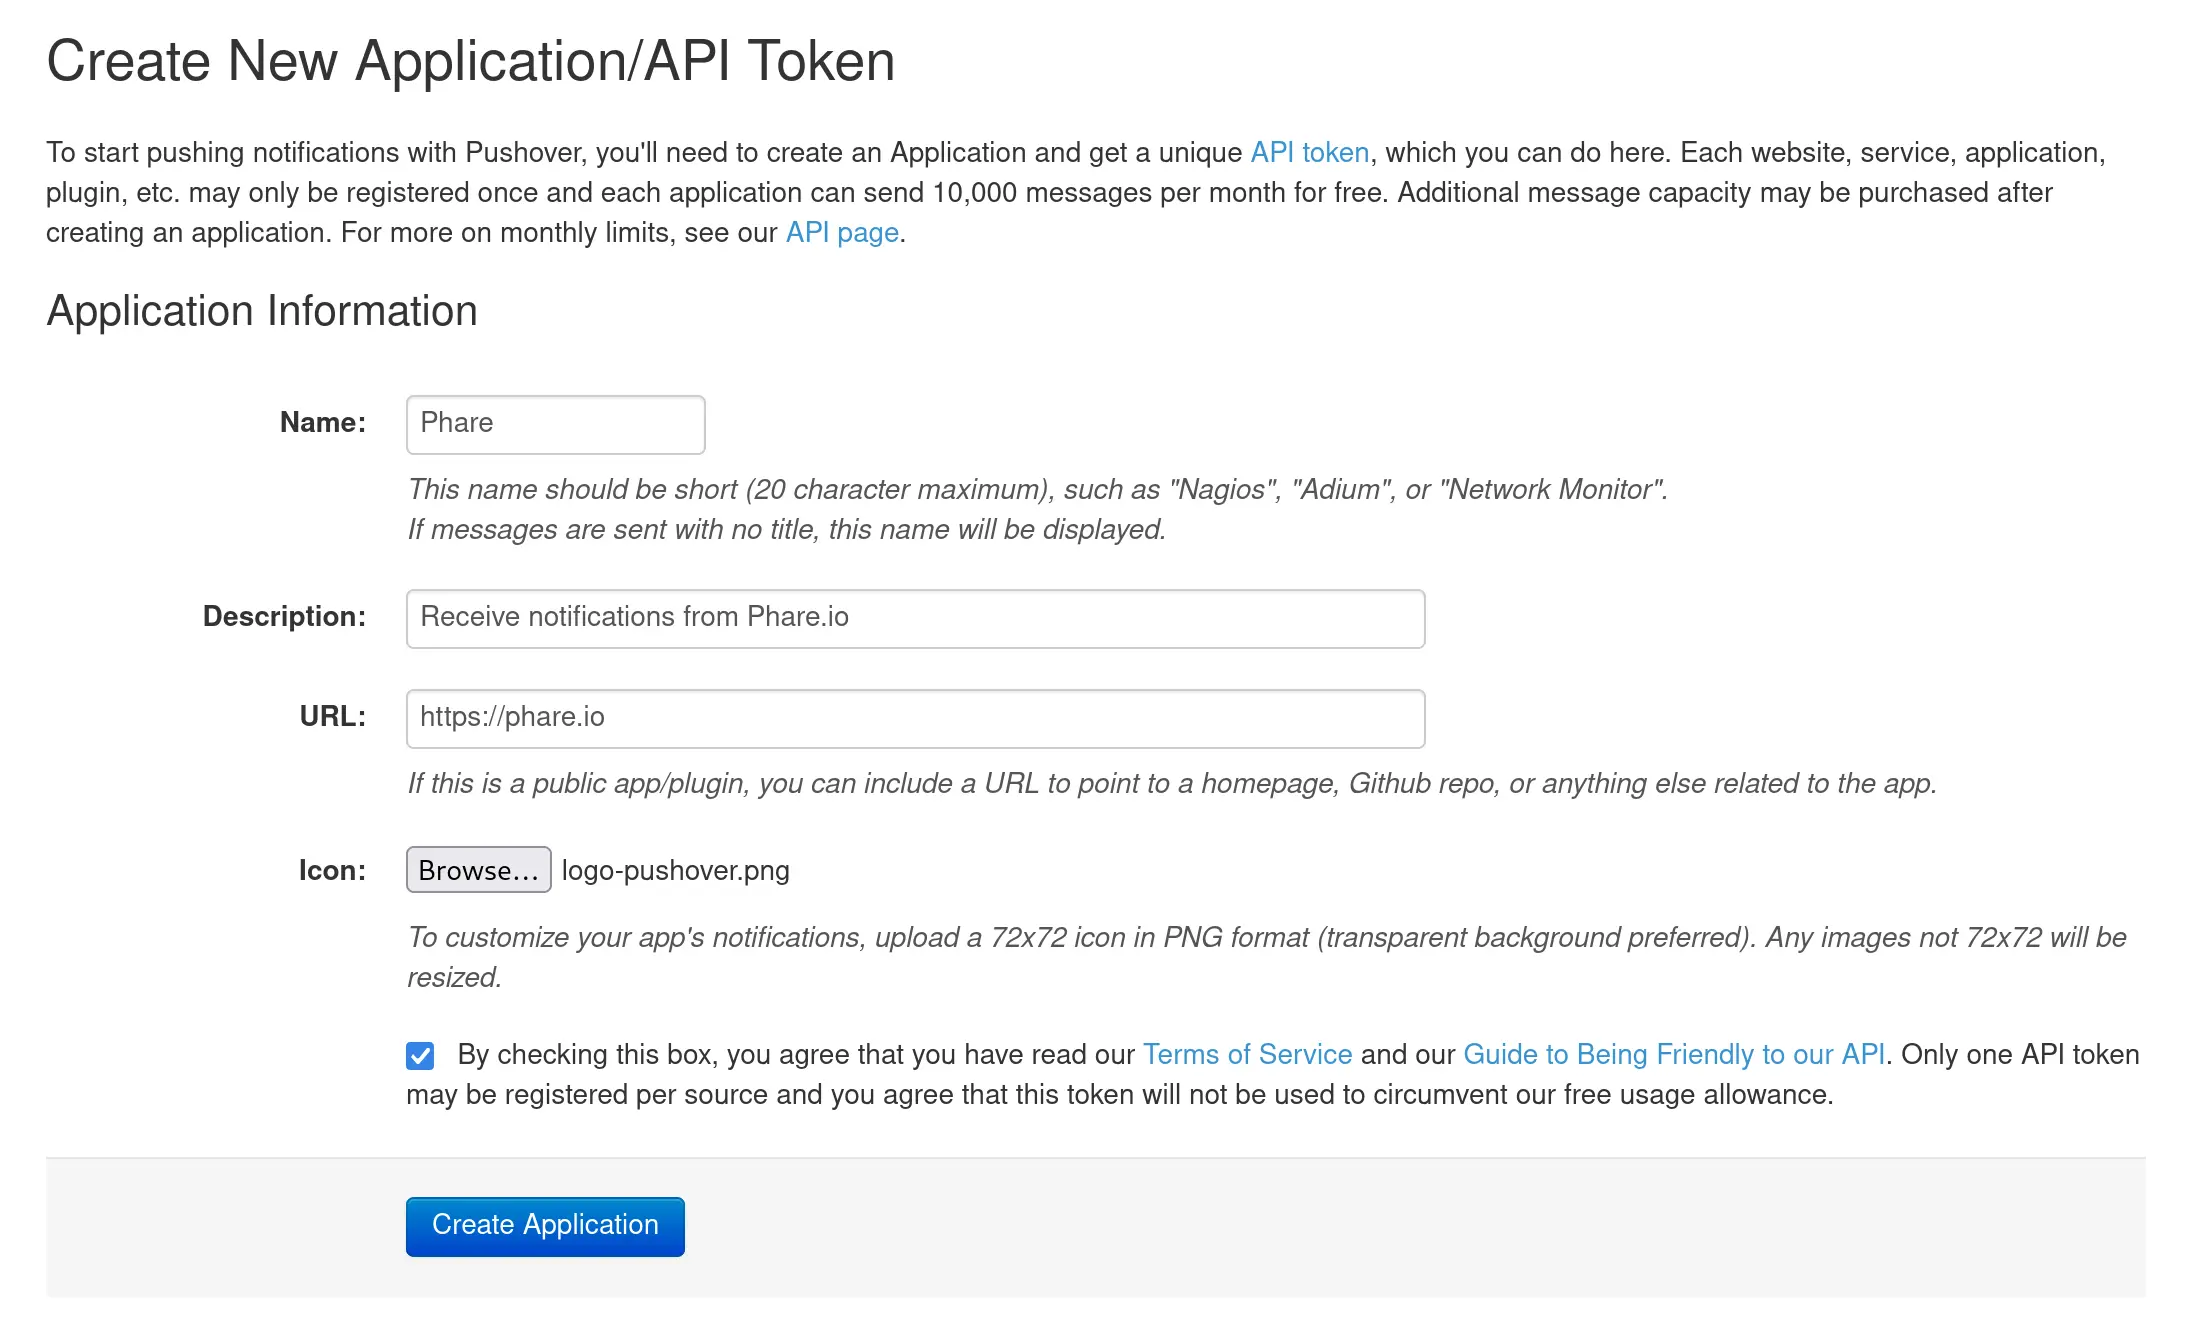 ## Configuration
Setting up the integration is simple, just connect the dots between Phare and Pushover by adding your user key and the API key from your newly created Pushover application.
## Configuration
Setting up the integration is simple, just connect the dots between Phare and Pushover by adding your user key and the API key from your newly created Pushover application.
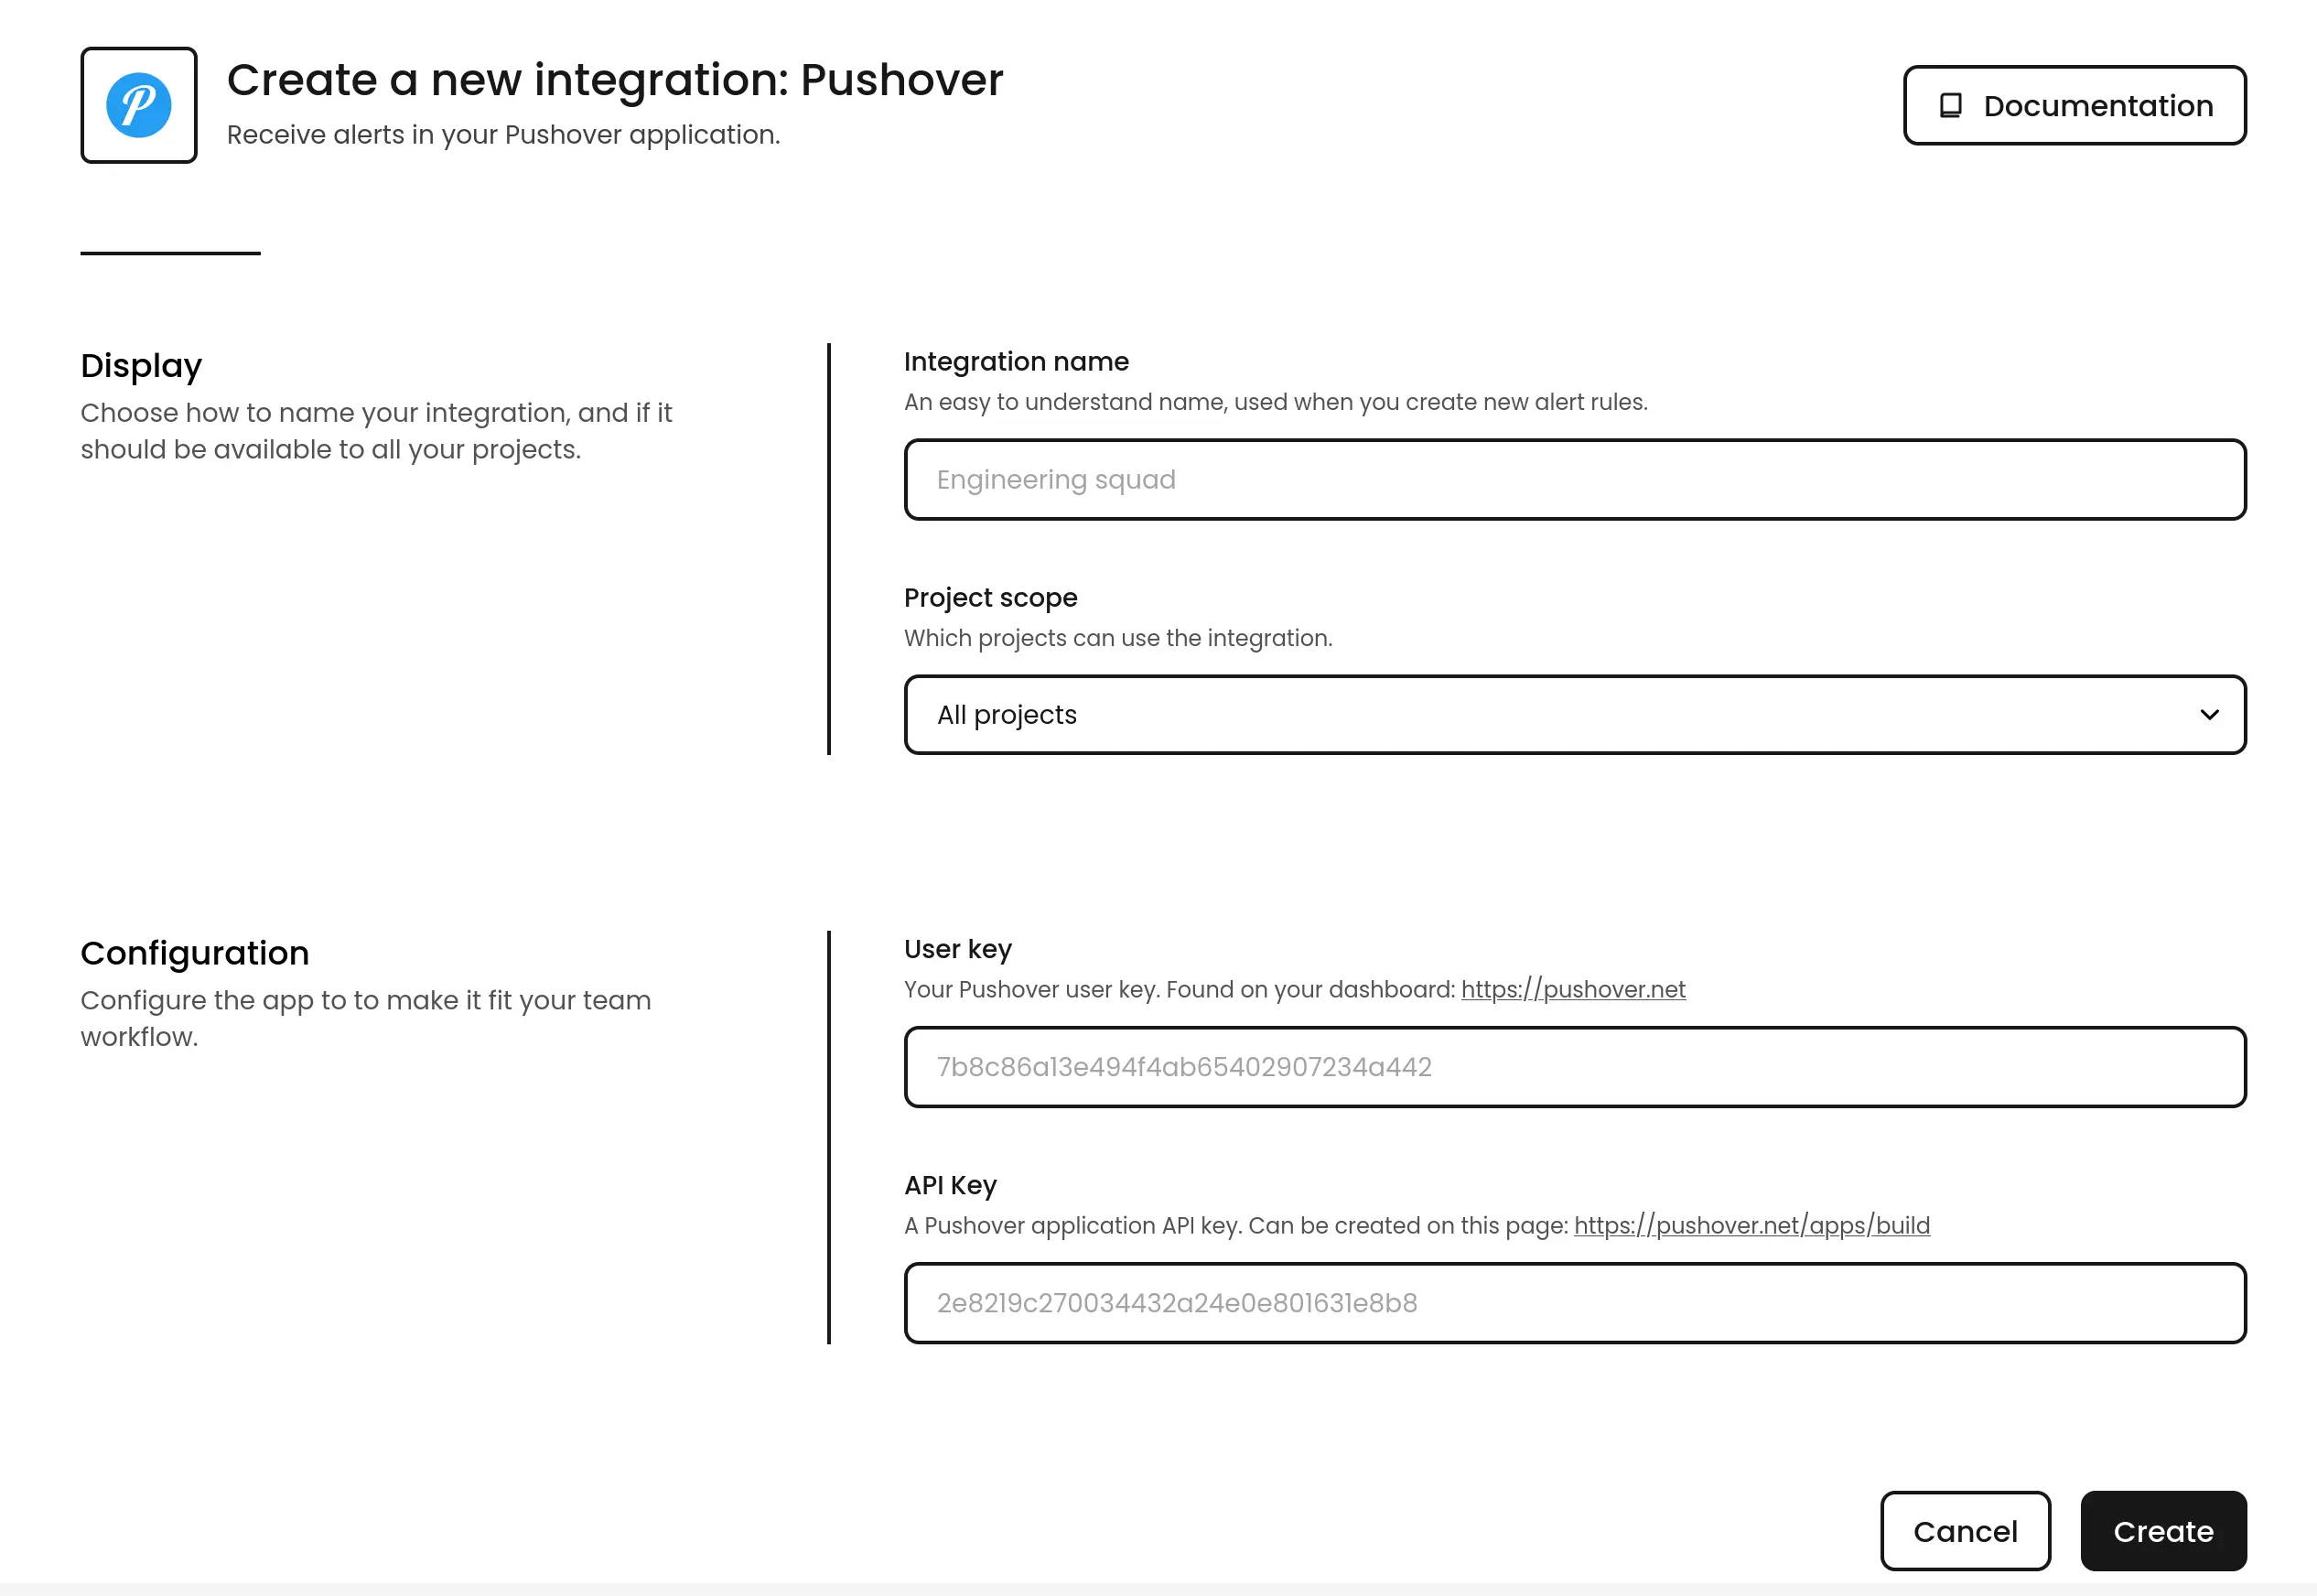 ## Usage
With everything connected, you can choose Pushover as a notification channel when creating or editing alert rules. One of the coolest features? You can set different priority levels for different types of alerts, making that 3AM wake-up call reserved for truly critical issues.
If you choose the `Emergency` priority level, you'll need to specify two additional parameters:
* `retry`: How often (in seconds) the alert should repeat
* `expire`: How long (in seconds) the alert should continue trying before giving up
These parameters help ensure critical alerts don't go unnoticed, and you can learn more about them in the [Pushover API documentation](https://pushover.net/api#priority).
## Usage
With everything connected, you can choose Pushover as a notification channel when creating or editing alert rules. One of the coolest features? You can set different priority levels for different types of alerts, making that 3AM wake-up call reserved for truly critical issues.
If you choose the `Emergency` priority level, you'll need to specify two additional parameters:
* `retry`: How often (in seconds) the alert should repeat
* `expire`: How long (in seconds) the alert should continue trying before giving up
These parameters help ensure critical alerts don't go unnoticed, and you can learn more about them in the [Pushover API documentation](https://pushover.net/api#priority).
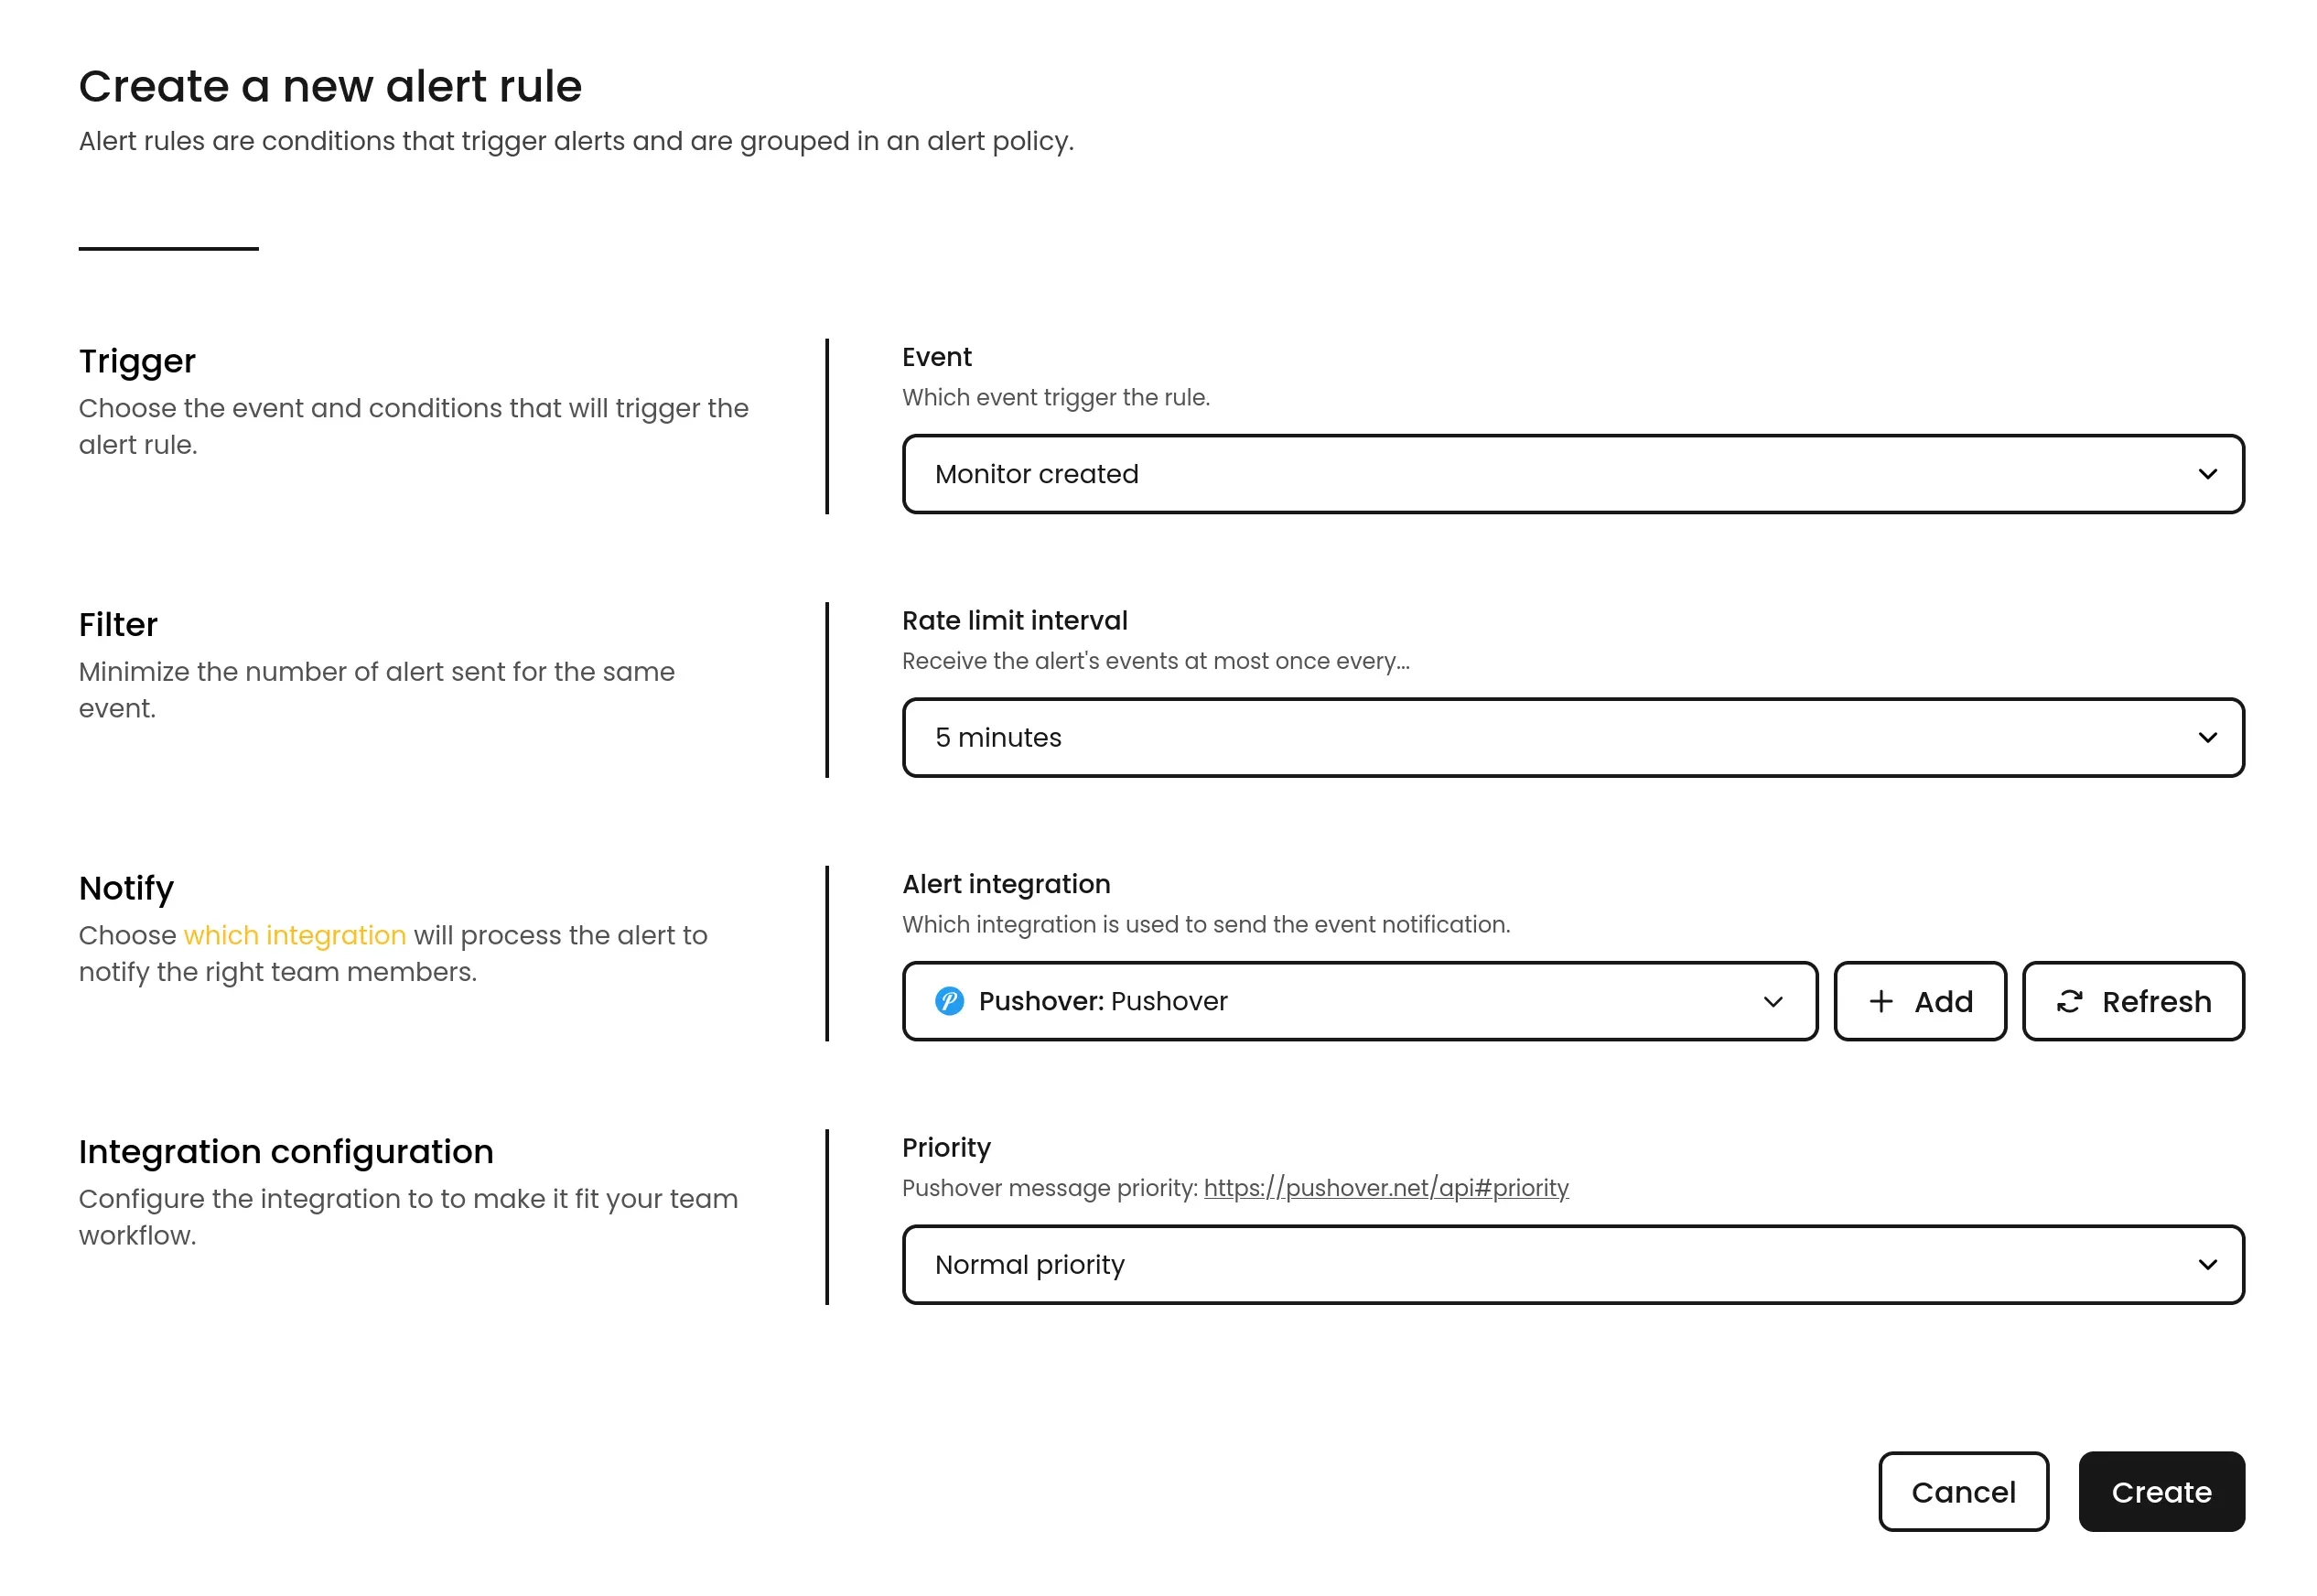 # Integrate Slack with Phare
Source: https://docs.phare.io/integrations/slack
Set up the Phare integration for Slack to receive a message in your Slack workspace when your website or server is down.
Keep your team in the loop with the Phare integration for Slack! Get alerts delivered directly to your team's go-to communication hub, where the conversations already happen.
## Installation
Getting started is easy. Head over to your integrations dashboard, find Slack in the list, and click the **New installation** button.
# Integrate Slack with Phare
Source: https://docs.phare.io/integrations/slack
Set up the Phare integration for Slack to receive a message in your Slack workspace when your website or server is down.
Keep your team in the loop with the Phare integration for Slack! Get alerts delivered directly to your team's go-to communication hub, where the conversations already happen.
## Installation
Getting started is easy. Head over to your integrations dashboard, find Slack in the list, and click the **New installation** button.
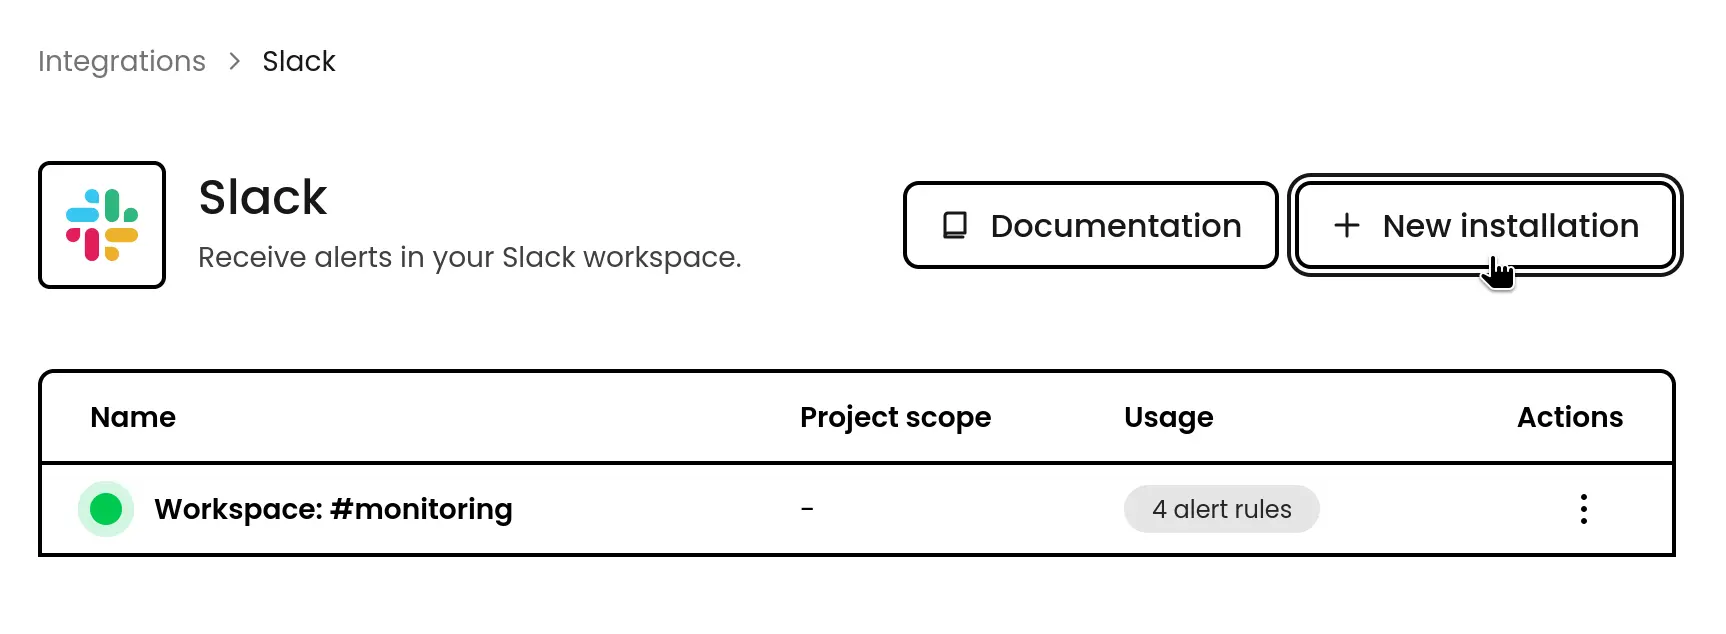 You'll be redirected to Slack's authorization page where you can give Phare permission to send those important notifications to your workspace.
## Configuration
Each Slack installation connects to one channel, but don't worry, you can create multiple integrations if you want alerts in different channels. Maybe critical issues go to #incidents while minor hiccups go to #monitoring? The choice is yours!
Pro tip: If you belong to several Slack workspaces, double-check you're connecting to the right one during setup.
A default name will be suggested for your integration, feel free to change it for something more descriptive that makes sense for your team, especially helpful when you're setting up multiple Slack integrations.
You'll be redirected to Slack's authorization page where you can give Phare permission to send those important notifications to your workspace.
## Configuration
Each Slack installation connects to one channel, but don't worry, you can create multiple integrations if you want alerts in different channels. Maybe critical issues go to #incidents while minor hiccups go to #monitoring? The choice is yours!
Pro tip: If you belong to several Slack workspaces, double-check you're connecting to the right one during setup.
A default name will be suggested for your integration, feel free to change it for something more descriptive that makes sense for your team, especially helpful when you're setting up multiple Slack integrations.
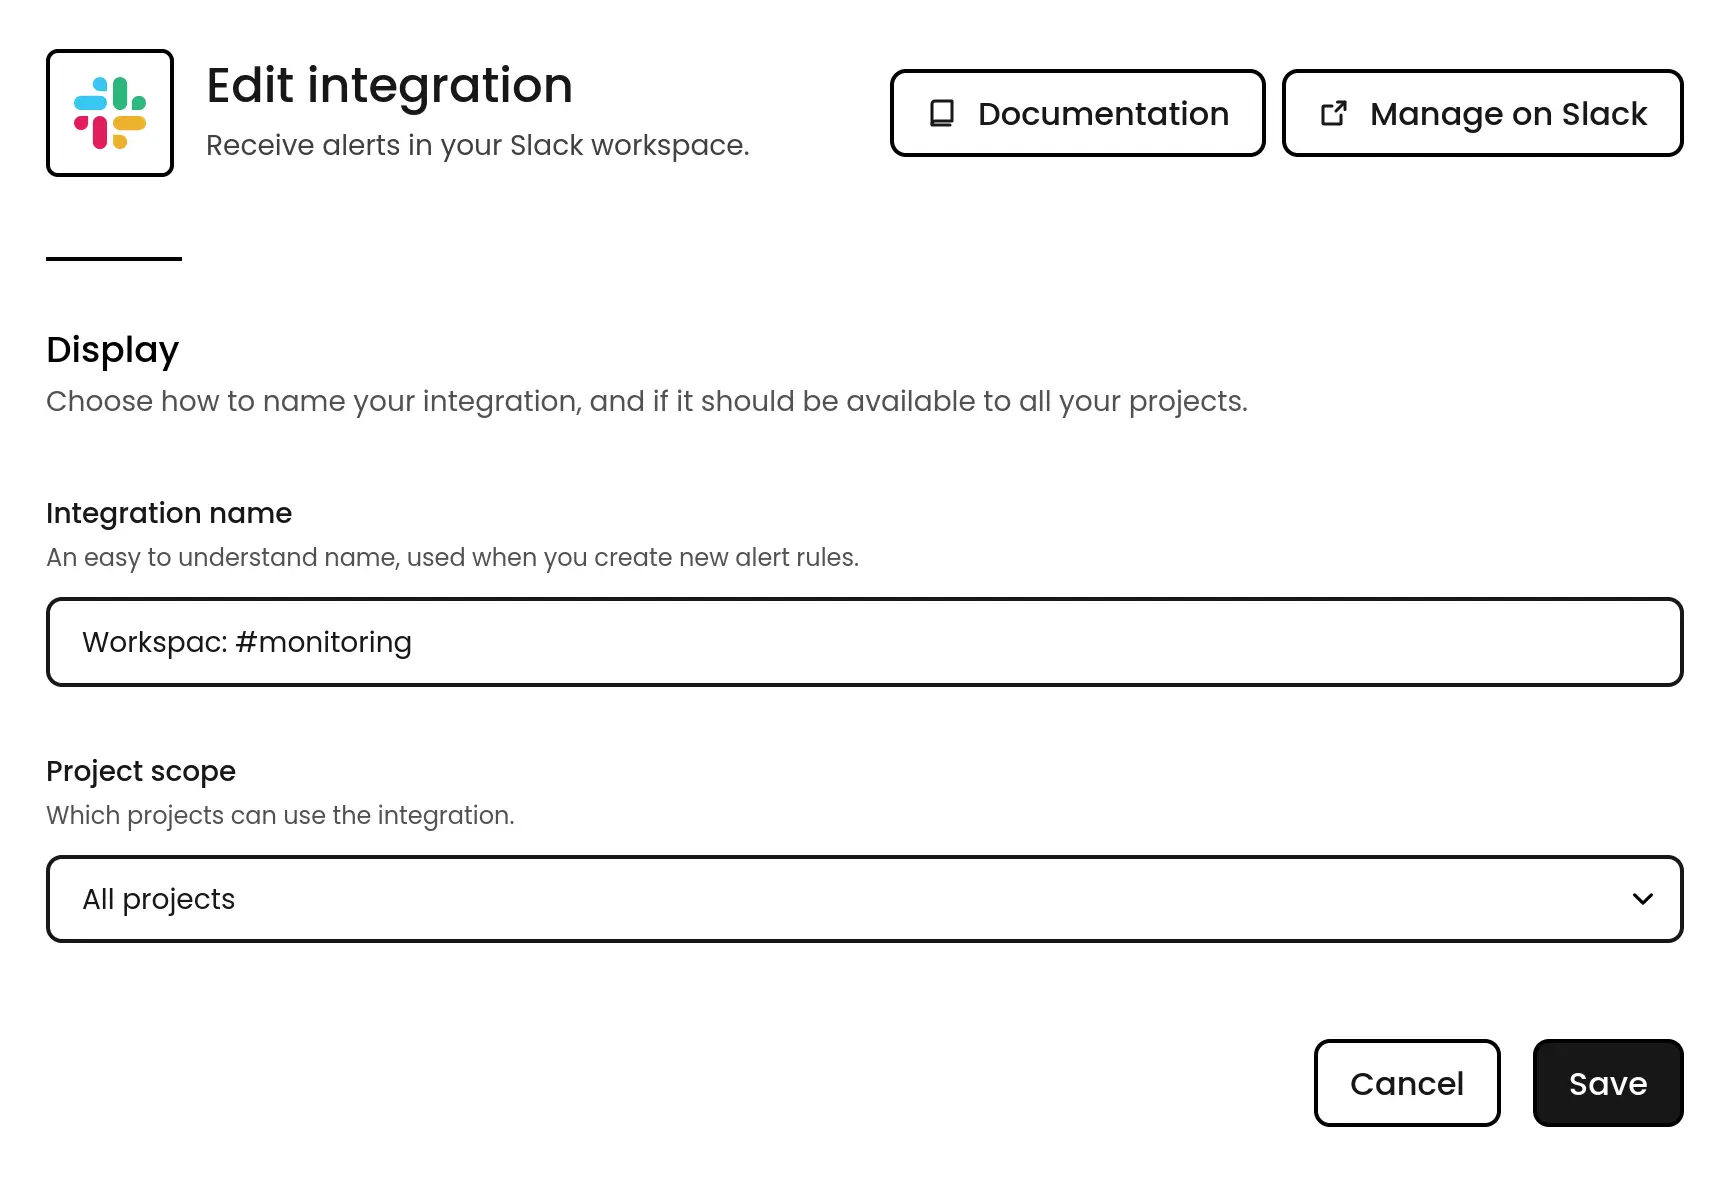 ## Receiving Slack messages
When an alert rule triggers, Phare will send an informative message to your selected Slack channel with all the details your team needs. To learn more about configuring when and how these alerts trigger, check out our [alerting documentation](/uptime/alerting).
## Receiving Slack messages
When an alert rule triggers, Phare will send an informative message to your selected Slack channel with all the details your team needs. To learn more about configuring when and how these alerts trigger, check out our [alerting documentation](/uptime/alerting).
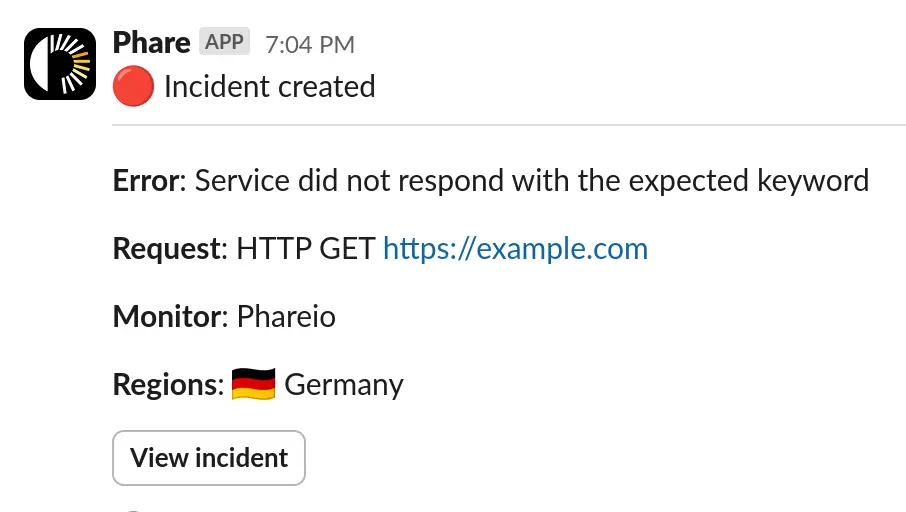 ## Privacy
Phare only shares the minimum information needed with Slack to deliver your notifications. Phare stores your workspace name, identifier, and an access token for sending messages. For the full details on how your data is handled, take a look at the [privacy policy](https://phare.io/legal/privacy-policy).
# Integrate SMS with Phare
Source: https://docs.phare.io/integrations/sms
Set up the Phare SMS integration to receive a message on your phone when your website or server is down.
This integration is only available with a Scale plan subscription and in selected countries
When email just won't cut it and you need alerts that grab attention immediately, the SMS integration delivers critical notifications straight to your phone. Configure it in the integration section of your dashboard.
## Phone number validation
For security and to prevent misuse, each team member needs to verify their phone number before receiving alerts. It's simple, just visit the user settings page and follow the verification steps.
## Privacy
Phare only shares the minimum information needed with Slack to deliver your notifications. Phare stores your workspace name, identifier, and an access token for sending messages. For the full details on how your data is handled, take a look at the [privacy policy](https://phare.io/legal/privacy-policy).
# Integrate SMS with Phare
Source: https://docs.phare.io/integrations/sms
Set up the Phare SMS integration to receive a message on your phone when your website or server is down.
This integration is only available with a Scale plan subscription and in selected countries
When email just won't cut it and you need alerts that grab attention immediately, the SMS integration delivers critical notifications straight to your phone. Configure it in the integration section of your dashboard.
## Phone number validation
For security and to prevent misuse, each team member needs to verify their phone number before receiving alerts. It's simple, just visit the user settings page and follow the verification steps.
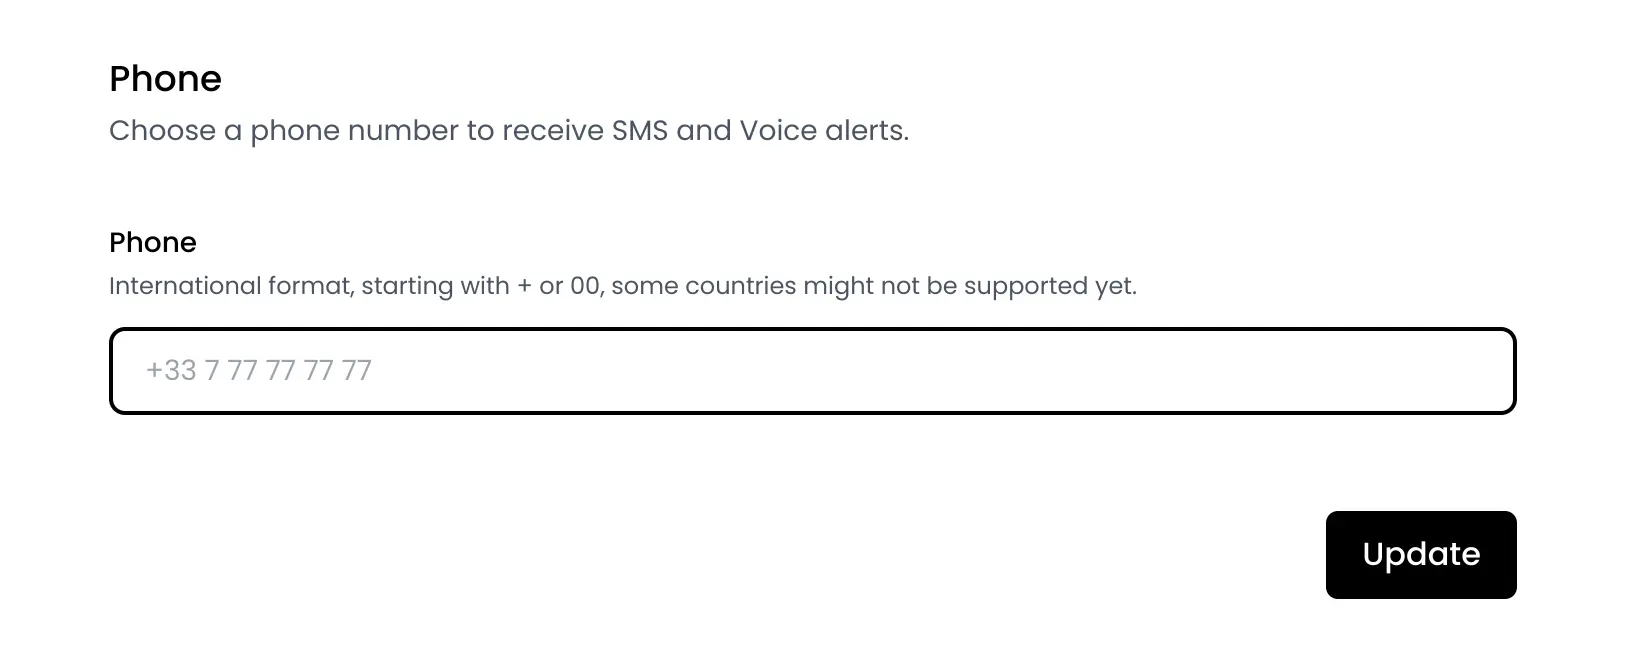 ## Configuration
You can include up to 25 team members in each SMS integration. When searching for team members, you'll see instantly who has a verified phone number ready to go. Don't worry if someone hasn't verified their number yet, you can still add them, and they'll start receiving alerts once they complete verification.
## Configuration
You can include up to 25 team members in each SMS integration. When searching for team members, you'll see instantly who has a verified phone number ready to go. Don't worry if someone hasn't verified their number yet, you can still add them, and they'll start receiving alerts once they complete verification.
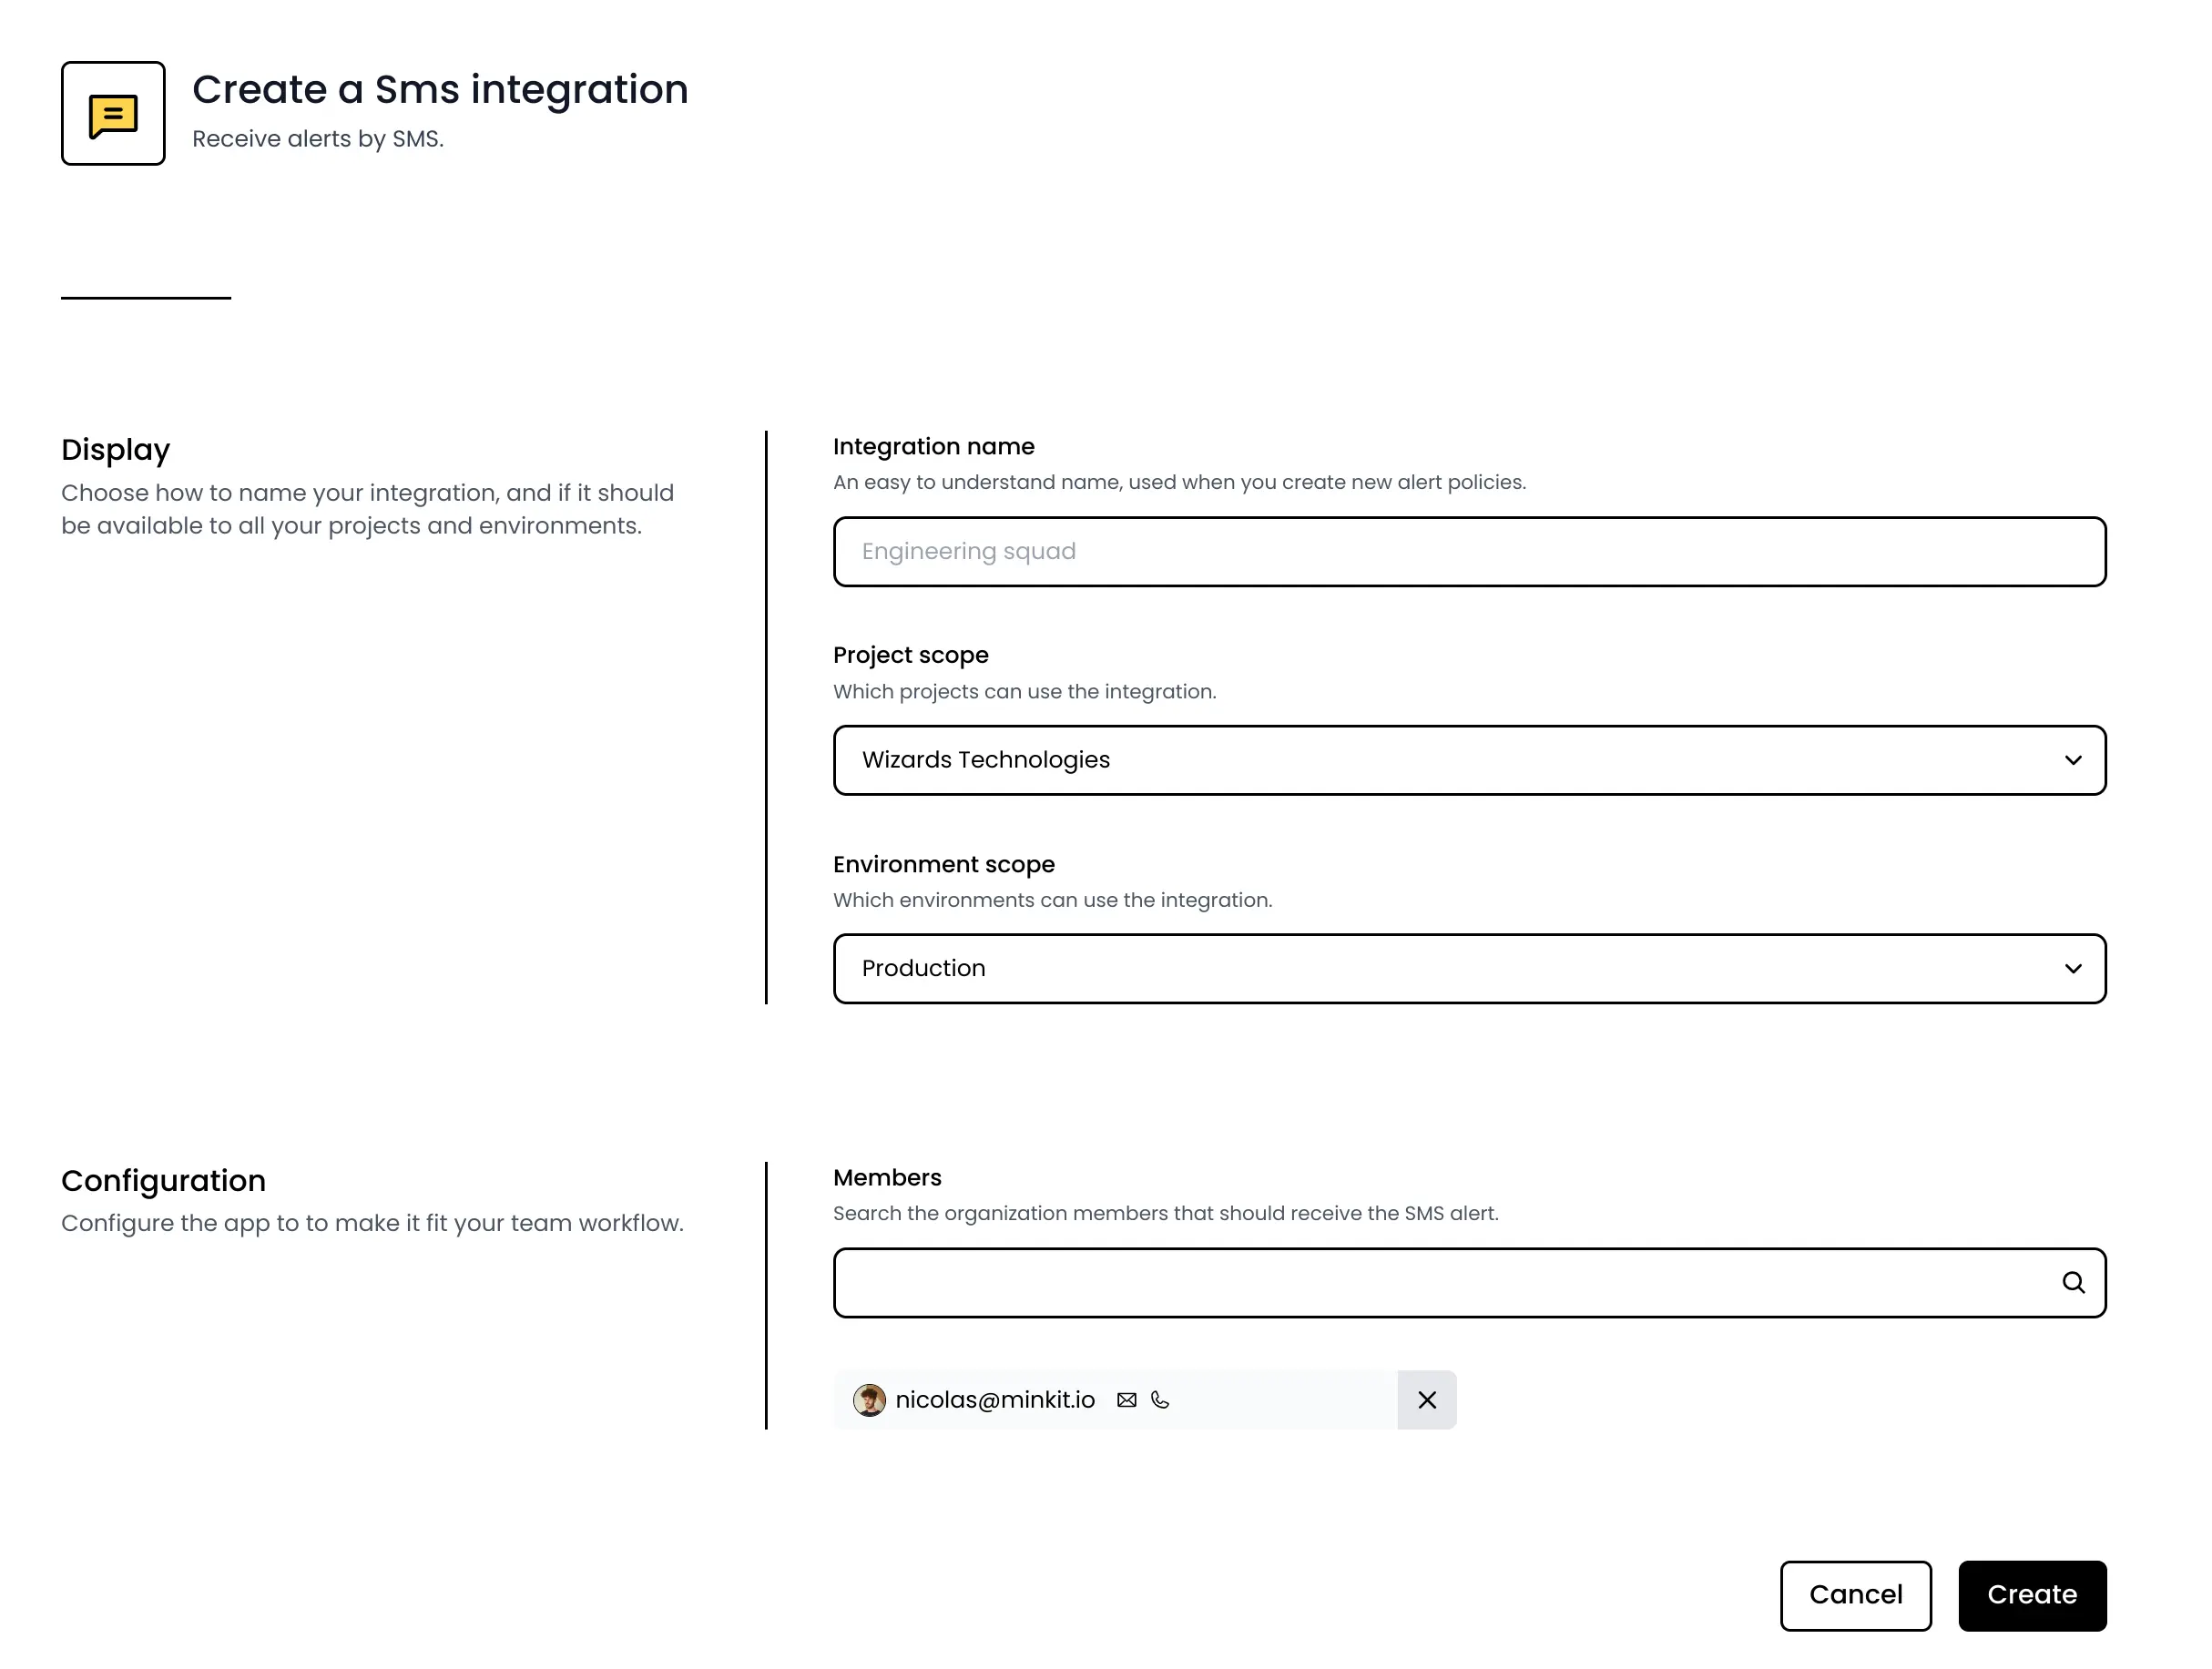 ## Receiving SMS
When an alert triggers, your configured team members will receive a text message from the **Phare** originator, which is a special sender ID that identifies the message as coming from Phare.
## Supported countries
Currently, the SMS integration works in the following regions:
* Austria
* Belgium
* Bulgaria
* Croatia
* Cyprus
* Czech Republic
* Denmark
* Estonia
* Finland
* France
* Germany
* Greece
* Hungary
* Iceland
* Ireland
* Italy
* Latvia
* Lithuania
* Luxembourg
* Malta
* Netherlands
* Norway
* Poland
* Portugal
* Romania
* Slovakia
* Slovenia
* Spain
* Sweden
* Switzerland
* United Kingdom
* Canada
## Request a new country
Need SMS alerts in a country that isn’t listed? It typically takes three business days to add a new country, but it depends on the local regulations.
Each country requires specific compliance that Phare needs to go through, [Contact the Phare support](https://phare.io/contact) to request adding a new country.
# Integrate Telegram with Phare
Source: https://docs.phare.io/integrations/telegram
Set up the Phare Telegram integration to receive alerts when your website or server is down.
Love the speed and simplicity of Telegram? This integration brings Phare alerts directly to your Telegram chats, perfect for teams that prefer its secure, lightweight messaging experience. Set it up in your integrations dashboard.
## Configuration
After creating your Telegram integration in Phare, you'll get two convenient options:
* **Personal alerts**: A link/QR code that connects the Phare bot to your personal Telegram account. Share this with anyone on your team who wants alerts on their individual accounts.
* **Group alerts**: A link/QR code for adding the bot to an existing Telegram group, ideal for team-wide monitoring alerts.
## Receiving SMS
When an alert triggers, your configured team members will receive a text message from the **Phare** originator, which is a special sender ID that identifies the message as coming from Phare.
## Supported countries
Currently, the SMS integration works in the following regions:
* Austria
* Belgium
* Bulgaria
* Croatia
* Cyprus
* Czech Republic
* Denmark
* Estonia
* Finland
* France
* Germany
* Greece
* Hungary
* Iceland
* Ireland
* Italy
* Latvia
* Lithuania
* Luxembourg
* Malta
* Netherlands
* Norway
* Poland
* Portugal
* Romania
* Slovakia
* Slovenia
* Spain
* Sweden
* Switzerland
* United Kingdom
* Canada
## Request a new country
Need SMS alerts in a country that isn’t listed? It typically takes three business days to add a new country, but it depends on the local regulations.
Each country requires specific compliance that Phare needs to go through, [Contact the Phare support](https://phare.io/contact) to request adding a new country.
# Integrate Telegram with Phare
Source: https://docs.phare.io/integrations/telegram
Set up the Phare Telegram integration to receive alerts when your website or server is down.
Love the speed and simplicity of Telegram? This integration brings Phare alerts directly to your Telegram chats, perfect for teams that prefer its secure, lightweight messaging experience. Set it up in your integrations dashboard.
## Configuration
After creating your Telegram integration in Phare, you'll get two convenient options:
* **Personal alerts**: A link/QR code that connects the Phare bot to your personal Telegram account. Share this with anyone on your team who wants alerts on their individual accounts.
* **Group alerts**: A link/QR code for adding the bot to an existing Telegram group, ideal for team-wide monitoring alerts.
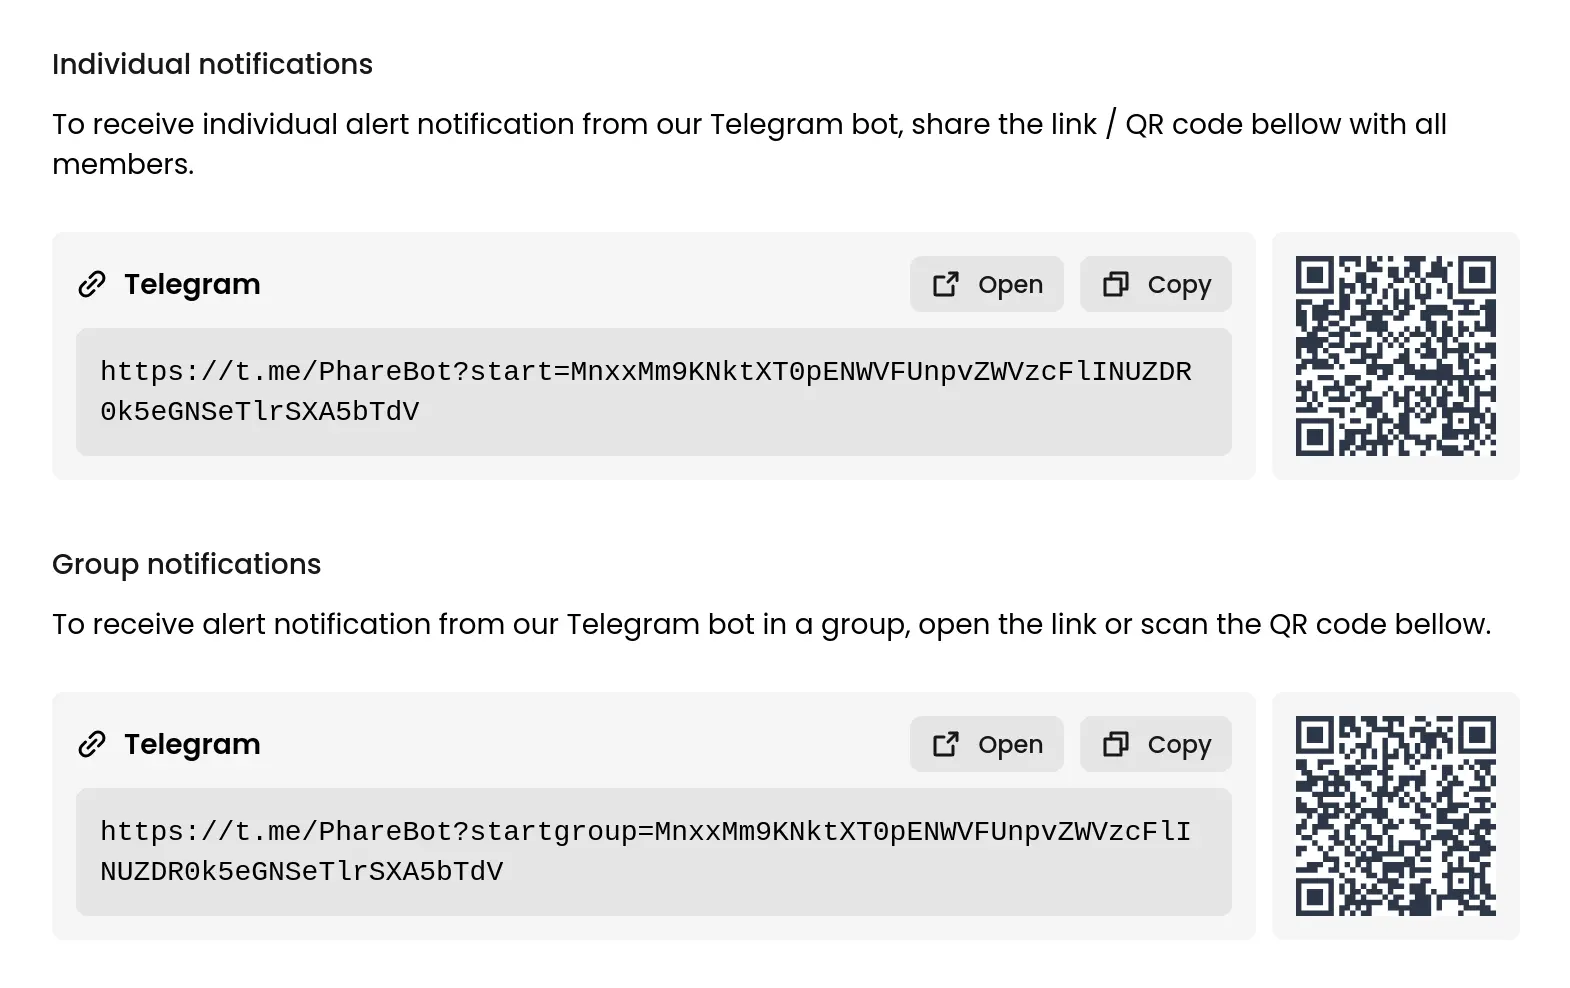 Simply open the link or scan the QR code, then follow the prompts on your device. Once connected, you'll receive a confirmation message from the Phare bot.
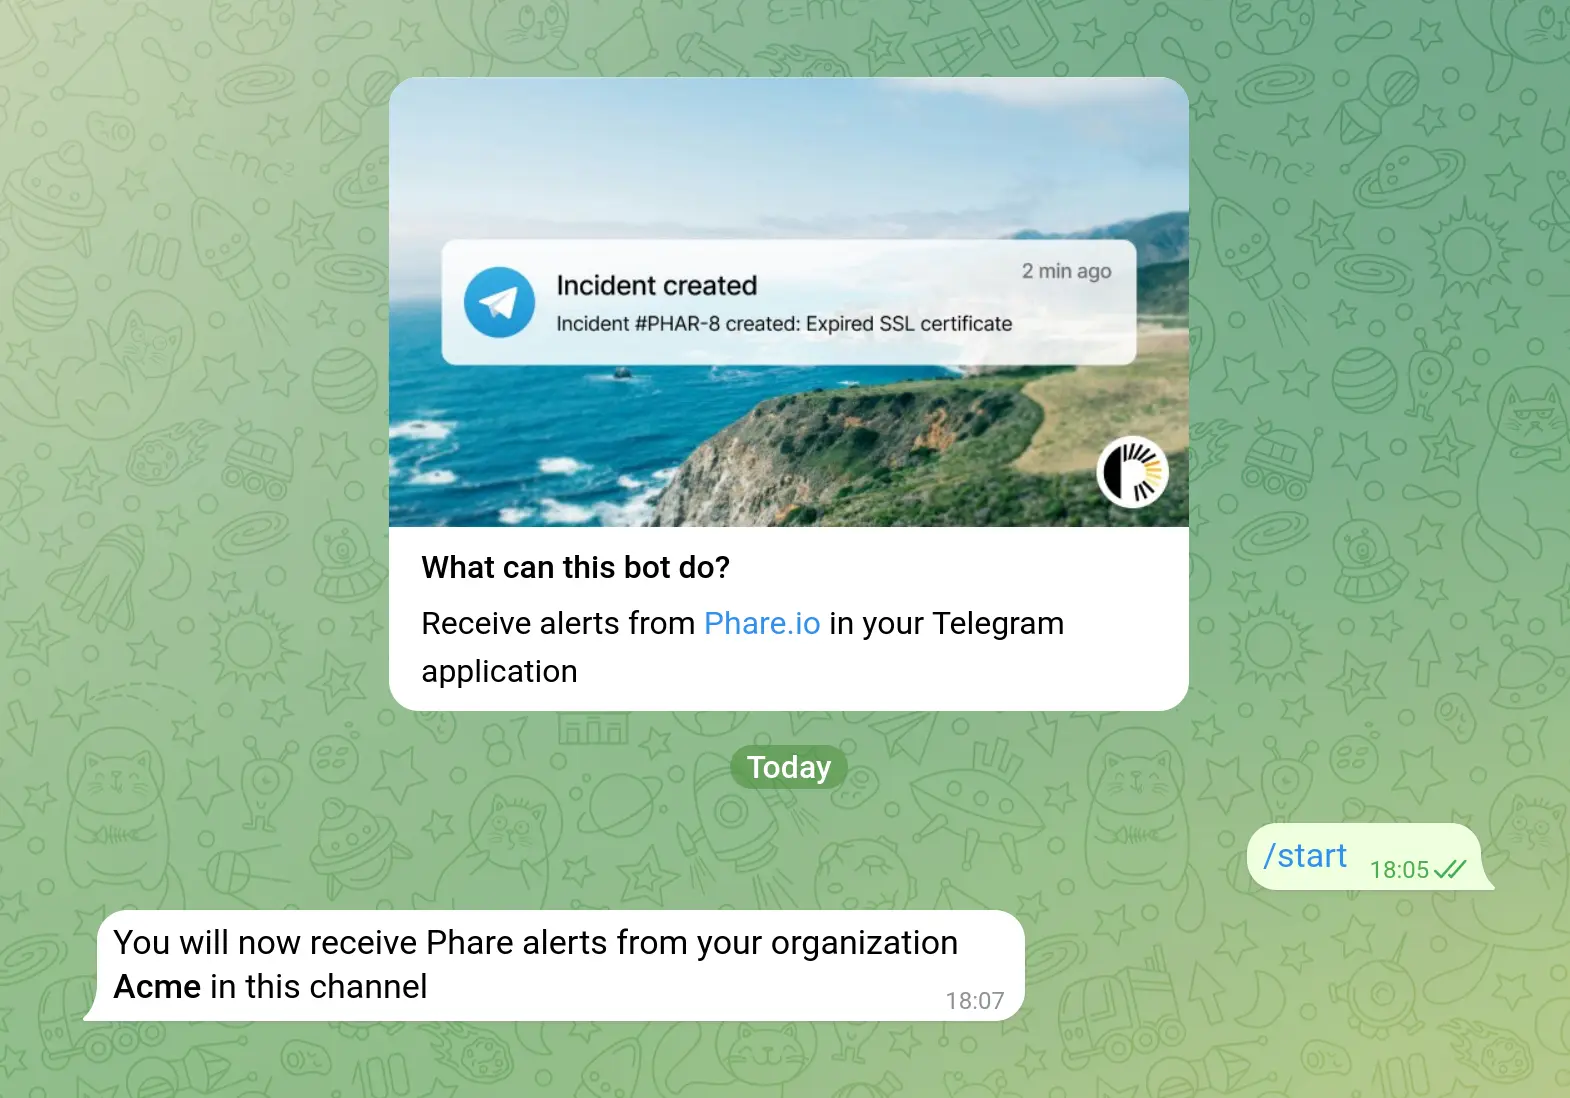 Security note: You can't add the Phare bot by searching for it directly from the Telegram app, you must use our provided links or QR codes. This prevents unauthorized access to your monitoring alerts.
## Usage
That's it! Your Telegram account is now ready to receive Phare alerts. If you ever need to stop receiving notifications, just send the `/stop` command to the Phare bot and delete the conversation.
# Introduction to the Phare Documentation
Source: https://docs.phare.io/introduction
Discover how Phare can help with website and server uptime monitoring, incident management, and much more.
Security note: You can't add the Phare bot by searching for it directly from the Telegram app, you must use our provided links or QR codes. This prevents unauthorized access to your monitoring alerts.
## Usage
That's it! Your Telegram account is now ready to receive Phare alerts. If you ever need to stop receiving notifications, just send the `/stop` command to the Phare bot and delete the conversation.
# Introduction to the Phare Documentation
Source: https://docs.phare.io/introduction
Discover how Phare can help with website and server uptime monitoring, incident management, and much more.
 In this documentation, you'll find everything you need to know about setting up, configuring, and using Phare to its fullest potential. Whether you're an internet veteran or just getting started with making websites, our comprehensive documentation will walk you through every step of the process.
Set up your account in a couple of minutes
Create programmatic interactions with the Phare API
Monitor your websites, manage incidents and create status pages
Seamlessly connect your favorite apps and services with Phare
# Alerting and Alert Rules
Source: https://docs.phare.io/uptime/alerting
Learn how to configure alert rules with Phare Uptime.
Stay in the loop with Phare's real-time notification system. Whether it's a sudden outage, an expiring SSL certificate, or an incident update, the flexible alert rules system ensures the right people get the right information at the right time.
### Alert Rules
Think of alert rules as your notification command center. Each rule defines four key elements:
* **Event**: What triggers the alert (like a monitor failing or a certificate nearing expiration)
* **Scope**: Where the rule applies (organization-wide or just in specific projects)
* **Rate limit**: How often the notification can be sent (preventing notification fatigue)
* **Integration**: Where to send the alert (email, Slack, Discord, etc.)
Additional settings can be configured depending on the event type and integration you choose.
### Event
Phare can alert you of various events, including:
* Monitor created
* Monitor deleted
* Monitor certificate updated
* Monitor certificate expiring
* Incident created
* Incident recovered
* Incident comment created
* Incident update published
You choose which events matter most to your team, and can set up multiple alert rules for a single event type.
### Scope
Keep your alerts relevant by setting the right scope:
* **Organization**: Catch all matching events across your entire organization
* **Project**: Focus only on events within specific projects
This targeted approach ensures nobody gets alerts they don't need to act on.
### Rate Limiting
Too many notifications can lead to alert fatigue. That's why Phare lets you set limits on how frequently a notification can be sent. Even if an event triggers multiple times, you'll only be notified based on your preferred cadence, like at most once every 10 minutes.
### Notification Channels
Connect any [integration](/integrations/overview) to your alert rules to receive notifications through your preferred channels. Create as many alert rules as you need, customizing each one to get the right balance of information without overwhelming your team.
# Certificates Management
Source: https://docs.phare.io/uptime/certificates
Discover how Phare helps you discover, manage and monitor your SSL/TLS certificates.
SSL/TLS certificates are essential for securing your endpoints, Phare makes monitoring and managing them straightforward by automatically detecting and tracking certificates across your websites, APIs and services.
## How certificate discovery works
Phare integrates certificate discovery directly into the monitoring system for any HTTPS or TCP with TLS connection endpoints.
* Certificates are automatically detected when Phare monitors your endpoints
* Multiple certificates per monitor are properly tracked and managed
* Certificates are linked to all relevant monitors
* New certificates are identified and added to your inventory as they appear
## Certificate monitoring
Keep track of your SSL/TLS certificates with these helpful features:
* **Automatic notifications** when new certificates are discovered on your domains
* **Customizable expiration alerts** that can be set anywhere from 1 to 60 days before expiry
* **Complete certificate inventory** showing both active and historical certificates
* **Detailed certificate information** including issuer, validity period, and domain coverage
## Preventing Certificate Expiration Issues
With Phare's certificate monitoring, you can avoid the security warnings and outages that occur when certificates expire unexpectedly. Set up your preferred notification schedule, to get reminded when it's time to renew, or when certbot failed to renew your certificates.
# Incident Management
Source: https://docs.phare.io/uptime/incidents
Learn how to manage the lifecycle of an incident with Phare Uptime incident management.
When things go wrong, having a clear process makes all the difference. Phare's incident management system takes care of the entire incident lifecycle automatically, from the moment a problem is detected to when everything's back to normal.
## Programmatic incidents
When a monitor detects trouble (respecting your confirmation settings and any keyword/SSL checks), Phare springs into action by creating an incident. Each incident is automatically linked to the affected monitor and includes detailed information about what went wrong. Right away, your team gets notified through your configured alert rules, no manual intervention required.
Programmatic incidents track the entire lifecycle from detection through resolution, giving you a complete picture of what happened during the outage.
## Manual incidents
Sometimes you need to create an incident even when your monitors haven't detected a problem. Perhaps a customer reported an issue with a service you're not actively monitoring, or you want to proactively communicate about planned maintenance.
Phare makes it easy to create incidents manually:
1. Select the affected monitor(s)
2. Set the impact level
3. Add a descriptive title
4. Include details about the situation
Manual incidents follow the same lifecycle as programmatic ones, but you'll need to resolve them manually when the issue is fixed. This gives you full control over the incident's duration and communication timeline.
Manual incidents are especially useful for planned maintenance, allowing you to notify users in advance about expected downtime and keep them updated throughout the process.
## Incident recovery
When your service recovers (again, respecting your recovery confirmation settings), Phare automatically resolves the incident and lets your team know through your alert rules.
## Impact
Not all incidents are created equal. That's why Phare lets your team classify incidents by their impact level:
* **Unknown**: Still investigating, not sure how bad it is
* **Operational**: False alarm—everything's working as expected
* **Maintenance**: Planned downtime for heavy-duty updates
* **Degraded performance**: Things are slower / working less well than usual
* **Partial outage**: Some users are affected or certain features are down
* **Major outage**: Everything is on fire, users can't access the service or are severely impacted
Impact levels help your team prioritize responses internally and keep users informed through status pages. If left as "unknown," status pages will simply show the monitor as "down" without additional details.
## Event timeline
In this documentation, you'll find everything you need to know about setting up, configuring, and using Phare to its fullest potential. Whether you're an internet veteran or just getting started with making websites, our comprehensive documentation will walk you through every step of the process.
Set up your account in a couple of minutes
Create programmatic interactions with the Phare API
Monitor your websites, manage incidents and create status pages
Seamlessly connect your favorite apps and services with Phare
# Alerting and Alert Rules
Source: https://docs.phare.io/uptime/alerting
Learn how to configure alert rules with Phare Uptime.
Stay in the loop with Phare's real-time notification system. Whether it's a sudden outage, an expiring SSL certificate, or an incident update, the flexible alert rules system ensures the right people get the right information at the right time.
### Alert Rules
Think of alert rules as your notification command center. Each rule defines four key elements:
* **Event**: What triggers the alert (like a monitor failing or a certificate nearing expiration)
* **Scope**: Where the rule applies (organization-wide or just in specific projects)
* **Rate limit**: How often the notification can be sent (preventing notification fatigue)
* **Integration**: Where to send the alert (email, Slack, Discord, etc.)
Additional settings can be configured depending on the event type and integration you choose.
### Event
Phare can alert you of various events, including:
* Monitor created
* Monitor deleted
* Monitor certificate updated
* Monitor certificate expiring
* Incident created
* Incident recovered
* Incident comment created
* Incident update published
You choose which events matter most to your team, and can set up multiple alert rules for a single event type.
### Scope
Keep your alerts relevant by setting the right scope:
* **Organization**: Catch all matching events across your entire organization
* **Project**: Focus only on events within specific projects
This targeted approach ensures nobody gets alerts they don't need to act on.
### Rate Limiting
Too many notifications can lead to alert fatigue. That's why Phare lets you set limits on how frequently a notification can be sent. Even if an event triggers multiple times, you'll only be notified based on your preferred cadence, like at most once every 10 minutes.
### Notification Channels
Connect any [integration](/integrations/overview) to your alert rules to receive notifications through your preferred channels. Create as many alert rules as you need, customizing each one to get the right balance of information without overwhelming your team.
# Certificates Management
Source: https://docs.phare.io/uptime/certificates
Discover how Phare helps you discover, manage and monitor your SSL/TLS certificates.
SSL/TLS certificates are essential for securing your endpoints, Phare makes monitoring and managing them straightforward by automatically detecting and tracking certificates across your websites, APIs and services.
## How certificate discovery works
Phare integrates certificate discovery directly into the monitoring system for any HTTPS or TCP with TLS connection endpoints.
* Certificates are automatically detected when Phare monitors your endpoints
* Multiple certificates per monitor are properly tracked and managed
* Certificates are linked to all relevant monitors
* New certificates are identified and added to your inventory as they appear
## Certificate monitoring
Keep track of your SSL/TLS certificates with these helpful features:
* **Automatic notifications** when new certificates are discovered on your domains
* **Customizable expiration alerts** that can be set anywhere from 1 to 60 days before expiry
* **Complete certificate inventory** showing both active and historical certificates
* **Detailed certificate information** including issuer, validity period, and domain coverage
## Preventing Certificate Expiration Issues
With Phare's certificate monitoring, you can avoid the security warnings and outages that occur when certificates expire unexpectedly. Set up your preferred notification schedule, to get reminded when it's time to renew, or when certbot failed to renew your certificates.
# Incident Management
Source: https://docs.phare.io/uptime/incidents
Learn how to manage the lifecycle of an incident with Phare Uptime incident management.
When things go wrong, having a clear process makes all the difference. Phare's incident management system takes care of the entire incident lifecycle automatically, from the moment a problem is detected to when everything's back to normal.
## Programmatic incidents
When a monitor detects trouble (respecting your confirmation settings and any keyword/SSL checks), Phare springs into action by creating an incident. Each incident is automatically linked to the affected monitor and includes detailed information about what went wrong. Right away, your team gets notified through your configured alert rules, no manual intervention required.
Programmatic incidents track the entire lifecycle from detection through resolution, giving you a complete picture of what happened during the outage.
## Manual incidents
Sometimes you need to create an incident even when your monitors haven't detected a problem. Perhaps a customer reported an issue with a service you're not actively monitoring, or you want to proactively communicate about planned maintenance.
Phare makes it easy to create incidents manually:
1. Select the affected monitor(s)
2. Set the impact level
3. Add a descriptive title
4. Include details about the situation
Manual incidents follow the same lifecycle as programmatic ones, but you'll need to resolve them manually when the issue is fixed. This gives you full control over the incident's duration and communication timeline.
Manual incidents are especially useful for planned maintenance, allowing you to notify users in advance about expected downtime and keep them updated throughout the process.
## Incident recovery
When your service recovers (again, respecting your recovery confirmation settings), Phare automatically resolves the incident and lets your team know through your alert rules.
## Impact
Not all incidents are created equal. That's why Phare lets your team classify incidents by their impact level:
* **Unknown**: Still investigating, not sure how bad it is
* **Operational**: False alarm—everything's working as expected
* **Maintenance**: Planned downtime for heavy-duty updates
* **Degraded performance**: Things are slower / working less well than usual
* **Partial outage**: Some users are affected or certain features are down
* **Major outage**: Everything is on fire, users can't access the service or are severely impacted
Impact levels help your team prioritize responses internally and keep users informed through status pages. If left as "unknown," status pages will simply show the monitor as "down" without additional details.
## Event timeline
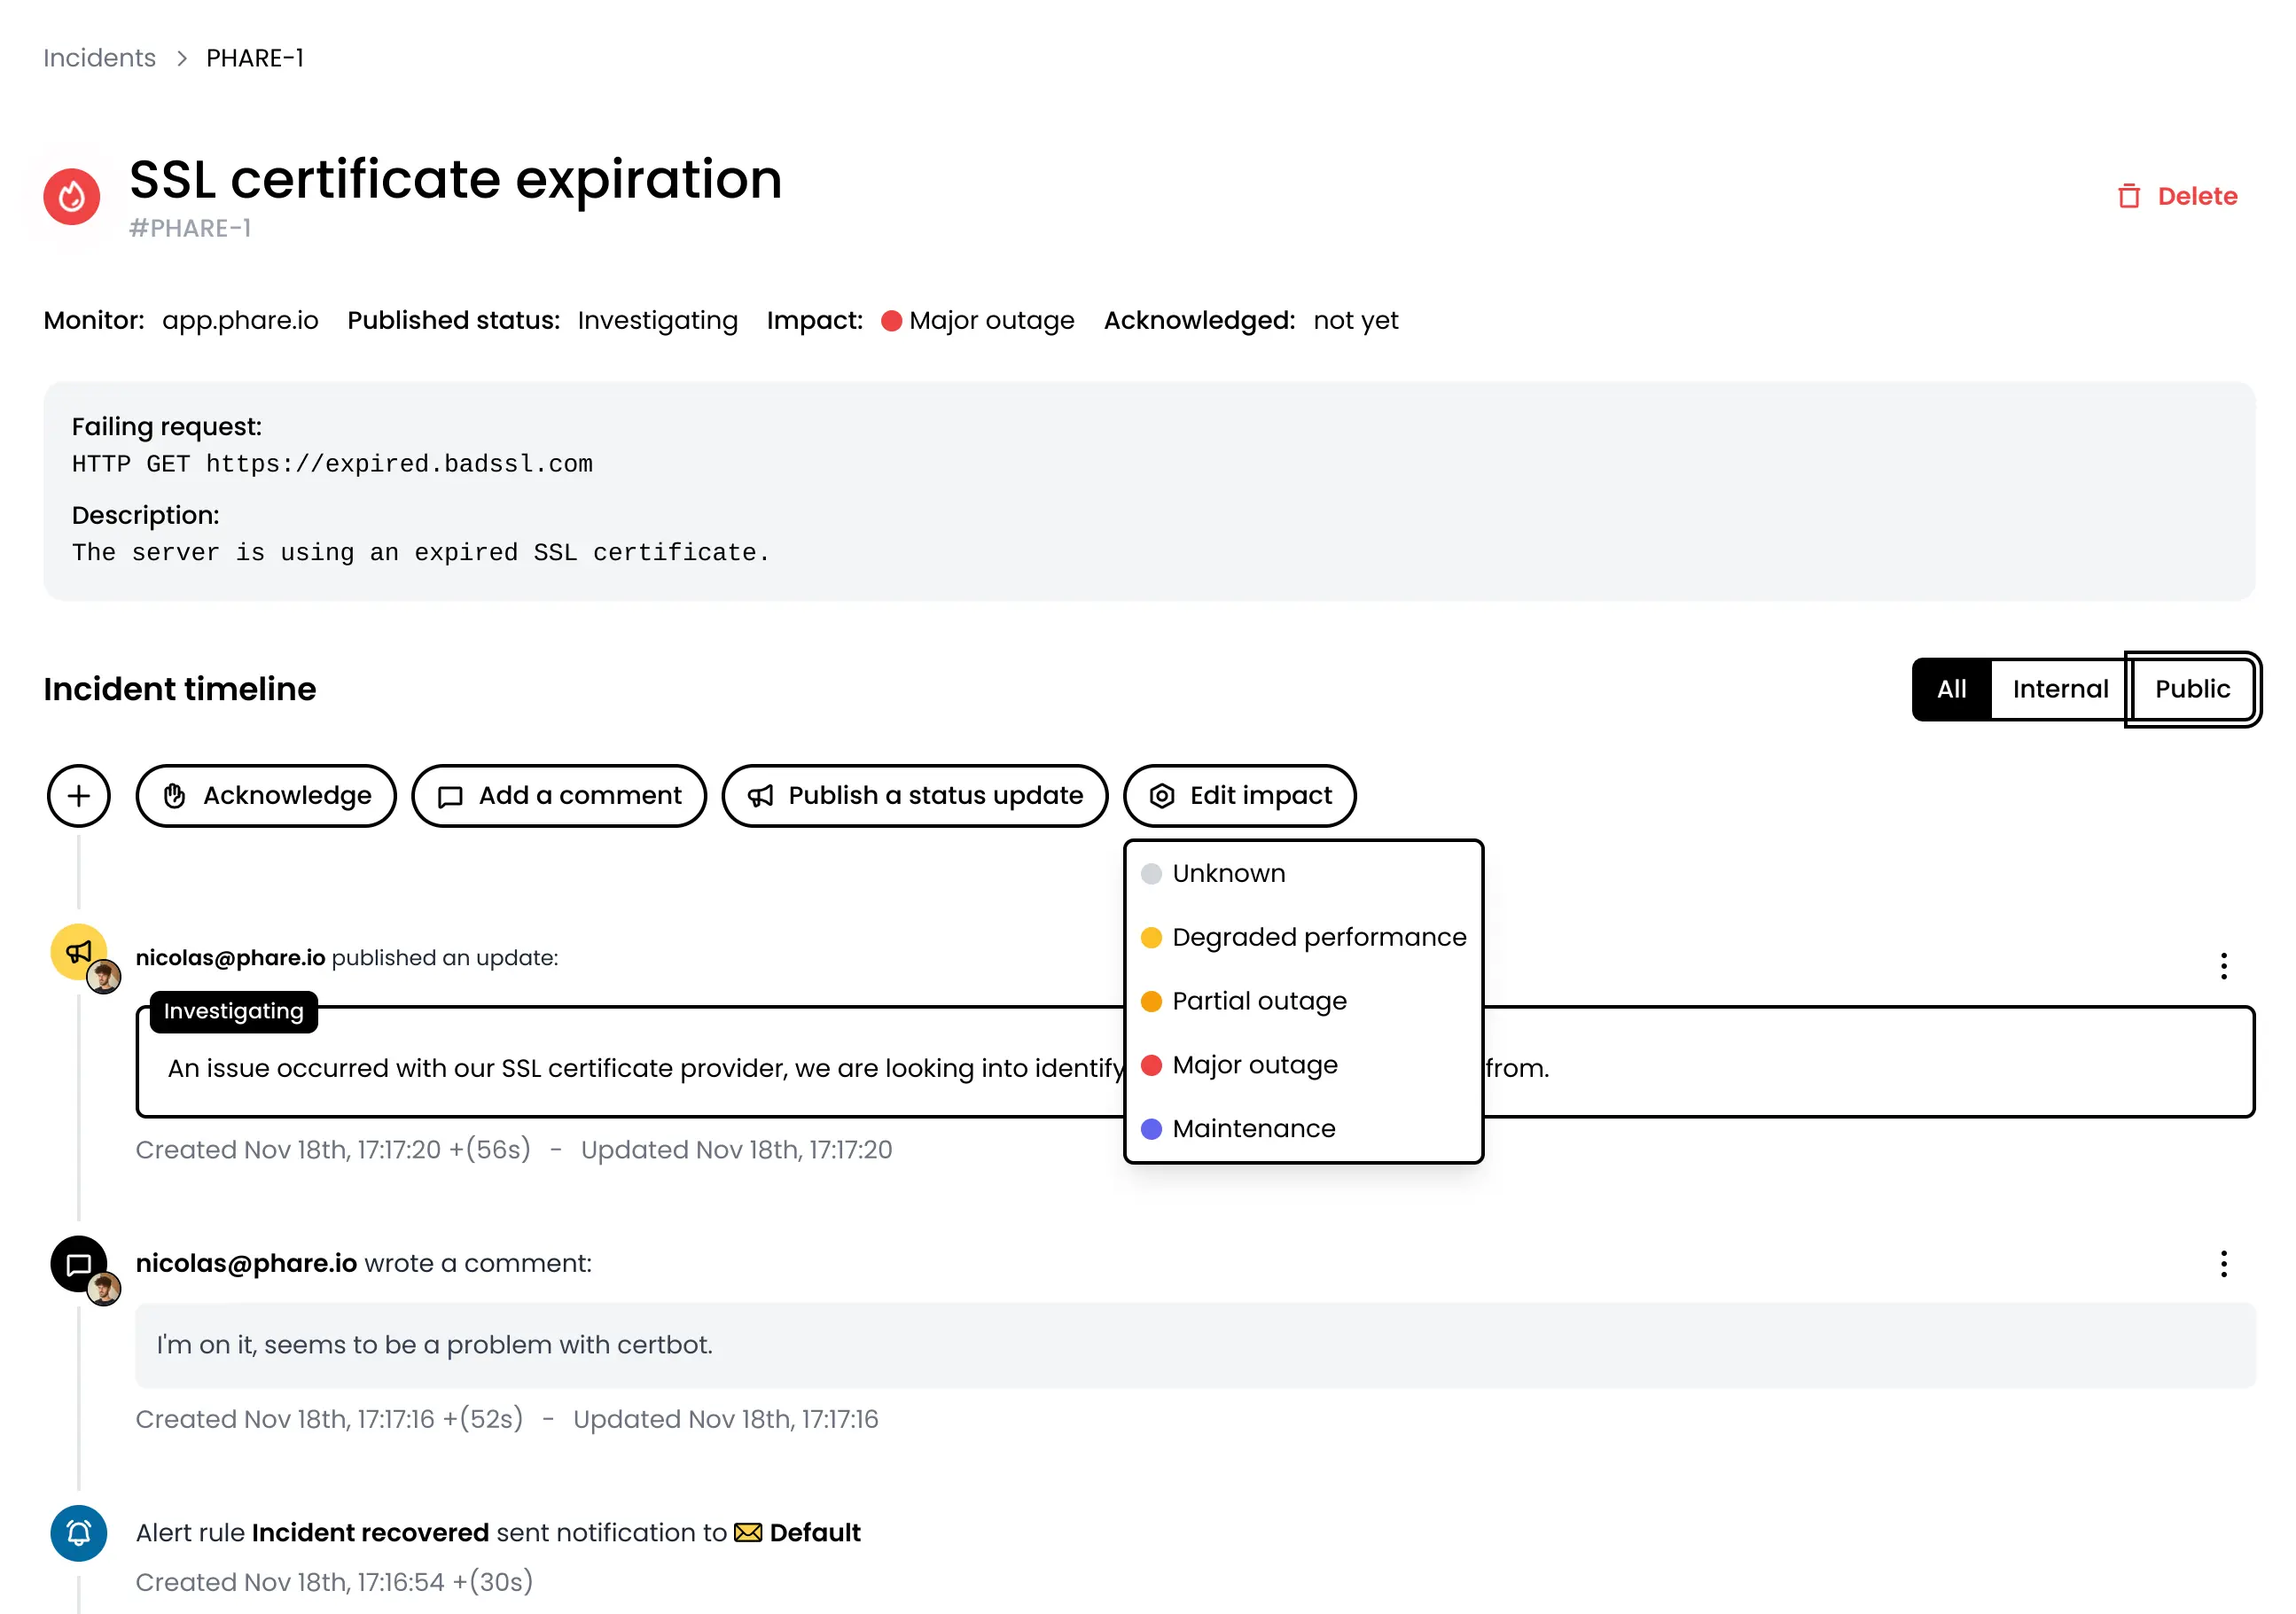 The event timeline gives you the full picture of what happened during an incident. You can see every region status, which alert rules fired, and follow the incident's progression from start to finish. This chronological view helps with post-incident analysis and improves future response procedures.
## Incident comments
Team members can add private comments to share insights or document solutions, helping everyone resolve issues faster. These internal notes are perfect for:
* Documenting troubleshooting steps
* Sharing relevant links to logs or dashboards
* Coordinating response efforts between team members
* Recording root cause analysis findings
The rich text editor supports Markdown, making it easy to include formatted text, code snippets, or links to relevant resources. Comments are only visible to your team members and never appear on public status pages.
Each comment is timestamped and attributed to its author, creating a clear record of who did what during incident response.
## Incident updates
The event timeline gives you the full picture of what happened during an incident. You can see every region status, which alert rules fired, and follow the incident's progression from start to finish. This chronological view helps with post-incident analysis and improves future response procedures.
## Incident comments
Team members can add private comments to share insights or document solutions, helping everyone resolve issues faster. These internal notes are perfect for:
* Documenting troubleshooting steps
* Sharing relevant links to logs or dashboards
* Coordinating response efforts between team members
* Recording root cause analysis findings
The rich text editor supports Markdown, making it easy to include formatted text, code snippets, or links to relevant resources. Comments are only visible to your team members and never appear on public status pages.
Each comment is timestamped and attributed to its author, creating a clear record of who did what during incident response.
## Incident updates
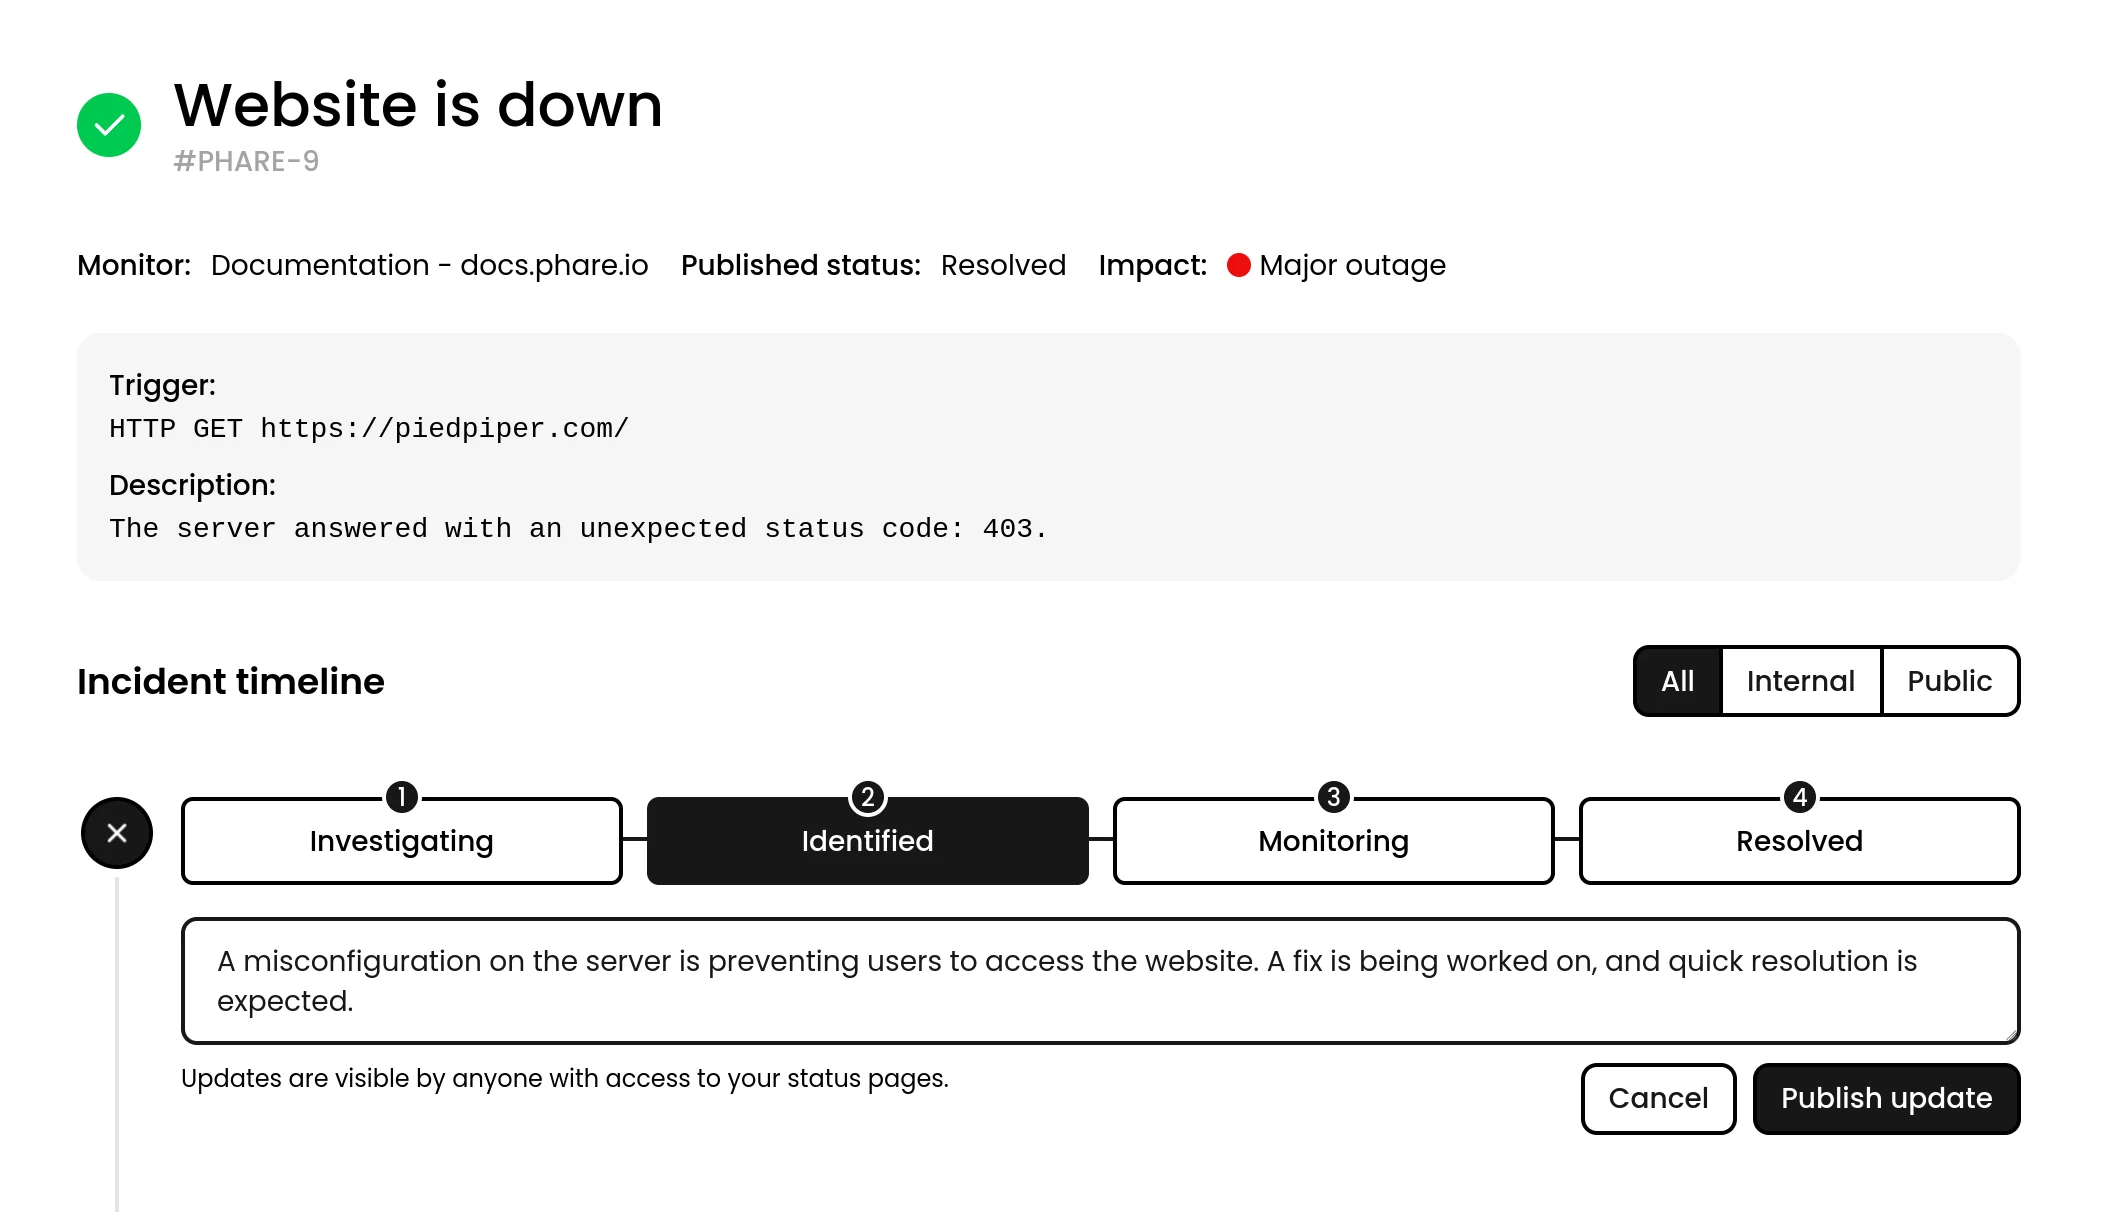 While comments help your team collaborate privately, incident updates are designed for external communication. These updates allow you to keep your users informed about:
* What's happening with the incident
* What you're doing to fix it
* When they can expect resolution
* Workarounds they can use in the meantime
Each update allow you to communicate progress as you mitigate the issue, and automatically published to your connected status pages, helping maintain transparency with your users during outages.
Consistent, clear communication during incidents builds trust with your users, they'll appreciate knowing you're on top of the situation even when things aren't working perfectly.
# Monitors
Source: https://docs.phare.io/uptime/monitors
Monitor the availability of your websites, APIs and servers.
Monitors are the backbone of Phare Uptime, they're your tireless digital assistants checking if your website or server is alive and kicking. Set them up once, and they'll dutifully perform HTTP(S) and TCP checks according to your schedule.
### HTTP(s)
When monitoring websites, Phare sends HTTP(s) requests and checks both the status code and (optionally) looks for specific text in the response. If HTTPS is used, Phare automatically keeps an eye on your SSL certificates too, making sure they're valid and well configured.
You can find more details about the [HTTP(s) monitoring settings](#configuration-options-for-https) below.
### TCP
For services beyond websites, TCP monitoring establishes a direct connection to your server port to make sure everything's responding correctly. Phare currently supports plain and TLS connections.
## Interval
You decide how often Phare checks on your endpoints. The default is every minute, but you can adjust the frequency to suit your needs, anything between a quick 30 seconds or a relaxed 1 hour.
## Confirmations & recovery
Nobody likes false alarms. That's why Phare allows double-checks, or more, before creating an incident. A service is only marked as down (or recovered) after a configurable number of consecutive failures (or successes). The default is two confirmations, but you can set this anywhere from one (immediate alerts) to five checks.
## Regions
With 11 monitoring regions worldwide, Phare lets you check your services from different parts of the globe. **It is strongly recommended to use at least two regions**, this helps avoid false positives and keeps your monitoring resilient even if one region experiences issues.
## Alert Rules
Phare's alert rules system allows you to decide which events trigger notifications. There are a few alert events that can be raised by monitors, you can find the full list in the [alerting documentation](/uptime/alerting).
## Configuration options for HTTP(s)
### Method
When creating HTTP monitors, you can choose which method to use for your requests. Phare currently supports:
* **HEAD**: Ideal for quick availability checks. Retrieves only headers, saving bandwidth and processing time, perfect for frequent checks on large websites.
* **GET**: The standard choice for most monitoring. Gets the full page content, allowing you to verify text content and properly test APIs content or websites that do not support HEAD requests.
* **OPTIONS**: Useful for checking API configuration and CORS policies without triggering data changes. Great for testing API availability without actually using it.
### User agent
Every HTTP request from Phare carries the following user-agent signature:
> `Mozilla/5.0 (compatible; Phare/1.0; +https://phare.io/products/uptime)`
If you added a `secret-value` to the user agent header for firewall filtering, it will look like this:
> `Mozilla/5.0 (compatible; Phare/1.0; +https://phare.io/products/uptime; Secret=secret-value)`
### Headers
Need to get past authentication or test an API with specific requirements? Phare lets you add custom headers to your HTTP monitors. This feature opens up possibilities for:
* Testing APIs with authorization tokens
* Bypassing basic authentication on staging environments
* Setting content negotiation preferences
* Adding custom tracking identifiers
To prevent abuse, it is not possible to set a custom user agent headers, with the exception of adding a secret value for firewall filtering.
## Suggestions
While comments help your team collaborate privately, incident updates are designed for external communication. These updates allow you to keep your users informed about:
* What's happening with the incident
* What you're doing to fix it
* When they can expect resolution
* Workarounds they can use in the meantime
Each update allow you to communicate progress as you mitigate the issue, and automatically published to your connected status pages, helping maintain transparency with your users during outages.
Consistent, clear communication during incidents builds trust with your users, they'll appreciate knowing you're on top of the situation even when things aren't working perfectly.
# Monitors
Source: https://docs.phare.io/uptime/monitors
Monitor the availability of your websites, APIs and servers.
Monitors are the backbone of Phare Uptime, they're your tireless digital assistants checking if your website or server is alive and kicking. Set them up once, and they'll dutifully perform HTTP(S) and TCP checks according to your schedule.
### HTTP(s)
When monitoring websites, Phare sends HTTP(s) requests and checks both the status code and (optionally) looks for specific text in the response. If HTTPS is used, Phare automatically keeps an eye on your SSL certificates too, making sure they're valid and well configured.
You can find more details about the [HTTP(s) monitoring settings](#configuration-options-for-https) below.
### TCP
For services beyond websites, TCP monitoring establishes a direct connection to your server port to make sure everything's responding correctly. Phare currently supports plain and TLS connections.
## Interval
You decide how often Phare checks on your endpoints. The default is every minute, but you can adjust the frequency to suit your needs, anything between a quick 30 seconds or a relaxed 1 hour.
## Confirmations & recovery
Nobody likes false alarms. That's why Phare allows double-checks, or more, before creating an incident. A service is only marked as down (or recovered) after a configurable number of consecutive failures (or successes). The default is two confirmations, but you can set this anywhere from one (immediate alerts) to five checks.
## Regions
With 11 monitoring regions worldwide, Phare lets you check your services from different parts of the globe. **It is strongly recommended to use at least two regions**, this helps avoid false positives and keeps your monitoring resilient even if one region experiences issues.
## Alert Rules
Phare's alert rules system allows you to decide which events trigger notifications. There are a few alert events that can be raised by monitors, you can find the full list in the [alerting documentation](/uptime/alerting).
## Configuration options for HTTP(s)
### Method
When creating HTTP monitors, you can choose which method to use for your requests. Phare currently supports:
* **HEAD**: Ideal for quick availability checks. Retrieves only headers, saving bandwidth and processing time, perfect for frequent checks on large websites.
* **GET**: The standard choice for most monitoring. Gets the full page content, allowing you to verify text content and properly test APIs content or websites that do not support HEAD requests.
* **OPTIONS**: Useful for checking API configuration and CORS policies without triggering data changes. Great for testing API availability without actually using it.
### User agent
Every HTTP request from Phare carries the following user-agent signature:
> `Mozilla/5.0 (compatible; Phare/1.0; +https://phare.io/products/uptime)`
If you added a `secret-value` to the user agent header for firewall filtering, it will look like this:
> `Mozilla/5.0 (compatible; Phare/1.0; +https://phare.io/products/uptime; Secret=secret-value)`
### Headers
Need to get past authentication or test an API with specific requirements? Phare lets you add custom headers to your HTTP monitors. This feature opens up possibilities for:
* Testing APIs with authorization tokens
* Bypassing basic authentication on staging environments
* Setting content negotiation preferences
* Adding custom tracking identifiers
To prevent abuse, it is not possible to set a custom user agent headers, with the exception of adding a secret value for firewall filtering.
## Suggestions
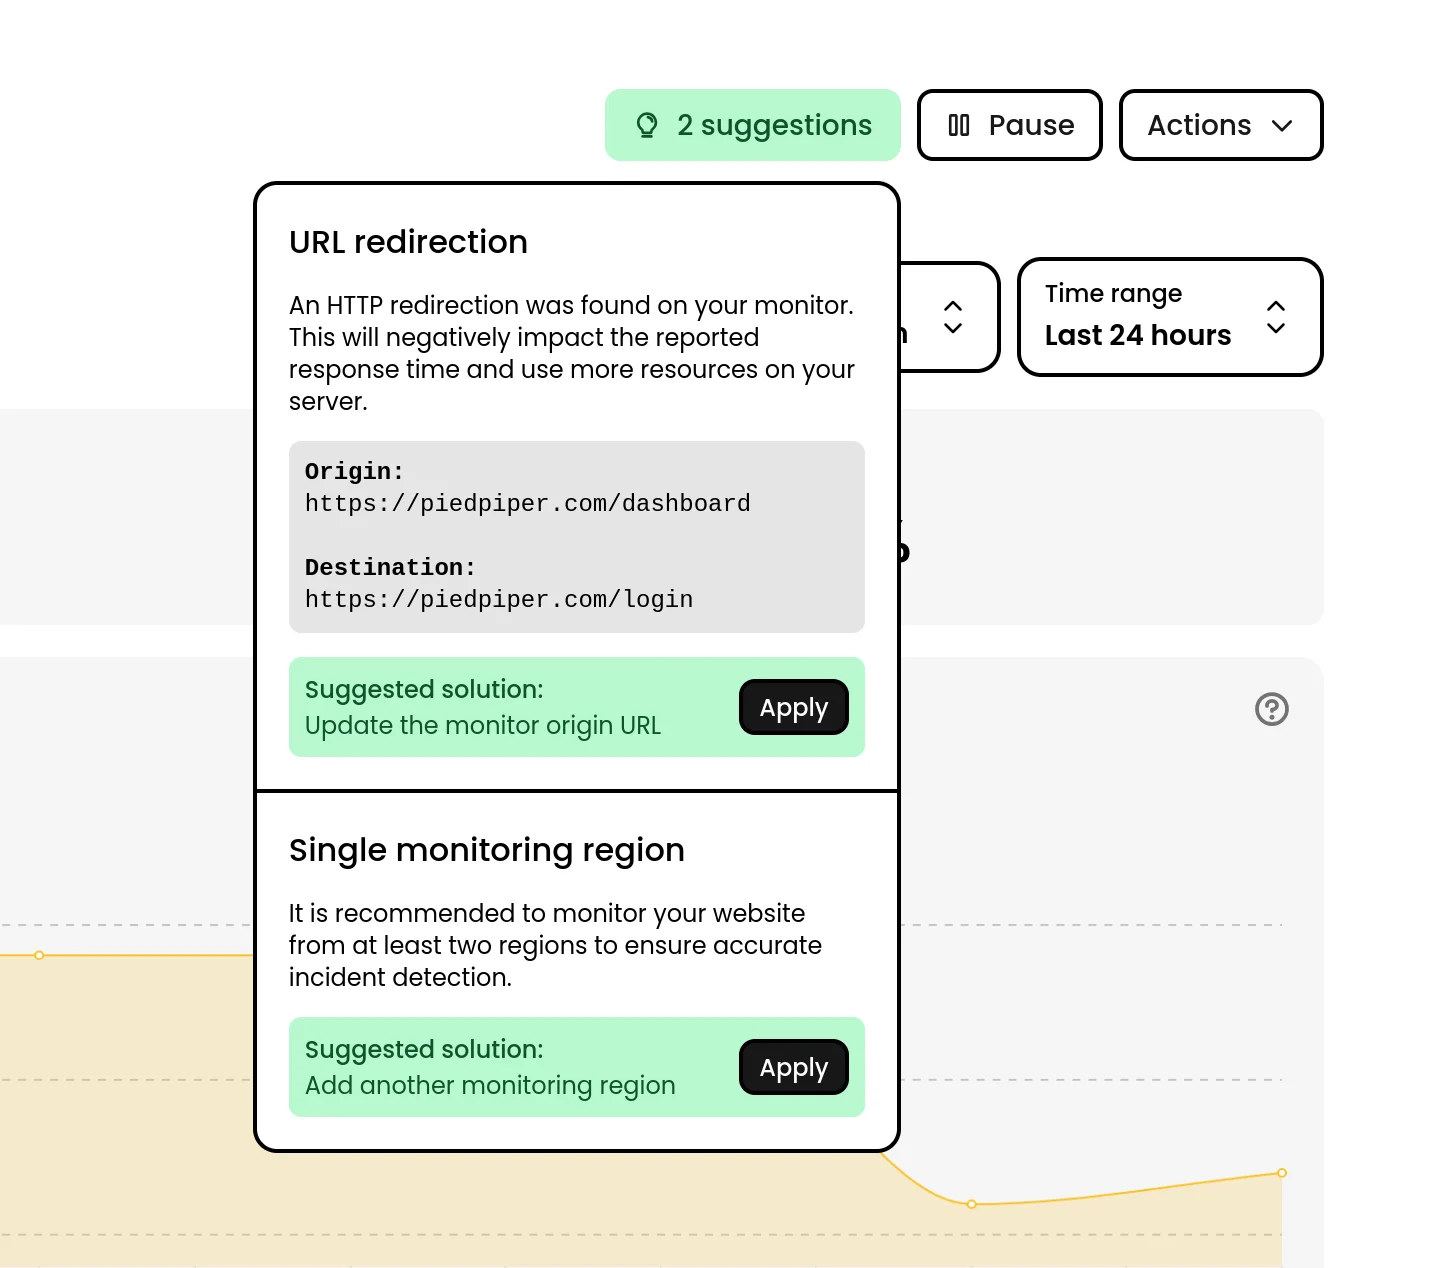 As you set up your monitors, Phare's suggestion system analyzes your configuration and offers improvements to boost reliability, and reduce false positives:
* Adding more monitoring regions for better global coverage
* Increasing confirmation counts to prevent false positives
* Alerting you to redirections that might impact performance reporting
* Recommending more frequent checks for critical services
## Statistics
As you set up your monitors, Phare's suggestion system analyzes your configuration and offers improvements to boost reliability, and reduce false positives:
* Adding more monitoring regions for better global coverage
* Increasing confirmation counts to prevent false positives
* Alerting you to redirections that might impact performance reporting
* Recommending more frequent checks for critical services
## Statistics
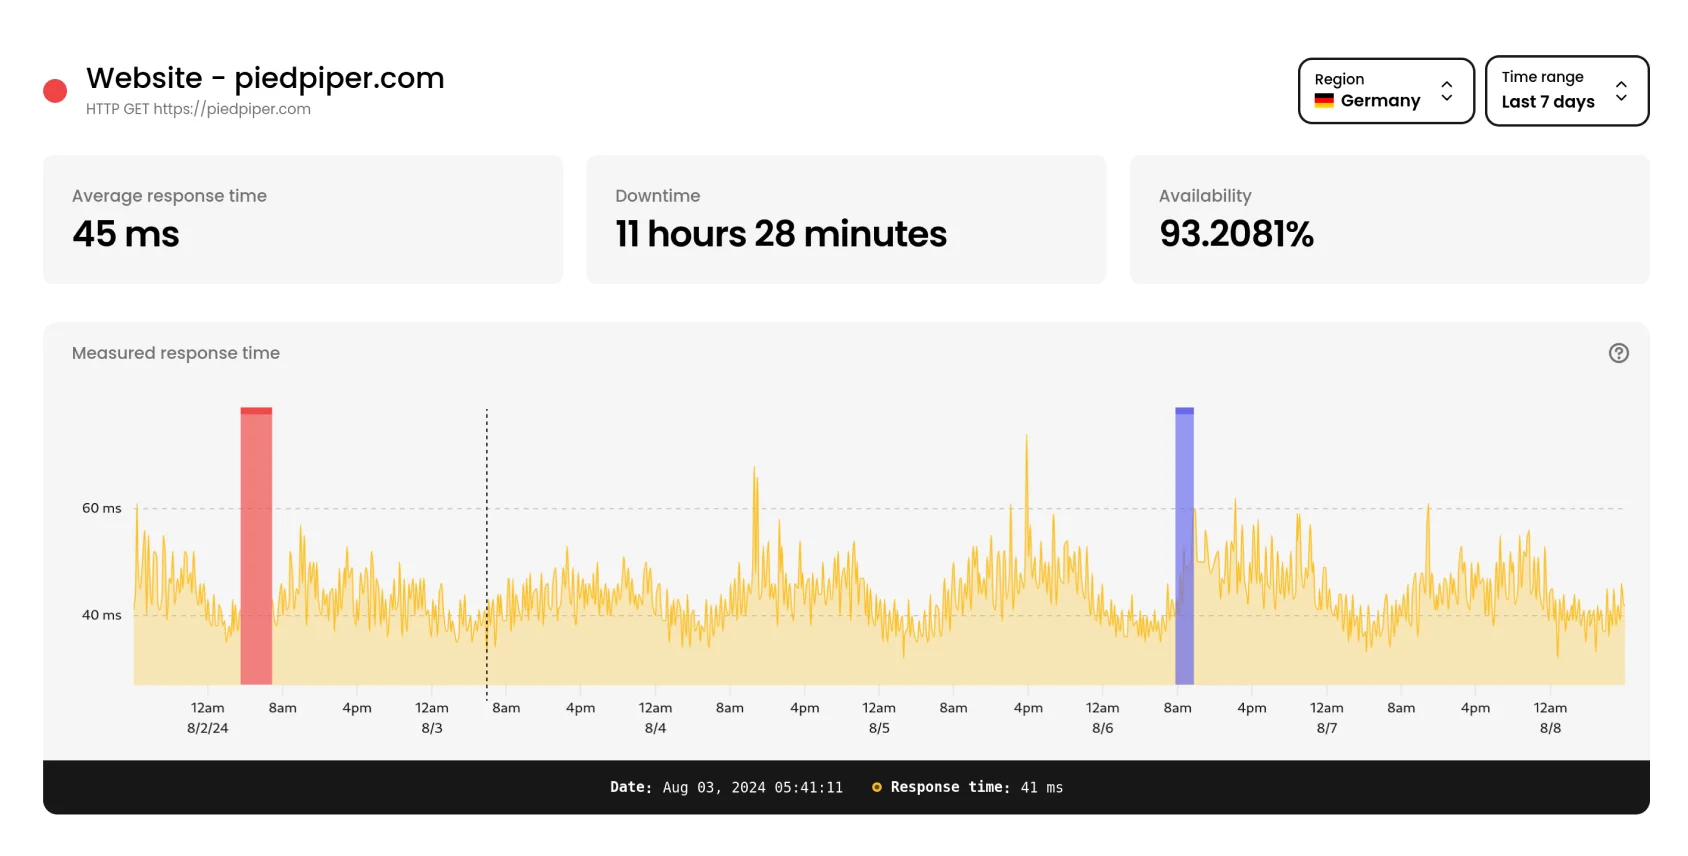 Each monitor will show detailed statistics to help you understand your service performance at a glance:
* **Performance charts** appear shortly after creating a monitor, showing response time trends
* View the performance data by region to spot geographical performance variations
* Zoom in on specific timeframes by clicking and dragging to select portions of the chart
* Track key metrics including average response time, total downtime, and SLA percentages
* Historical data from 24 hours up to 90 days lets you spot both immediate issues and long-term trends
Be aware that charts are rendered leveraging [downsampling techniques](https://phare.io/blog/downsampling-time-series-data/) to present meaningful visualizations without overwhelming your browser. This is why you won't see every single data point on the chart.
## Firewall protection
IP filtering is not reliable as the Phare Uptime monitoring agent is deployed on [Bunny.net's global network](https://bunnycdn.com/api/system/edgeserverlist), meaning that IPs could be shared with other Bunny.net customers.
The easiest way to filter the Phare Uptime monitoring agent is to use the `User-Agent` header. You can also add a secret value to the user agent to make it unique to your organization.
Need something more robust? [Contact support](https://phare.io/contact).
## Private monitoring agent
Need specialized monitoring for complex requirements, large-scale operations, or access through private VPNs? A private monitoring agent can be setup in your preferred region.
[Let's talk](https://phare.io/contact) about your specific needs.
## Good practices
If you're unsure about the best settings for your monitoring needs, you can find the [Best practices to configure an uptime monitoring service](https://phare.io/blog/best-practices-to-configure-an-uptime-monitoring-service/) on the Phare blog.
## Limits
Phare's monitoring infrastructure operates at an impressive scale, but comes with a few constraints:
* **No IP filtering**: The monitoring agent uses Bunny.net's shared IP range, making IP filtering unreliable.
* **Certain ports restricted**: TCP monitoring doesn't support ports 25, 465, 587, and 2525.
If these limitations are showstoppers for you, [reach out](https://phare.io/contact) to discuss alternatives.
# Overview of Phare Uptime
Source: https://docs.phare.io/uptime/overview
Monitor your websites, manage incidents and create status pages
Phare Uptime is your digital babysitter that keeps an eye on your websites and APIs 24/7. Alerting you if anything goes wrong, before your users start complaining.
## Uptime Monitoring
Think of uptime monitoring as your website's health checkup. Phare regularly visits your website or API, checks its vital signs, and lets you know if something looks off.
[Learn more about uptime monitoring](/uptime/monitors).
## Incident Management
When things go sideways, you need a system to track what happened, who's fixing it, and when it's resolved. Phare's incident management gives you the tools to handle the entire lifecycle, from "oh no!" to "all good!"
[Learn more about incident management](/uptime/incidents).
Each monitor will show detailed statistics to help you understand your service performance at a glance:
* **Performance charts** appear shortly after creating a monitor, showing response time trends
* View the performance data by region to spot geographical performance variations
* Zoom in on specific timeframes by clicking and dragging to select portions of the chart
* Track key metrics including average response time, total downtime, and SLA percentages
* Historical data from 24 hours up to 90 days lets you spot both immediate issues and long-term trends
Be aware that charts are rendered leveraging [downsampling techniques](https://phare.io/blog/downsampling-time-series-data/) to present meaningful visualizations without overwhelming your browser. This is why you won't see every single data point on the chart.
## Firewall protection
IP filtering is not reliable as the Phare Uptime monitoring agent is deployed on [Bunny.net's global network](https://bunnycdn.com/api/system/edgeserverlist), meaning that IPs could be shared with other Bunny.net customers.
The easiest way to filter the Phare Uptime monitoring agent is to use the `User-Agent` header. You can also add a secret value to the user agent to make it unique to your organization.
Need something more robust? [Contact support](https://phare.io/contact).
## Private monitoring agent
Need specialized monitoring for complex requirements, large-scale operations, or access through private VPNs? A private monitoring agent can be setup in your preferred region.
[Let's talk](https://phare.io/contact) about your specific needs.
## Good practices
If you're unsure about the best settings for your monitoring needs, you can find the [Best practices to configure an uptime monitoring service](https://phare.io/blog/best-practices-to-configure-an-uptime-monitoring-service/) on the Phare blog.
## Limits
Phare's monitoring infrastructure operates at an impressive scale, but comes with a few constraints:
* **No IP filtering**: The monitoring agent uses Bunny.net's shared IP range, making IP filtering unreliable.
* **Certain ports restricted**: TCP monitoring doesn't support ports 25, 465, 587, and 2525.
If these limitations are showstoppers for you, [reach out](https://phare.io/contact) to discuss alternatives.
# Overview of Phare Uptime
Source: https://docs.phare.io/uptime/overview
Monitor your websites, manage incidents and create status pages
Phare Uptime is your digital babysitter that keeps an eye on your websites and APIs 24/7. Alerting you if anything goes wrong, before your users start complaining.
## Uptime Monitoring
Think of uptime monitoring as your website's health checkup. Phare regularly visits your website or API, checks its vital signs, and lets you know if something looks off.
[Learn more about uptime monitoring](/uptime/monitors).
## Incident Management
When things go sideways, you need a system to track what happened, who's fixing it, and when it's resolved. Phare's incident management gives you the tools to handle the entire lifecycle, from "oh no!" to "all good!"
[Learn more about incident management](/uptime/incidents).
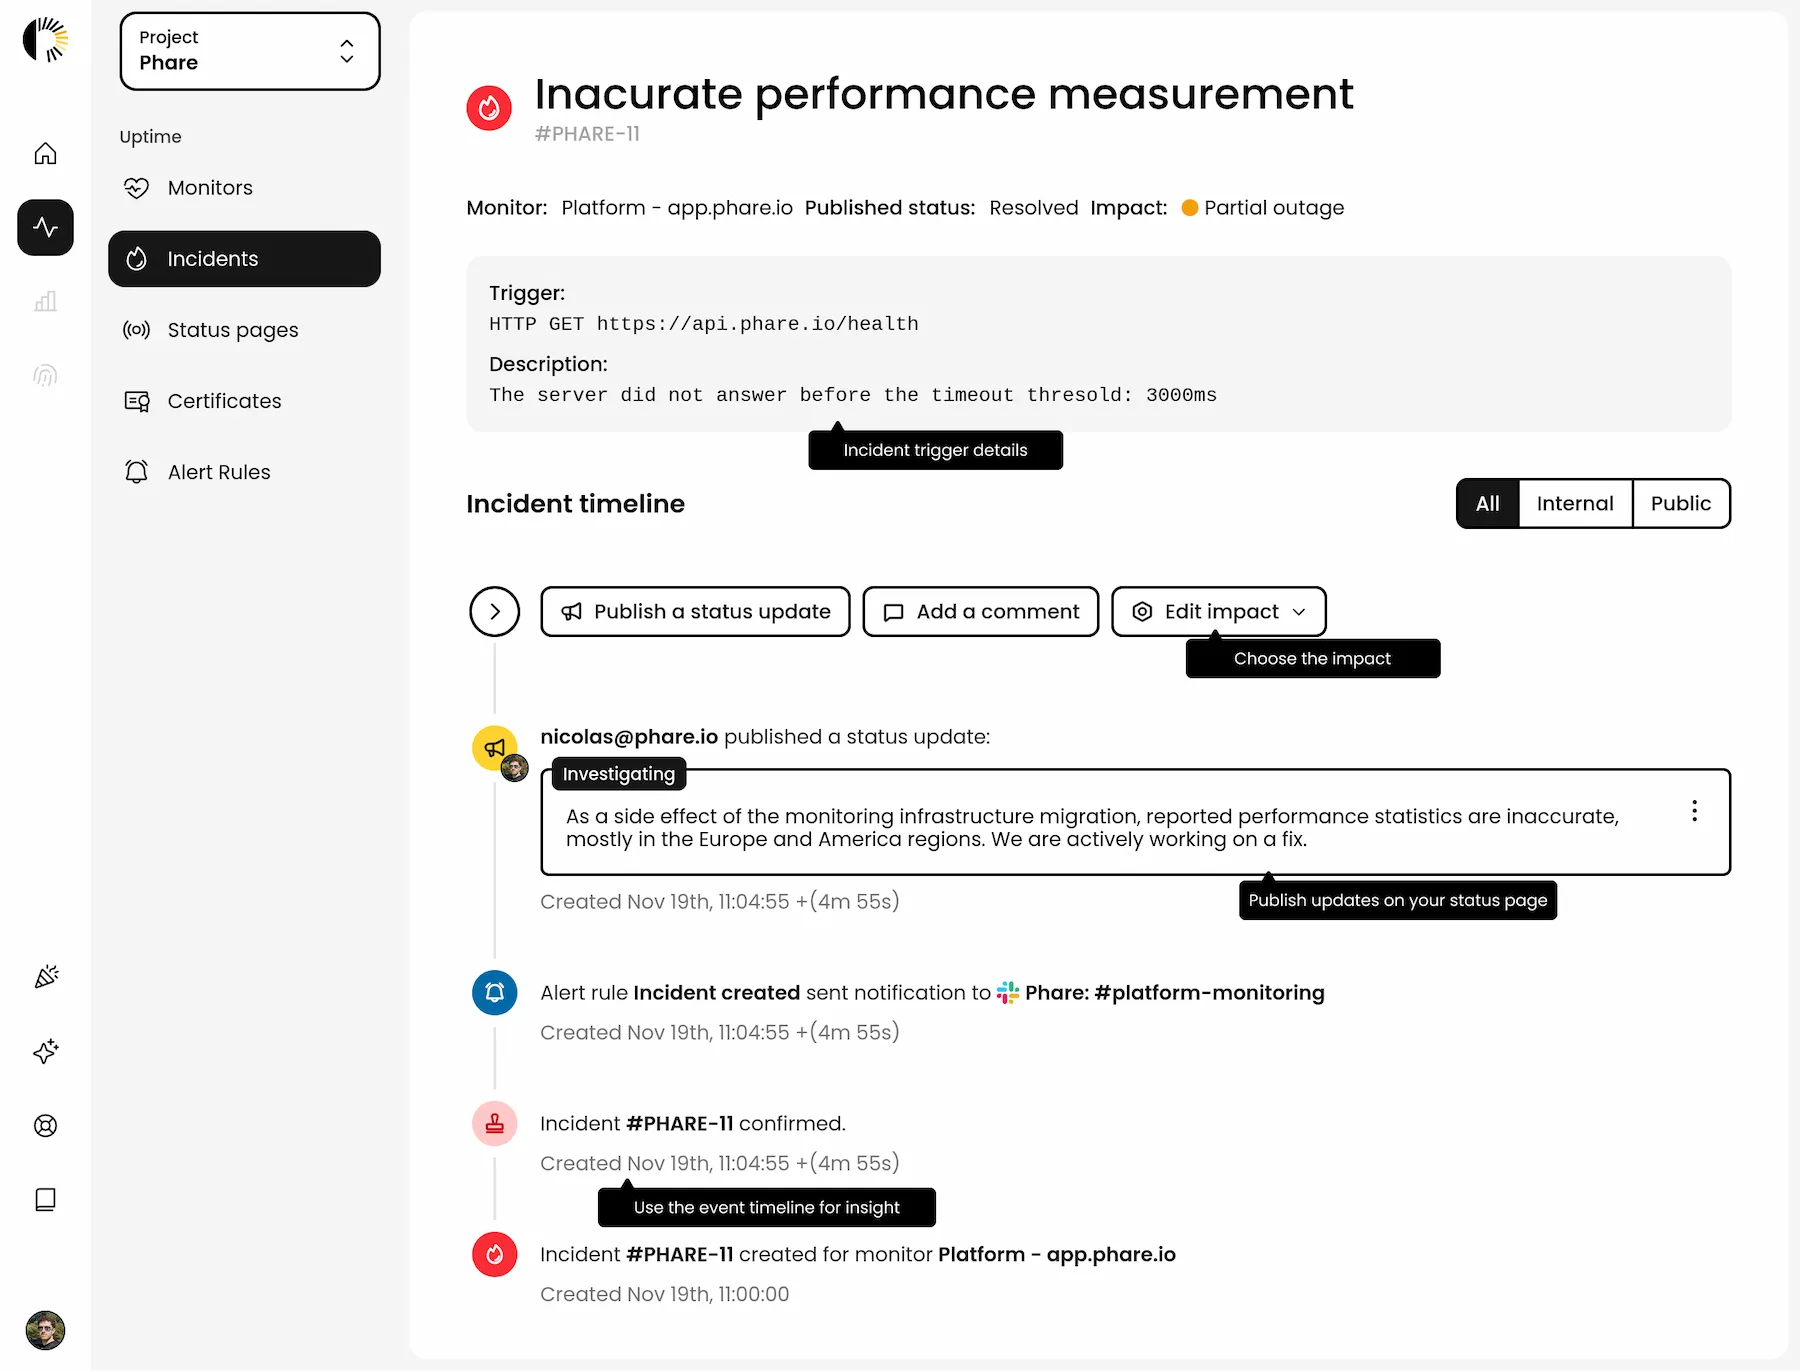 ## Status pages
Status pages let your users know what's going on when your service isn't performing as expected. A little transparency goes a long way in building trust.
[Learn more about status pages](/uptime/status-pages).
## Status pages
Status pages let your users know what's going on when your service isn't performing as expected. A little transparency goes a long way in building trust.
[Learn more about status pages](/uptime/status-pages).
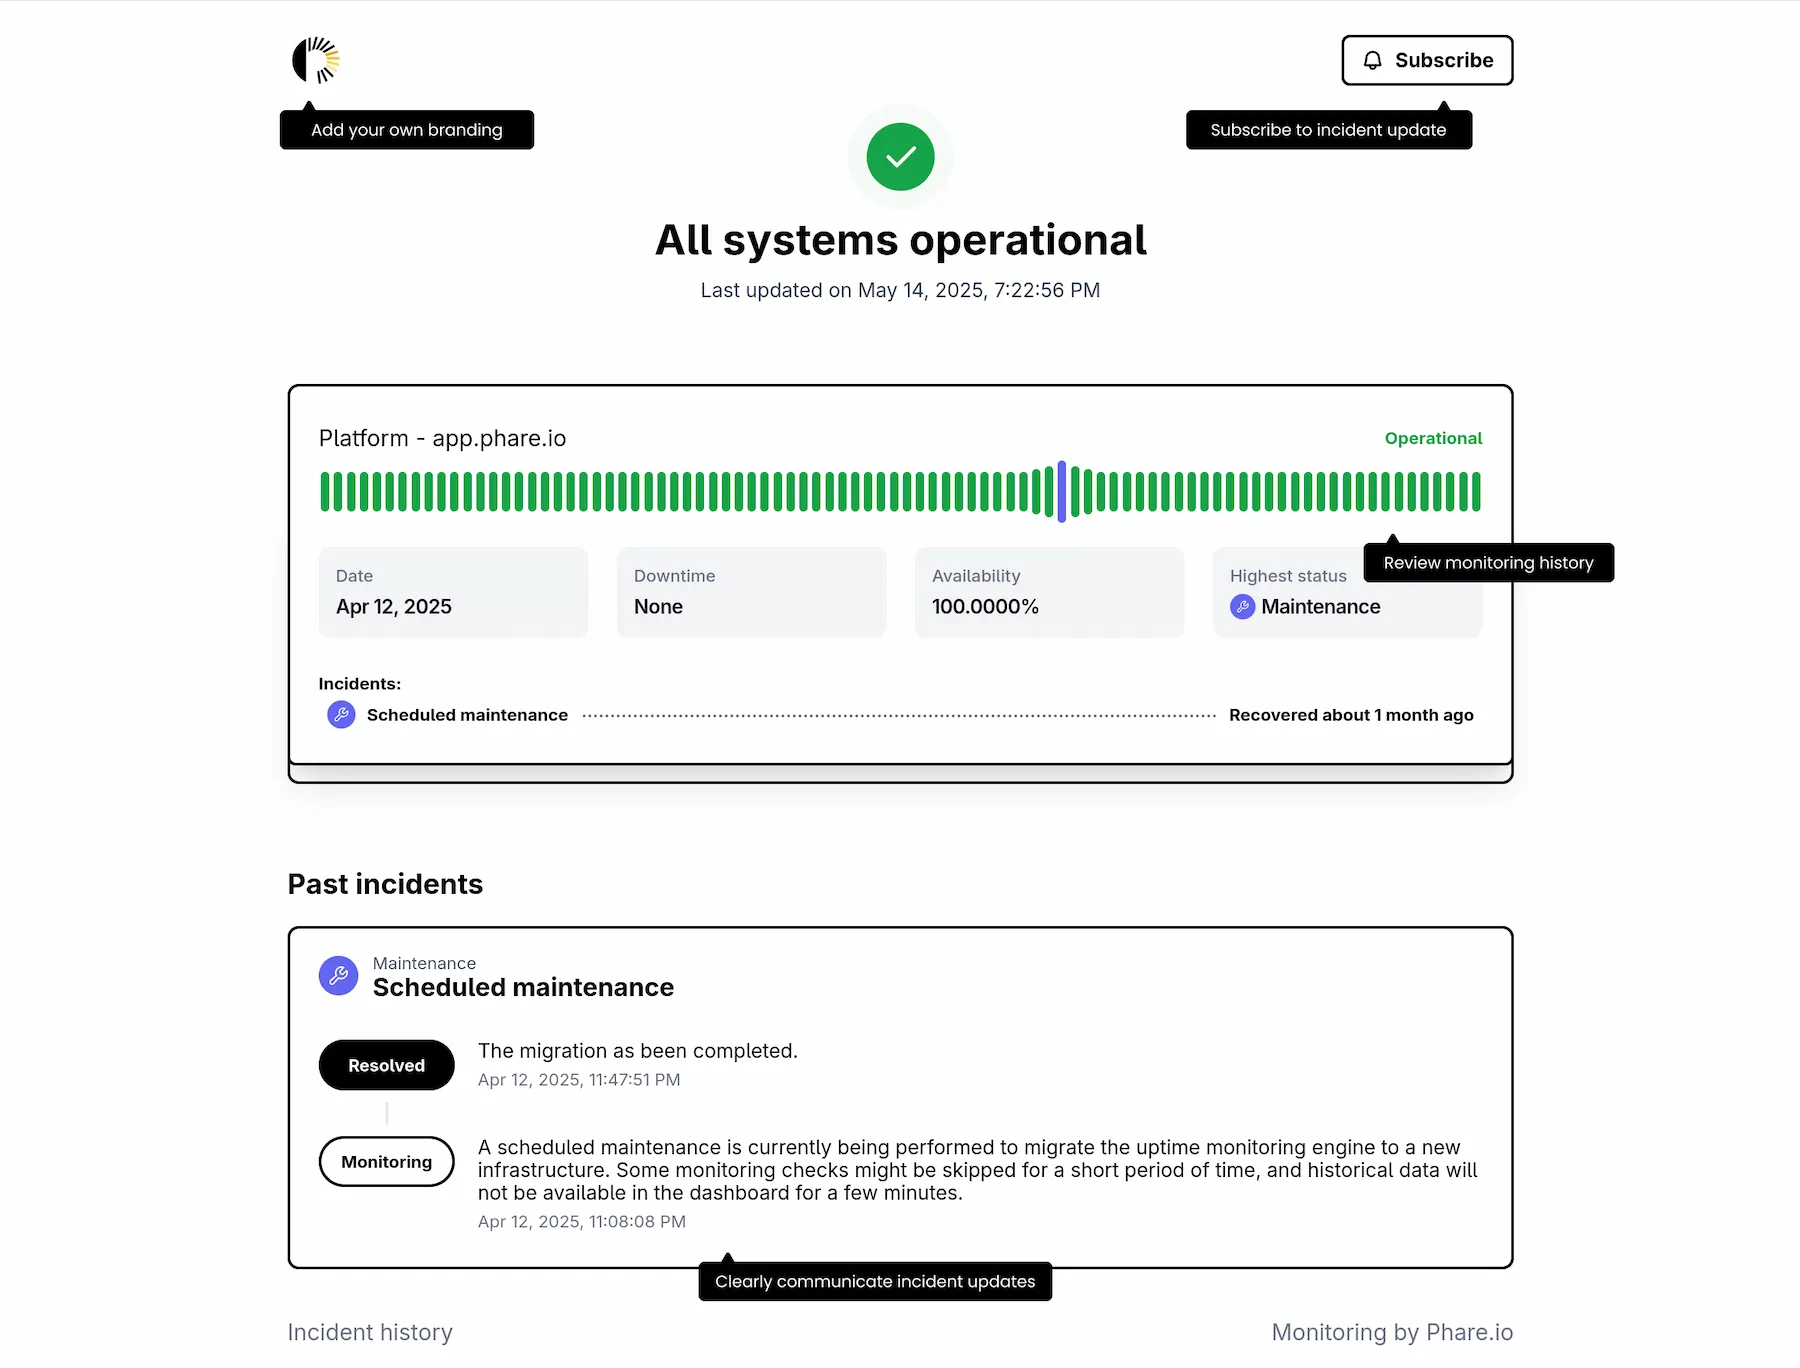 ## Alerting
When problems arise, you need to know immediately. Phare's alerting system lets you customize exactly who gets notified, when, and how on the channel of your choice.
[Learn more about alerting](/uptime/alerting).
## Alerting
When problems arise, you need to know immediately. Phare's alerting system lets you customize exactly who gets notified, when, and how on the channel of your choice.
[Learn more about alerting](/uptime/alerting).
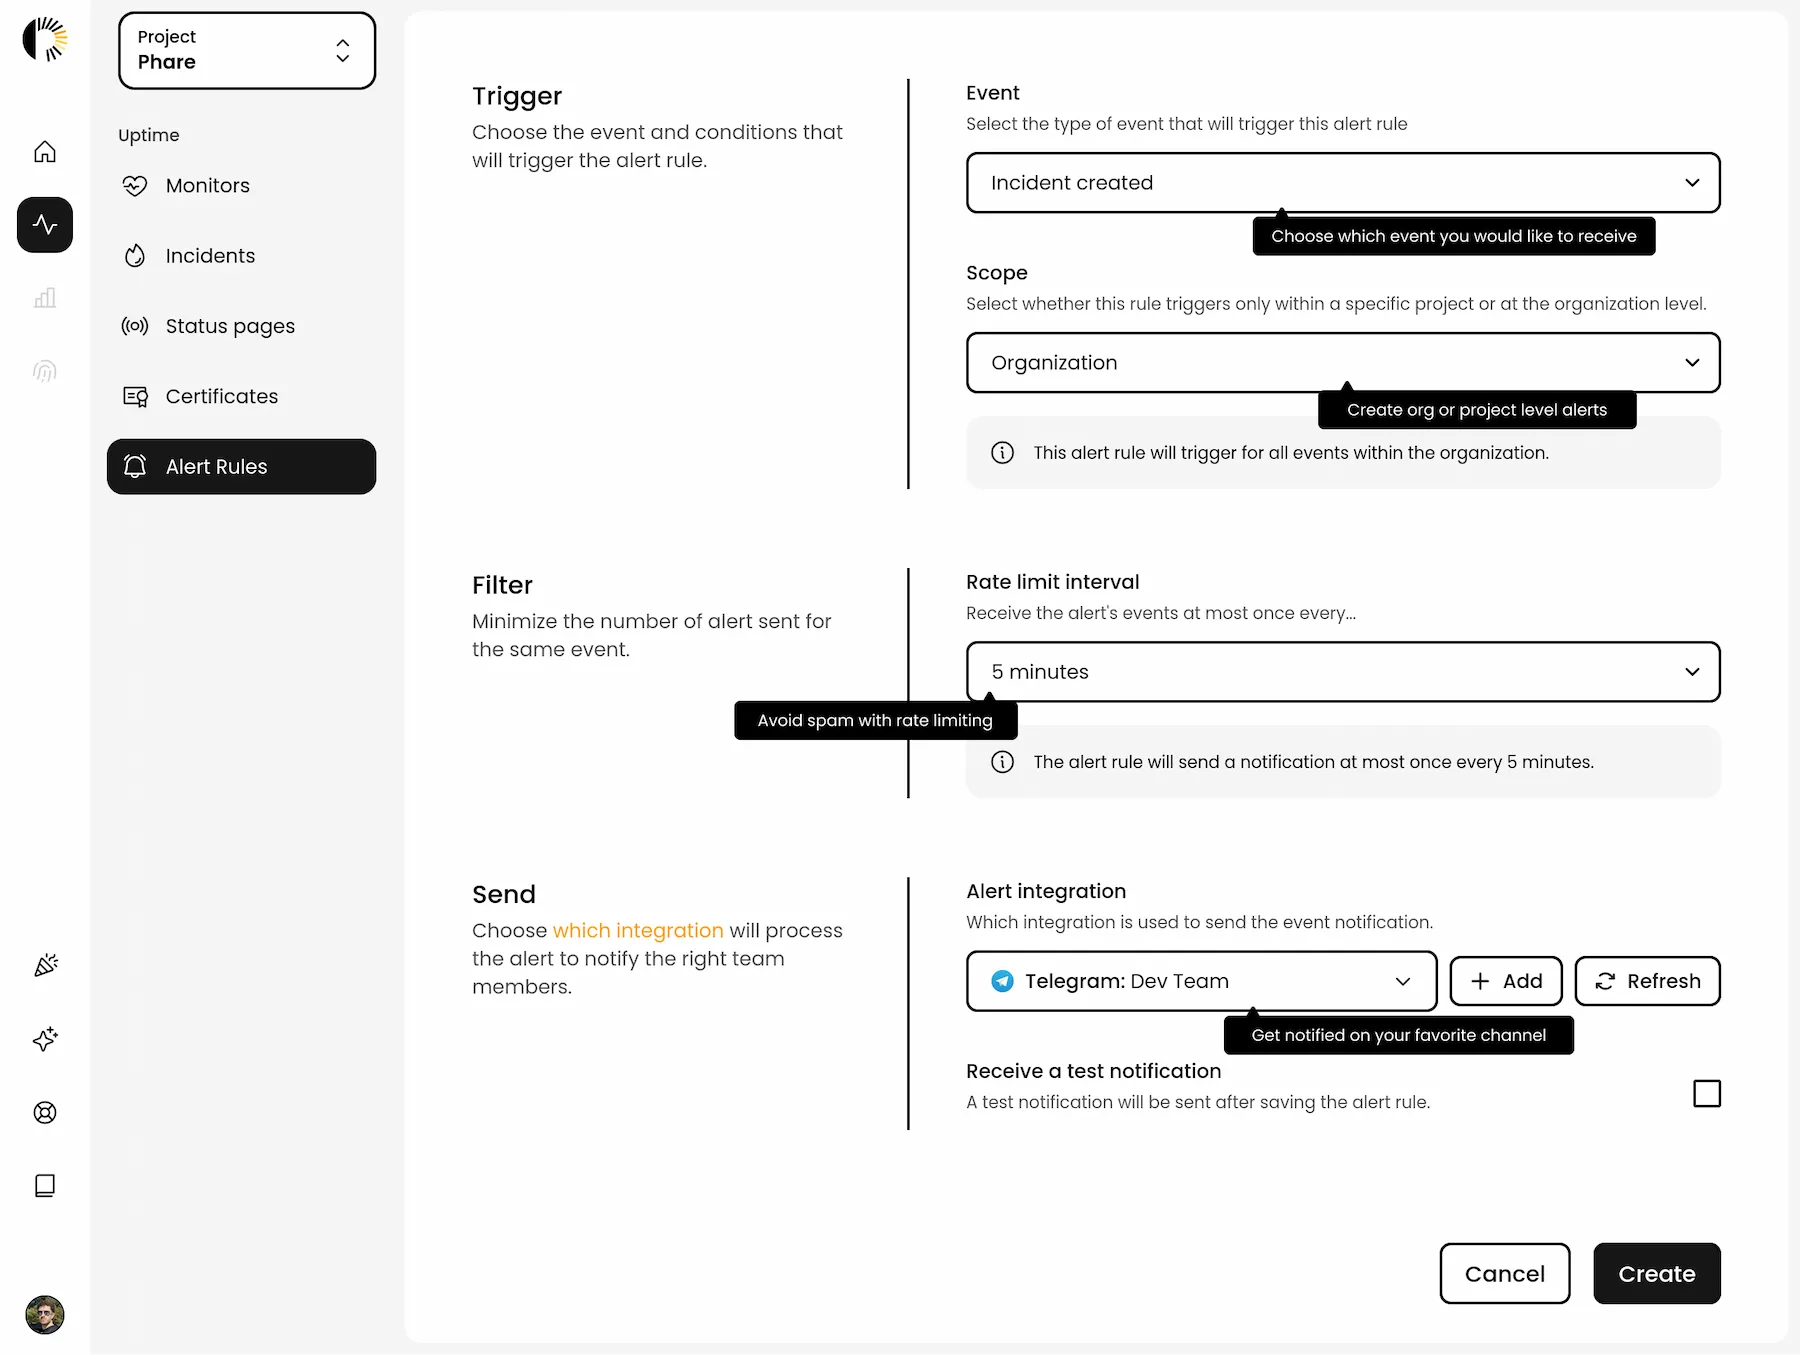 # Status pages
Source: https://docs.phare.io/uptime/status-pages
Keep your customers in the loop with a sleek status page. Build trust with transparent communication on incidents and maintenance periods.
Status pages are your public-facing communication hub during both good times and bad. They show your users the real-time status of your services, any ongoing incidents, and planned maintenance. Status pages by Phare are lightning-fast and [the most eco-friendly](https://www.websitecarbon.com/website/status-phare-io/) you can find!
## Creating a status page
Create as many status pages as your projects need, there's no limit. Pick which monitors to display, customize the look to match your brand, and give Phare a few seconds to generate an SSL certificate. Your status page will be ready to shine! Want to make changes later? No problem—customize anytime.
# Status pages
Source: https://docs.phare.io/uptime/status-pages
Keep your customers in the loop with a sleek status page. Build trust with transparent communication on incidents and maintenance periods.
Status pages are your public-facing communication hub during both good times and bad. They show your users the real-time status of your services, any ongoing incidents, and planned maintenance. Status pages by Phare are lightning-fast and [the most eco-friendly](https://www.websitecarbon.com/website/status-phare-io/) you can find!
## Creating a status page
Create as many status pages as your projects need, there's no limit. Pick which monitors to display, customize the look to match your brand, and give Phare a few seconds to generate an SSL certificate. Your status page will be ready to shine! Want to make changes later? No problem—customize anytime.
 ## Phare domain
Every status page gets its own `*.status.phare.io` domain name, complete with SSL protection out of the box.
## Custom domain
Want your status page on your own domain? Simply create a CNAME record in your DNS settings pointing to `cname.status.phare.io`:
| Type | Name | Target |
| :---- | :----------------- | :-------------------- |
| CNAME | status.example.com | cname.status.phare.io |
Make sure your DNS is configured correctly so Phare can generate a valid SSL certificate—this usually takes a few minutes. Once verified, your Phare domain will automatically redirect to your custom domain.
### Custom domain with Cloudflare DNS
Using Cloudflare? Make sure to create your CNAME with proxy status in `DNS-only` mode (keep the cloud icon gray, not orange) as shown below:
## Phare domain
Every status page gets its own `*.status.phare.io` domain name, complete with SSL protection out of the box.
## Custom domain
Want your status page on your own domain? Simply create a CNAME record in your DNS settings pointing to `cname.status.phare.io`:
| Type | Name | Target |
| :---- | :----------------- | :-------------------- |
| CNAME | status.example.com | cname.status.phare.io |
Make sure your DNS is configured correctly so Phare can generate a valid SSL certificate—this usually takes a few minutes. Once verified, your Phare domain will automatically redirect to your custom domain.
### Custom domain with Cloudflare DNS
Using Cloudflare? Make sure to create your CNAME with proxy status in `DNS-only` mode (keep the cloud icon gray, not orange) as shown below:
 ### Custom domain with Bunny.net
Hello fellow Bunny enthusiast!
Since Phare also uses Bunny.net for domain management, there's an extra security step needed. Don't worry, it's quick and straightforward:
Add this TXT record to your DNS settings to help Bunny.net verify your request:
| Type | Name | Target |
| :--- | :----------------- | :-------------------- |
| TXT | status.example.com | Bunny Support - Phare |
Head over to your [Bunny.net support hub](https://dash.bunny.net/support/tickets) and create a new ticket.
Select the **DNS** department and send something like this (with your actual domain):
```text
Hello Bunny.net team,
I created a CNAME entry for my subdomain status.example.com that points to cname.status.phare.io.
Phare.io is also using Bunny, and they need your authorization to add my subdomain on their PullZone and generate an SSL certificate for my subdomain. Could you please whitelist my domain for multi-use across the bunny platform? I've created a TXT record called `Bunny Support - Phare` as proof of ownership.
Thank you for being awesome!
```
Bunny's support team is usually quick, sit tight for a few minutes.
Once resolved, go back to your status page dashboard and hit the `Verify again` button to activate your custom domain.
### Custom domain with Bunny.net
Hello fellow Bunny enthusiast!
Since Phare also uses Bunny.net for domain management, there's an extra security step needed. Don't worry, it's quick and straightforward:
Add this TXT record to your DNS settings to help Bunny.net verify your request:
| Type | Name | Target |
| :--- | :----------------- | :-------------------- |
| TXT | status.example.com | Bunny Support - Phare |
Head over to your [Bunny.net support hub](https://dash.bunny.net/support/tickets) and create a new ticket.
Select the **DNS** department and send something like this (with your actual domain):
```text
Hello Bunny.net team,
I created a CNAME entry for my subdomain status.example.com that points to cname.status.phare.io.
Phare.io is also using Bunny, and they need your authorization to add my subdomain on their PullZone and generate an SSL certificate for my subdomain. Could you please whitelist my domain for multi-use across the bunny platform? I've created a TXT record called `Bunny Support - Phare` as proof of ownership.
Thank you for being awesome!
```
Bunny's support team is usually quick, sit tight for a few minutes.
Once resolved, go back to your status page dashboard and hit the `Verify again` button to activate your custom domain.
 Having trouble? [Contact support](https://phare.io/contact).
## Subscription
Your users can stay informed about your service's status with automatic update subscriptions. Phare status pages come with built-in RSS and ATOM feeds, allowing for easy integration with various platforms.
### RSS and ATOM feeds
Every status page automatically includes feed endpoints that users can subscribe to:
* **RSS feed**: Available at `https://status.example.com/history.rss` or `https://example.status.phare.io/history.rss`
* **ATOM feed**: Available at `https://status.example.com/history.atom` or `https://example.status.phare.io/history.atom`
### Subscribing to feeds
Your users can subscribe to these feeds using:
1. **Feed readers**: Apps like Feedly, Inoreader, or NewsBlur
2. **Email notifications**: Services that convert feeds to email alerts
3. **Slack/Discord integrations**: Many workspaces can connect to RSS feeds for team notifications
The number of subscribers is unlimited with any Phare plan without extra costs.
## Status badges
Once your status page is live, you get access to status badges you can proudly display on your website or repository. They're a great way to show transparency and confidence in your service reliability. Access them through your status page's action menu.
Having trouble? [Contact support](https://phare.io/contact).
## Subscription
Your users can stay informed about your service's status with automatic update subscriptions. Phare status pages come with built-in RSS and ATOM feeds, allowing for easy integration with various platforms.
### RSS and ATOM feeds
Every status page automatically includes feed endpoints that users can subscribe to:
* **RSS feed**: Available at `https://status.example.com/history.rss` or `https://example.status.phare.io/history.rss`
* **ATOM feed**: Available at `https://status.example.com/history.atom` or `https://example.status.phare.io/history.atom`
### Subscribing to feeds
Your users can subscribe to these feeds using:
1. **Feed readers**: Apps like Feedly, Inoreader, or NewsBlur
2. **Email notifications**: Services that convert feeds to email alerts
3. **Slack/Discord integrations**: Many workspaces can connect to RSS feeds for team notifications
The number of subscribers is unlimited with any Phare plan without extra costs.
## Status badges
Once your status page is live, you get access to status badges you can proudly display on your website or repository. They're a great way to show transparency and confidence in your service reliability. Access them through your status page's action menu.
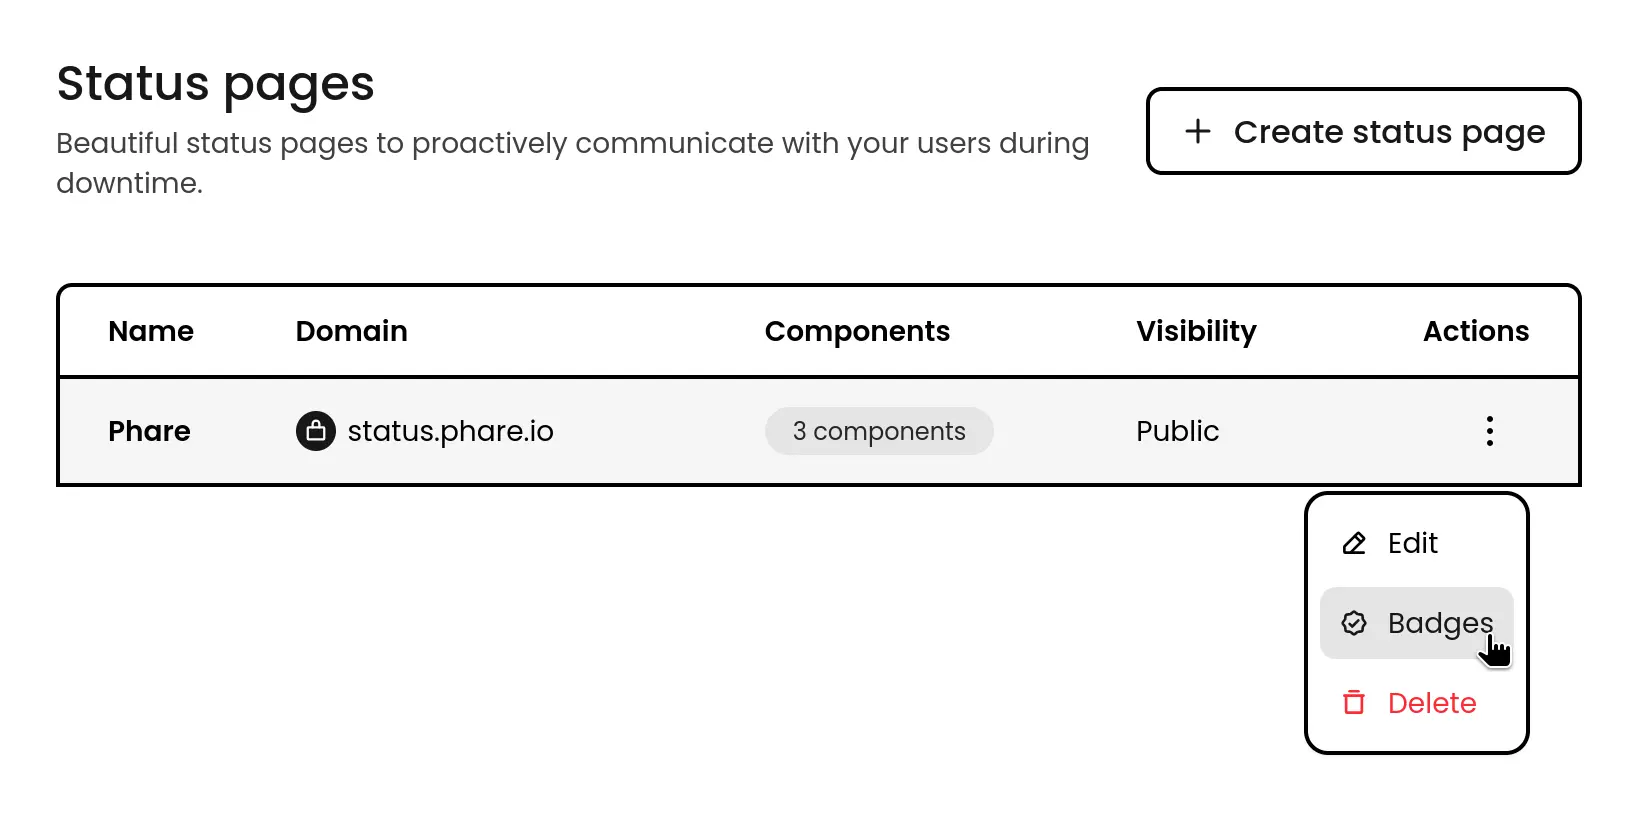 ### Embed badges
These badges are designed for your website and can be customized to fit right in with your design. They can adapt to light/dark themes or be forced to either style. You can adjust:
* `align`: For the live status badge positioning. Options: `start`, `center`, or `end`.
* `background-light`: Background color in light mode.
* `background-dark`: Background color in dark mode.
* `text-light`: Text color in light mode.
* `text-dark`: Text color in dark mode.
Colors accept standard hex formats (RGB, RGBA, RRGGBB, or RRGGBBAA). Not feeling creative? There's already some stylish presets ready to go.
### Embed badges
These badges are designed for your website and can be customized to fit right in with your design. They can adapt to light/dark themes or be forced to either style. You can adjust:
* `align`: For the live status badge positioning. Options: `start`, `center`, or `end`.
* `background-light`: Background color in light mode.
* `background-dark`: Background color in dark mode.
* `text-light`: Text color in light mode.
* `text-dark`: Text color in dark mode.
Colors accept standard hex formats (RGB, RGBA, RRGGBB, or RRGGBBAA). Not feeling creative? There's already some stylish presets ready to go.
 ### Shield badges
These are the classic badges you see in GitHub repositories. Perfect for your README file, they come in all the popular shield styles. Based on the [Shields.io](https://shields.io) service, they're [fully customizable](https://shields.io/badges/endpoint-badge) to match your project's look.
### Shield badges
These are the classic badges you see in GitHub repositories. Perfect for your README file, they come in all the popular shield styles. Based on the [Shields.io](https://shields.io) service, they're [fully customizable](https://shields.io/badges/endpoint-badge) to match your project's look.
 # User management
Source: https://docs.phare.io/user-management
Learn how to manage users and roles in Phare, invite team members, and control project access.
Phare makes team collaboration easy by letting you invite as many team members as you need to your organization. Keep things organized by managing access with roles and project scopes, so everyone gets exactly what they need, no more and no less.
## Roles
Phare keeps it simple with three roles: **Owner**, **Admin**, and **Member**. Each comes with its own permission set to help you build the right team structure.
* **Owner**: The organization's founder and top dog. Owners have all admin powers plus the ability to delete the organization and demote admins when necessary. With great power comes great responsibility!
* **Admin**: The trusted lieutenants of your organization. Admins get full access to all resources, can join any project freely, and can promote other users to admin status.
* **Member**: Your talented specialists. Members have complete access to their assigned projects and can create new projects. They can also invite new members to join the organization—helping your team grow organically.
# User management
Source: https://docs.phare.io/user-management
Learn how to manage users and roles in Phare, invite team members, and control project access.
Phare makes team collaboration easy by letting you invite as many team members as you need to your organization. Keep things organized by managing access with roles and project scopes, so everyone gets exactly what they need, no more and no less.
## Roles
Phare keeps it simple with three roles: **Owner**, **Admin**, and **Member**. Each comes with its own permission set to help you build the right team structure.
* **Owner**: The organization's founder and top dog. Owners have all admin powers plus the ability to delete the organization and demote admins when necessary. With great power comes great responsibility!
* **Admin**: The trusted lieutenants of your organization. Admins get full access to all resources, can join any project freely, and can promote other users to admin status.
* **Member**: Your talented specialists. Members have complete access to their assigned projects and can create new projects. They can also invite new members to join the organization—helping your team grow organically.
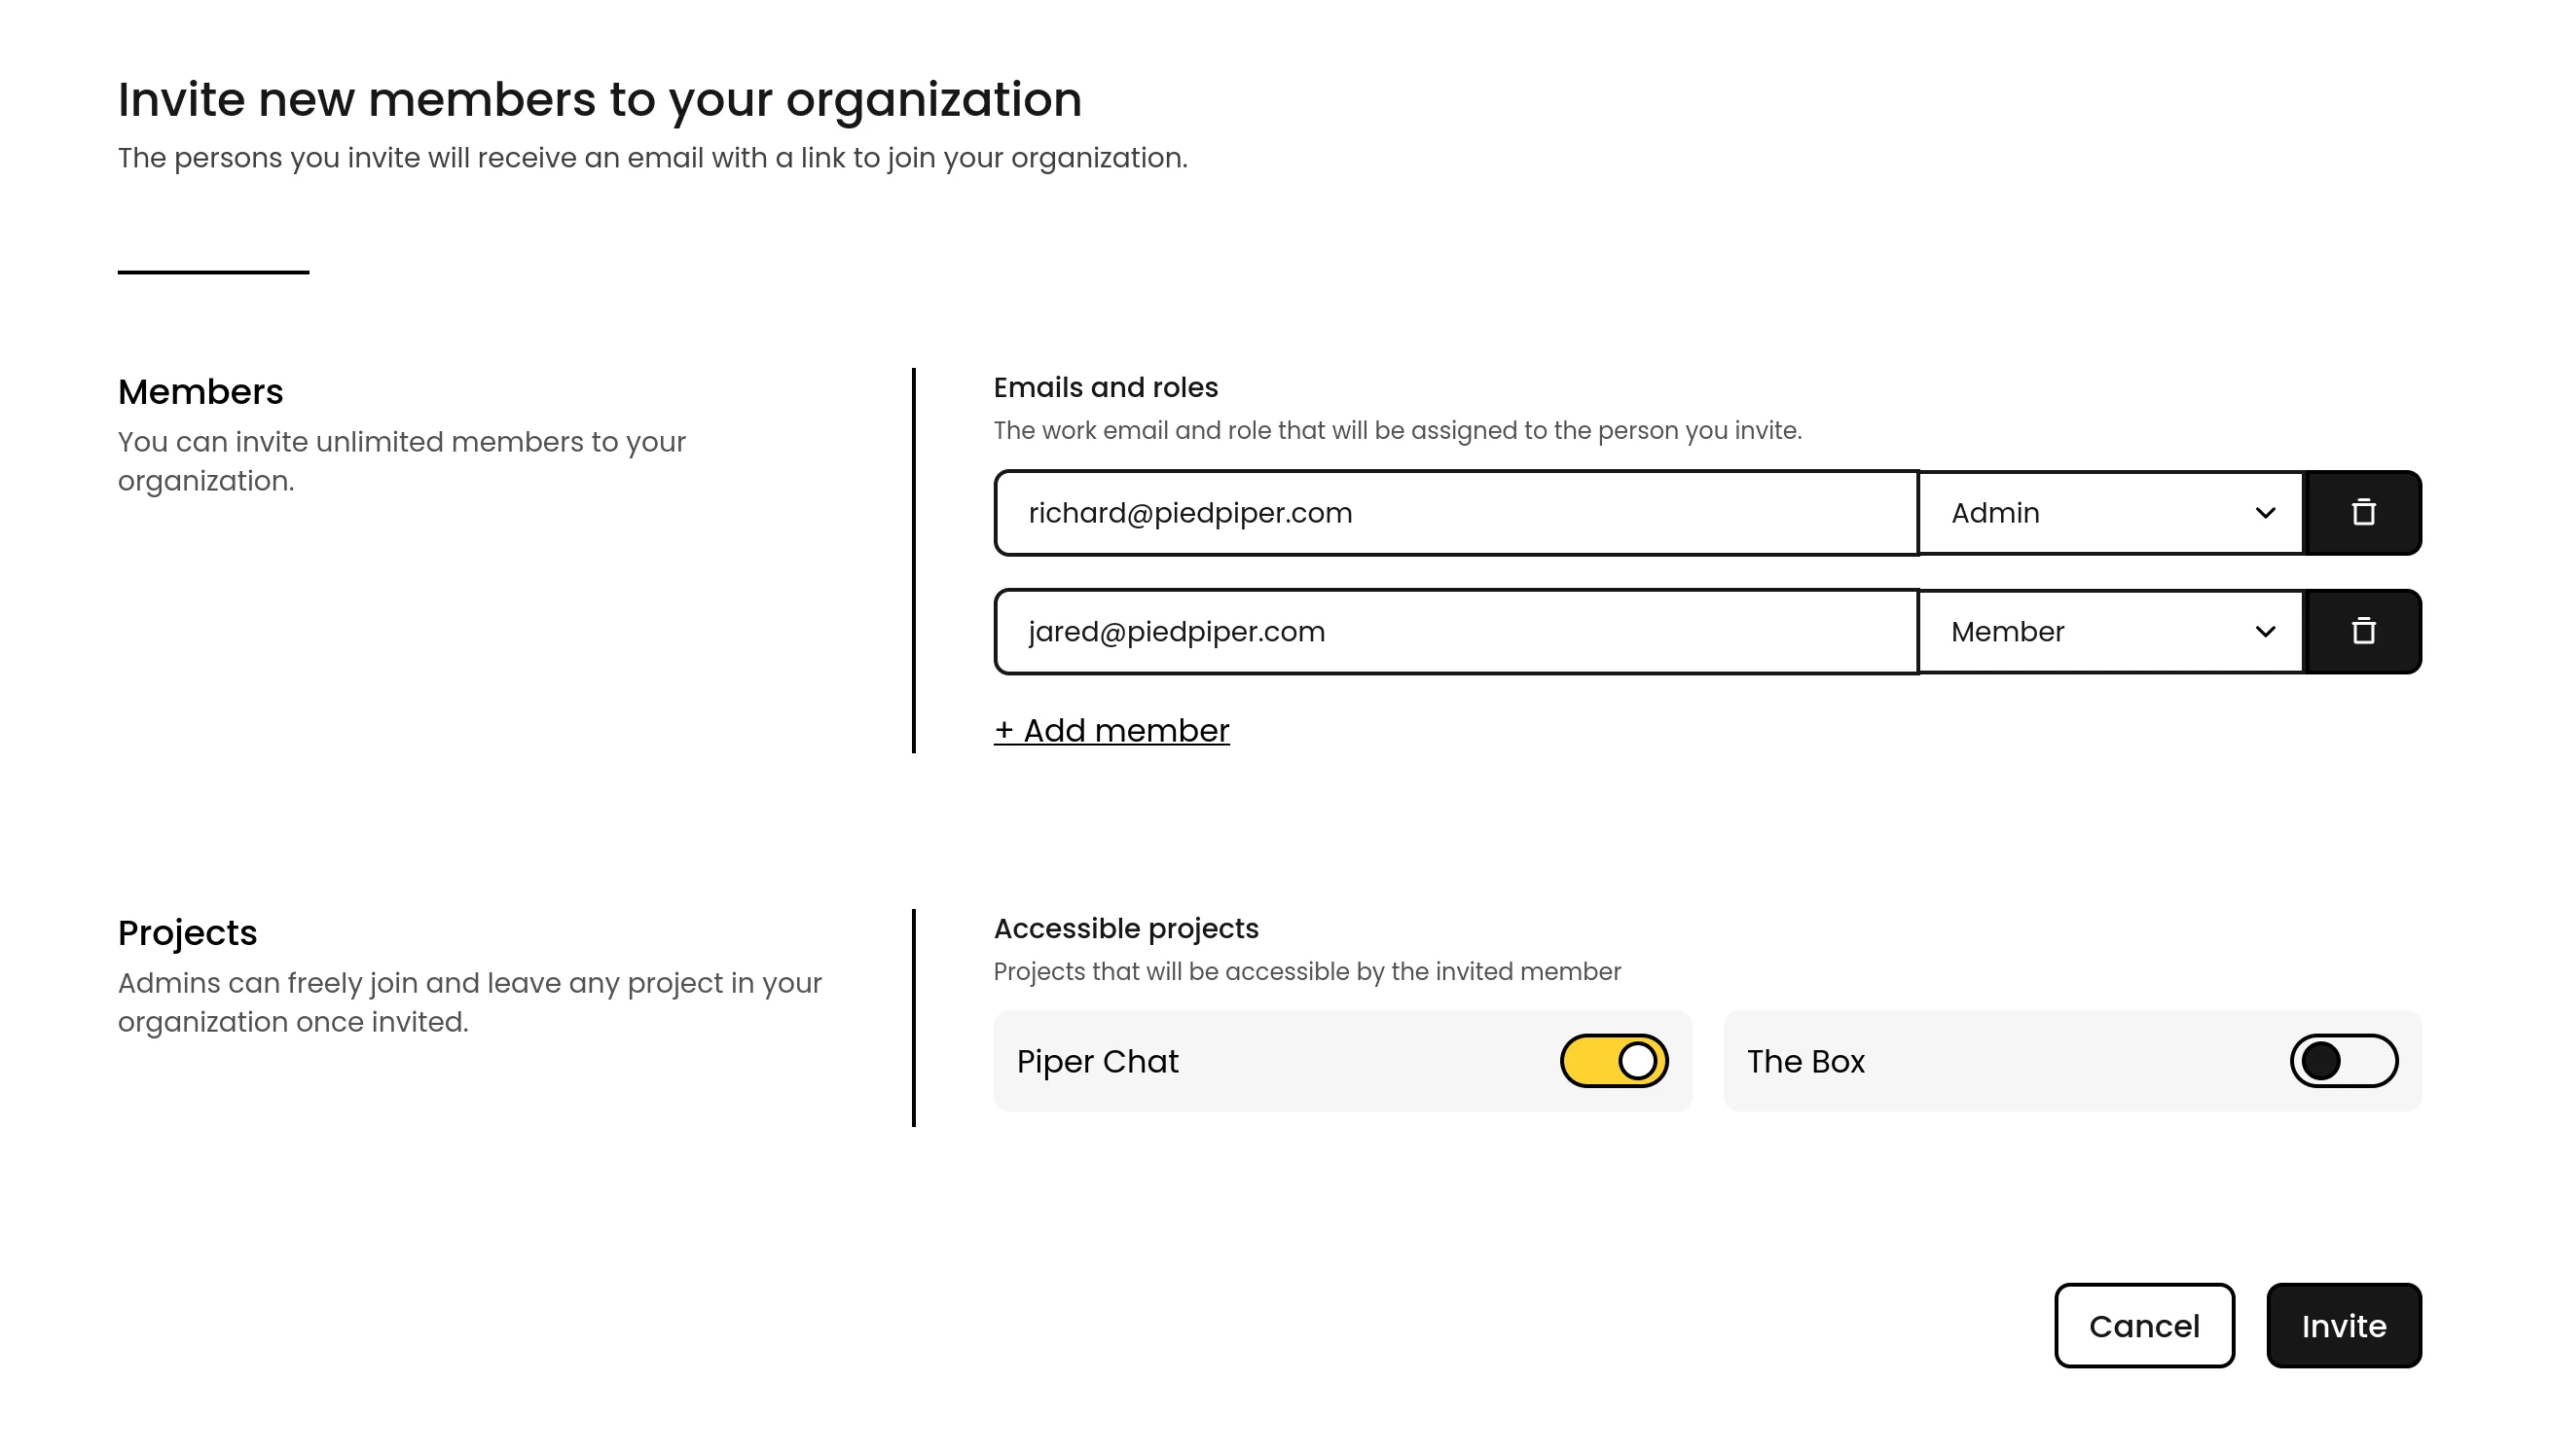 ## Accessing projects
When inviting **Members** to your organization, you can customize which projects they can access. Need to adjust their access later? No problem—you can update permissions anytime as your team's needs evolve.
For **Admins** and **Owners**, we've designed a smarter way to manage projects. You can join any project you want, but your project selector only shows the ones you've actively joined—keeping your workspace clean and focused. Don't worry though, you can still modify or delete other projects from the organization's project page without cluttering your daily view.
## Accessing projects
When inviting **Members** to your organization, you can customize which projects they can access. Need to adjust their access later? No problem—you can update permissions anytime as your team's needs evolve.
For **Admins** and **Owners**, we've designed a smarter way to manage projects. You can join any project you want, but your project selector only shows the ones you've actively joined—keeping your workspace clean and focused. Don't worry though, you can still modify or delete other projects from the organization's project page without cluttering your daily view.
