Status pages component groups
You can now organize your monitors into customizable, collapsible groups (such as “API Services” or “Databases”) to give visitors a clearer view of system health.Drag and drop monitors into groups, reorder sections on the fly, and collapse groups directly on your public status pages.Read the status pages documentation to learn more.Data processing agreement (DPA)
A formal Data Processing Agreement (DPA) is now publicly available to help customers meet GDPR compliance requirements when using Phare without having to submit a formal request.Read the full Data Processing Agreement to learn more.Private status pages
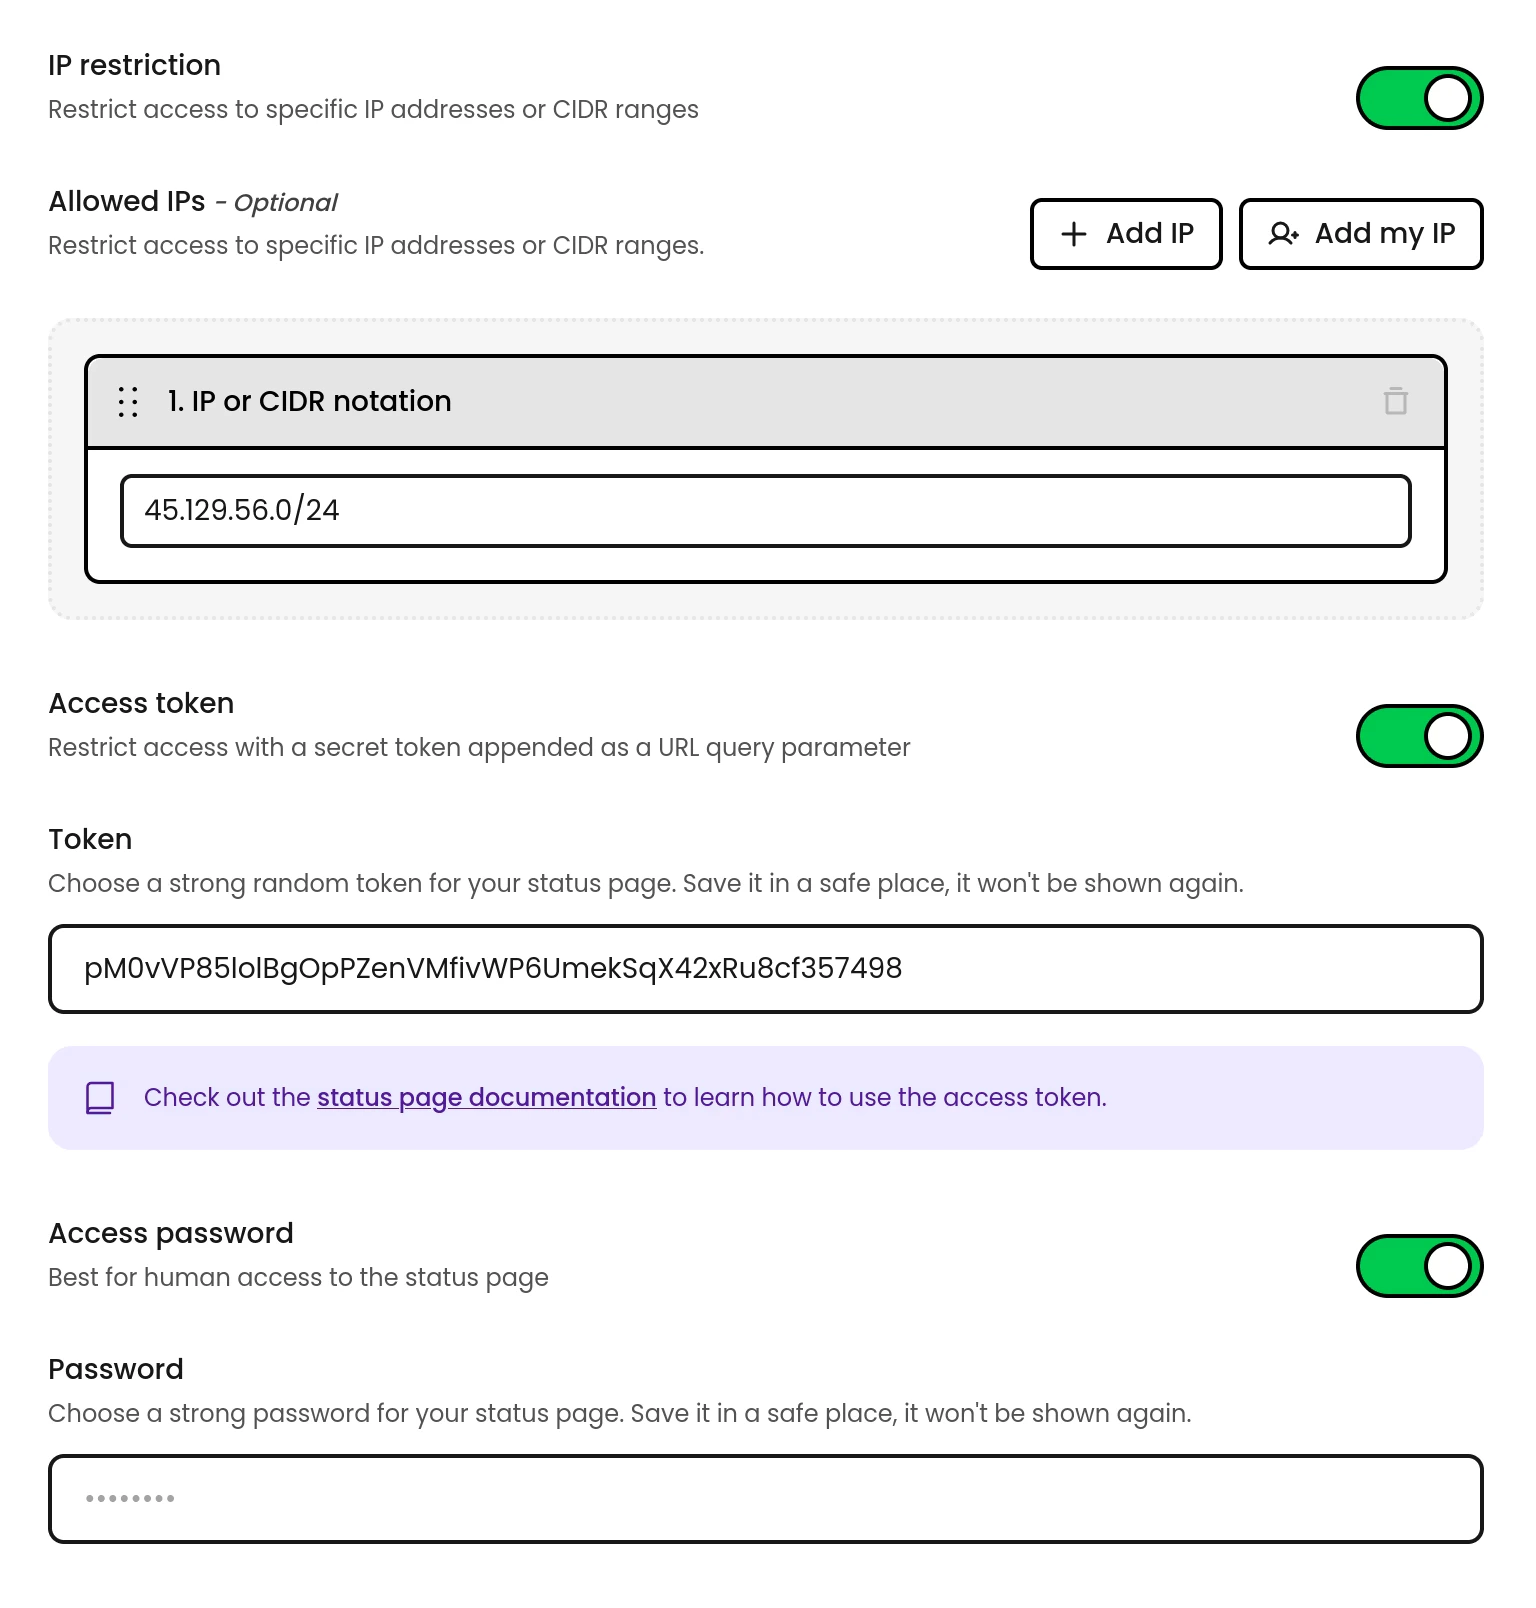
You can now restrict access to your status pages using three complementary control mechanisms, available on the Scale plan.IP allowlist
Grant automatic access to specific IP addresses or CIDR ranges. Requests from listed addresses bypass all other checks, making it the most seamless option for office networks or VPN exit nodes.Access token
Append a secret token query parameter to any status page URL to grant access, great for programmatic access. Works on the main page, feeds, and badge endpoints. When a browser visits with a valid token, a session cookie is set for 1 hour so subsequent visits don’t need the token.Access password
Visitors are prompted with a login screen before they can view the page. Simple and effective for internal pages shared with team members or customers.Read the status pages access controls documentation to learn more.Ordering
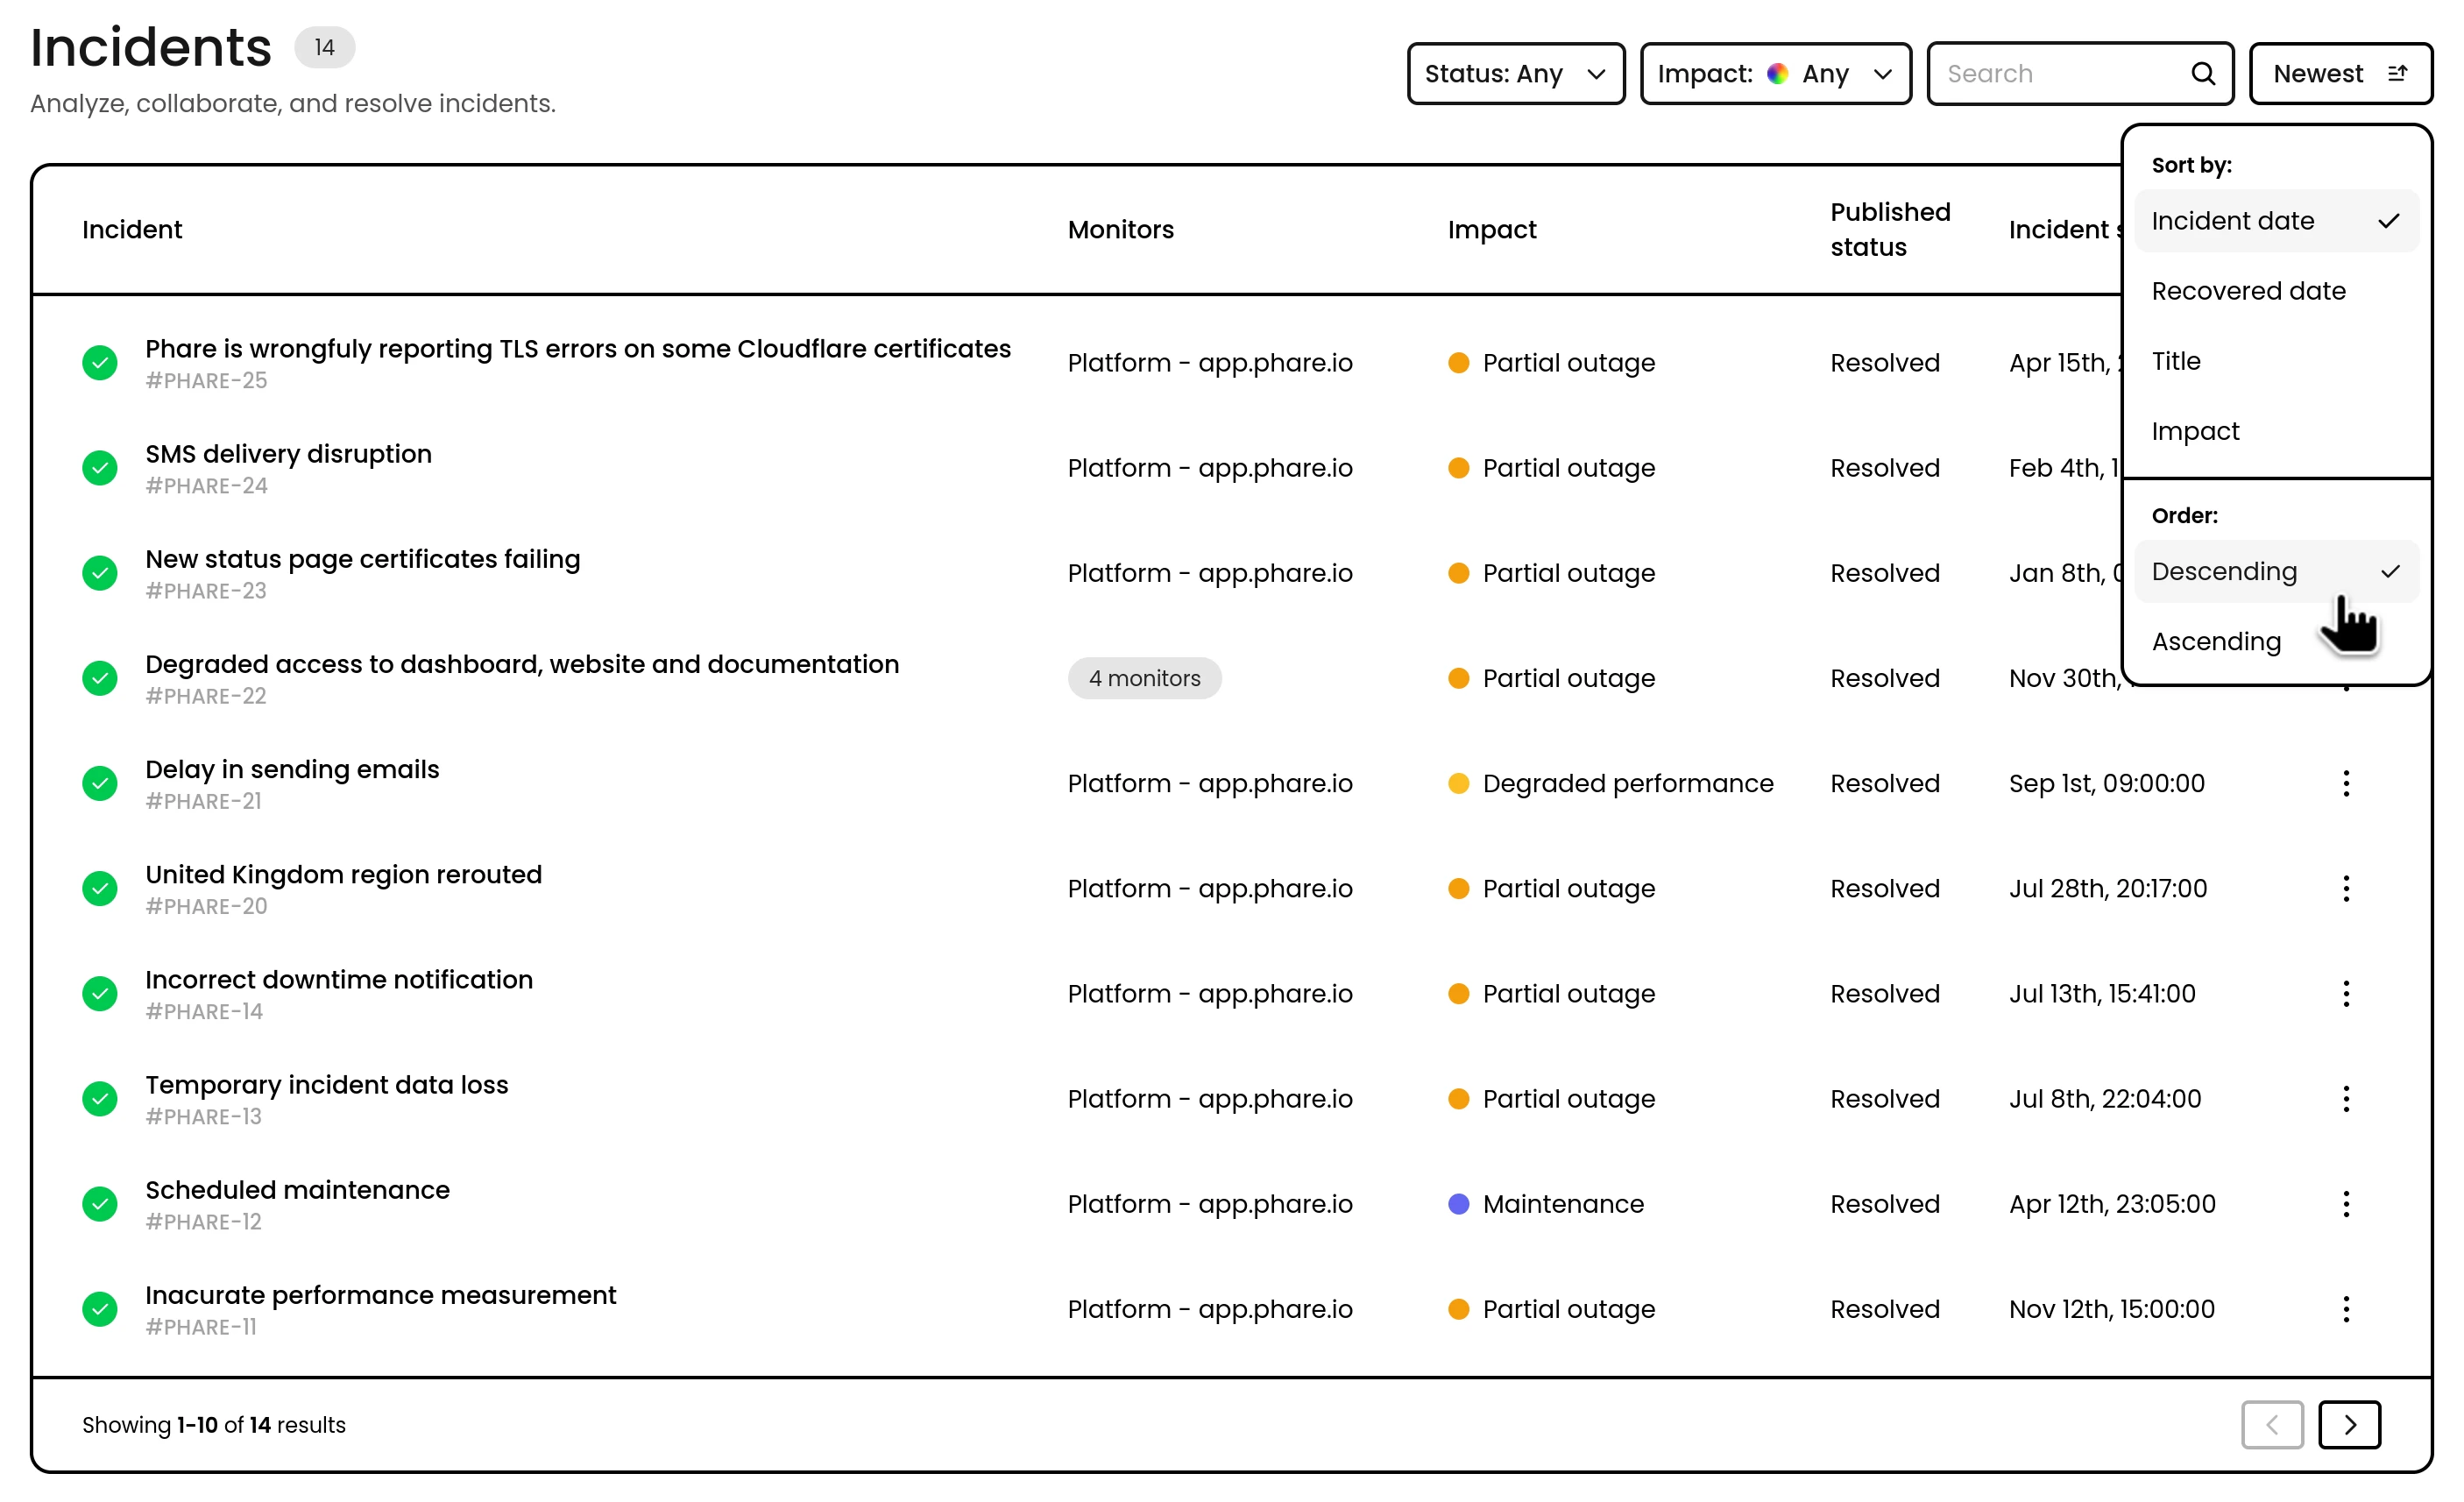
It is now possible to order all data-tables on your Phare dashboard.Order incidents by recovery date, monitors alphabetically, certificates by expiration dates, combined with filtering and text search this allows you to display the data you need for your workflow.Updated AI model
Phare updated the AI model used for to generate incident summary and post-mortems from Magistral small to Mistral Small.Mistral Small offers better performance, lower costs, optimized underlying architecture and a jump from 24B to 119B tokens.Partial API updates
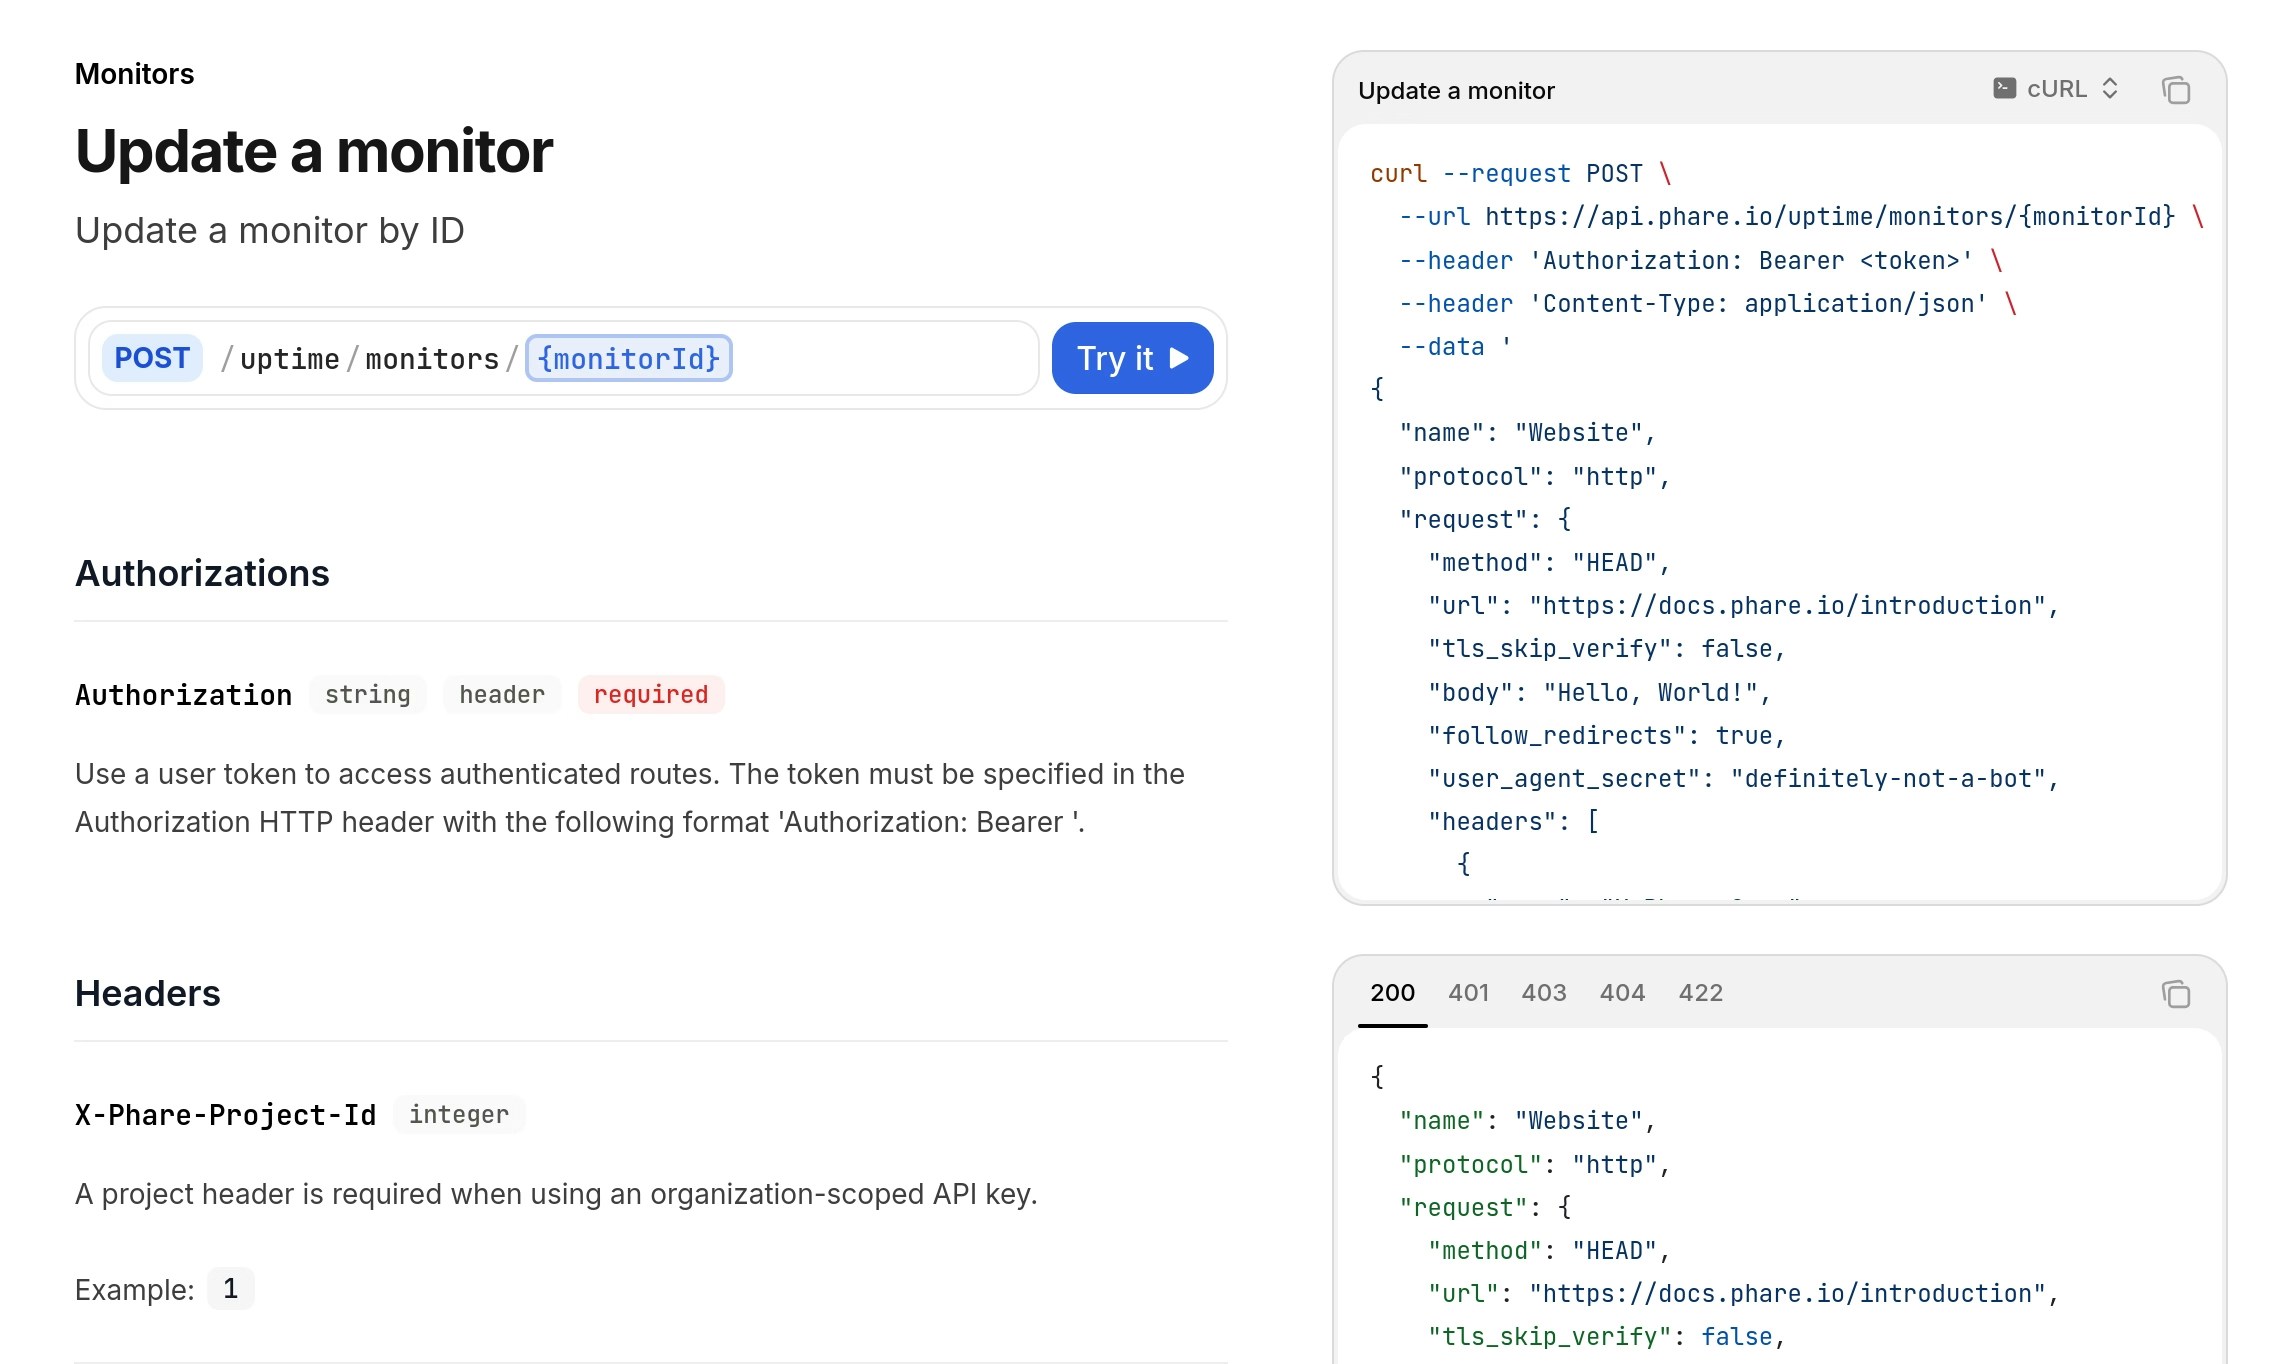
The update monitor and update incident endpoints now accepts partial update. This means you can update only the fields you want to change, leaving the rest unchanged and making the API more practical to use.Support for more entities will be added in the near future, until all update endpoints support partial payloads.Monitor region threshold
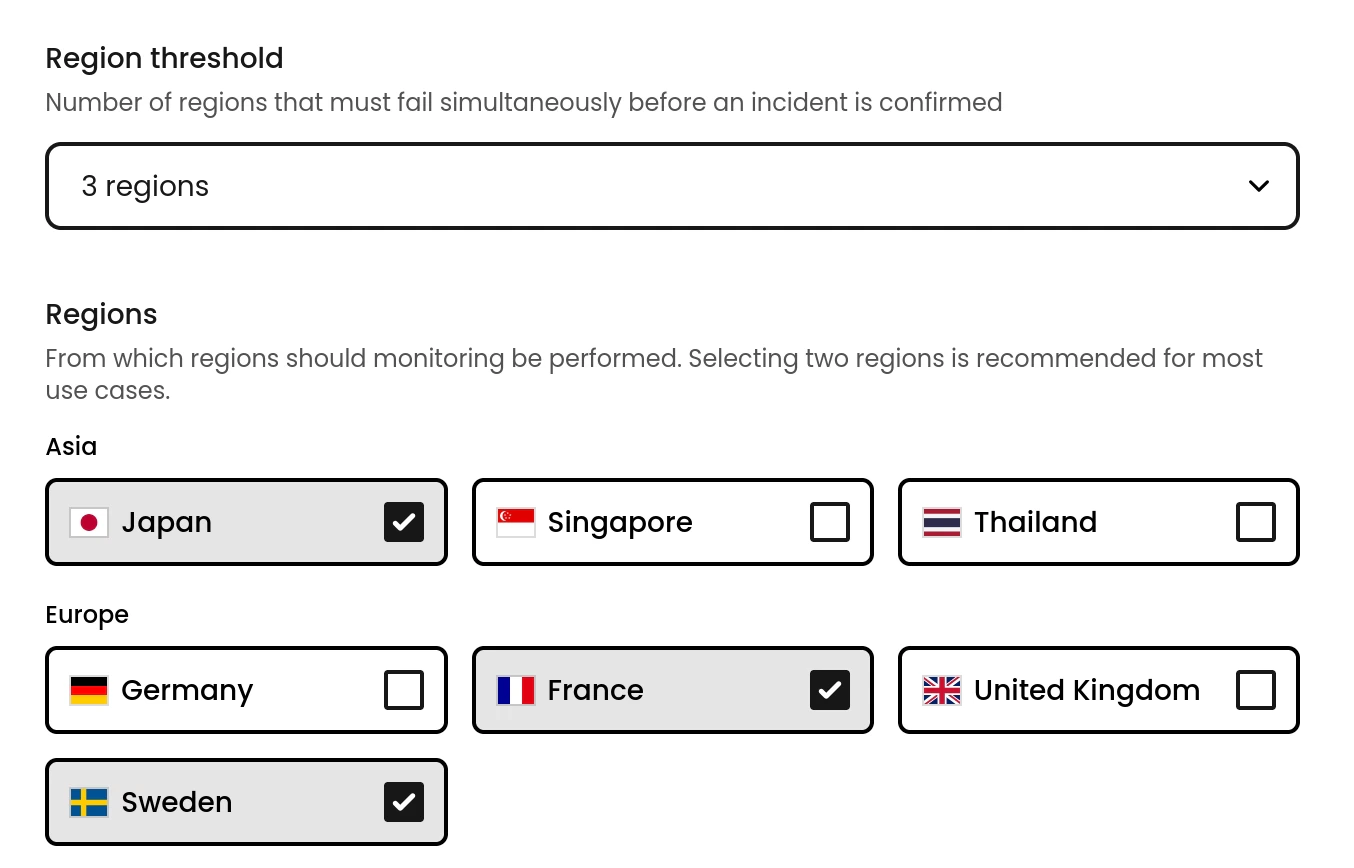
Monitor can now individually configure in how many regions they must be detected as down to trigger an incident. This allow you to fine tune your incident detection strategy to your specific needs.Support for dark & light status page branding
It is now possible to show different logos and favicons on your status page depending on the theme shown.Upgraded ilert integration
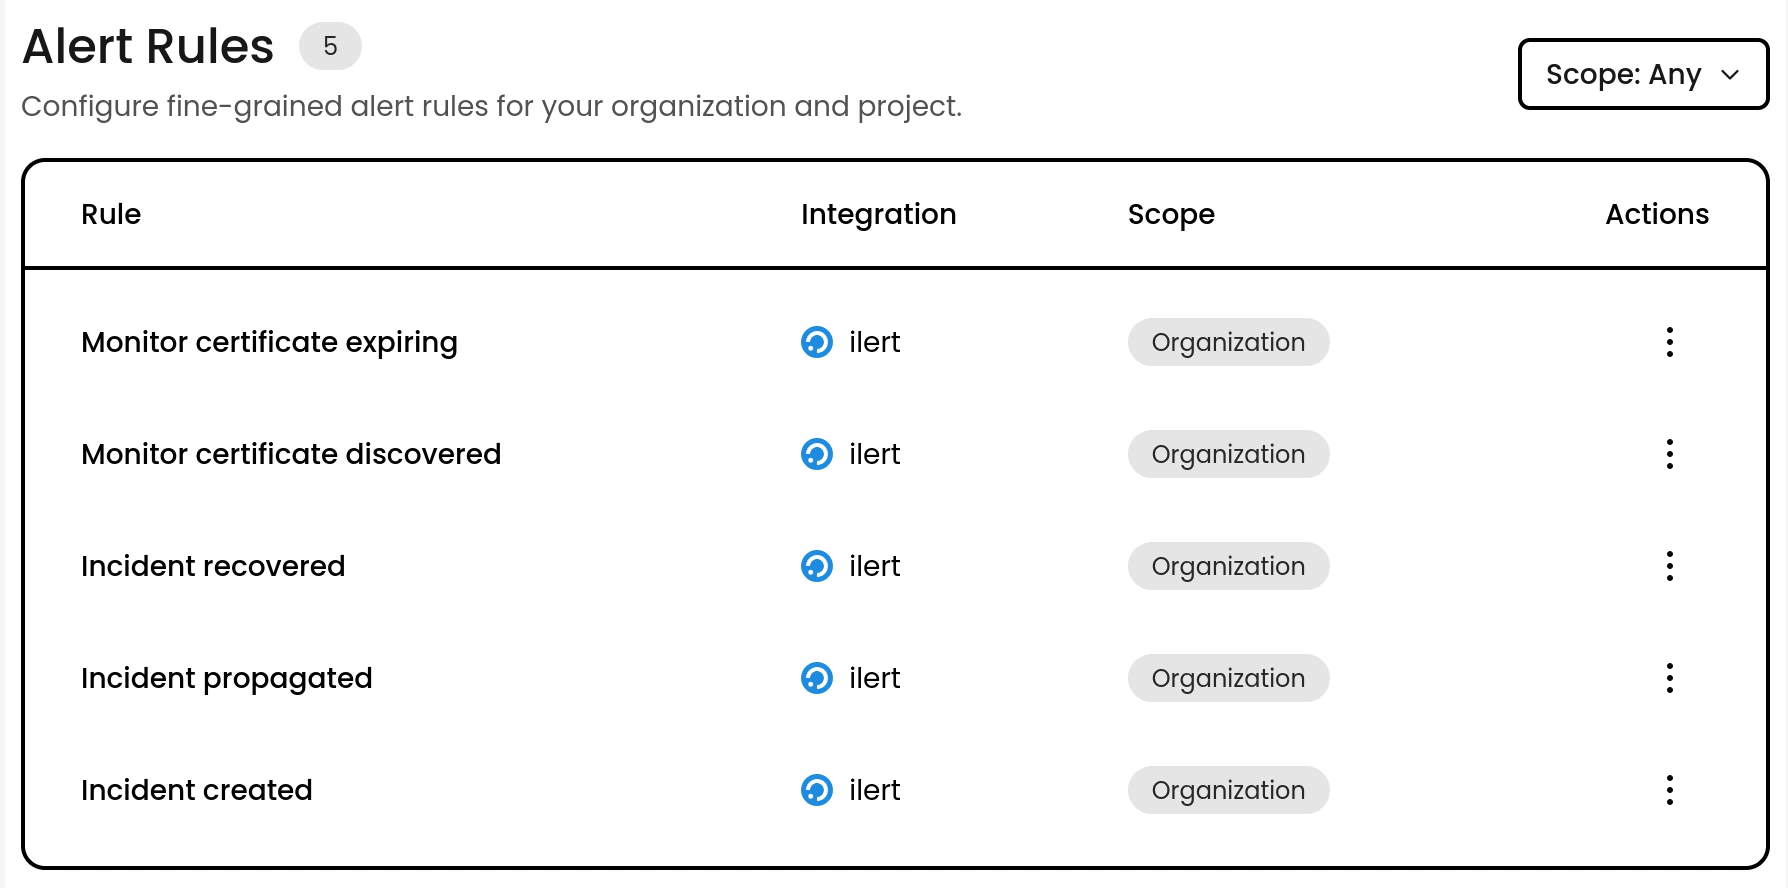
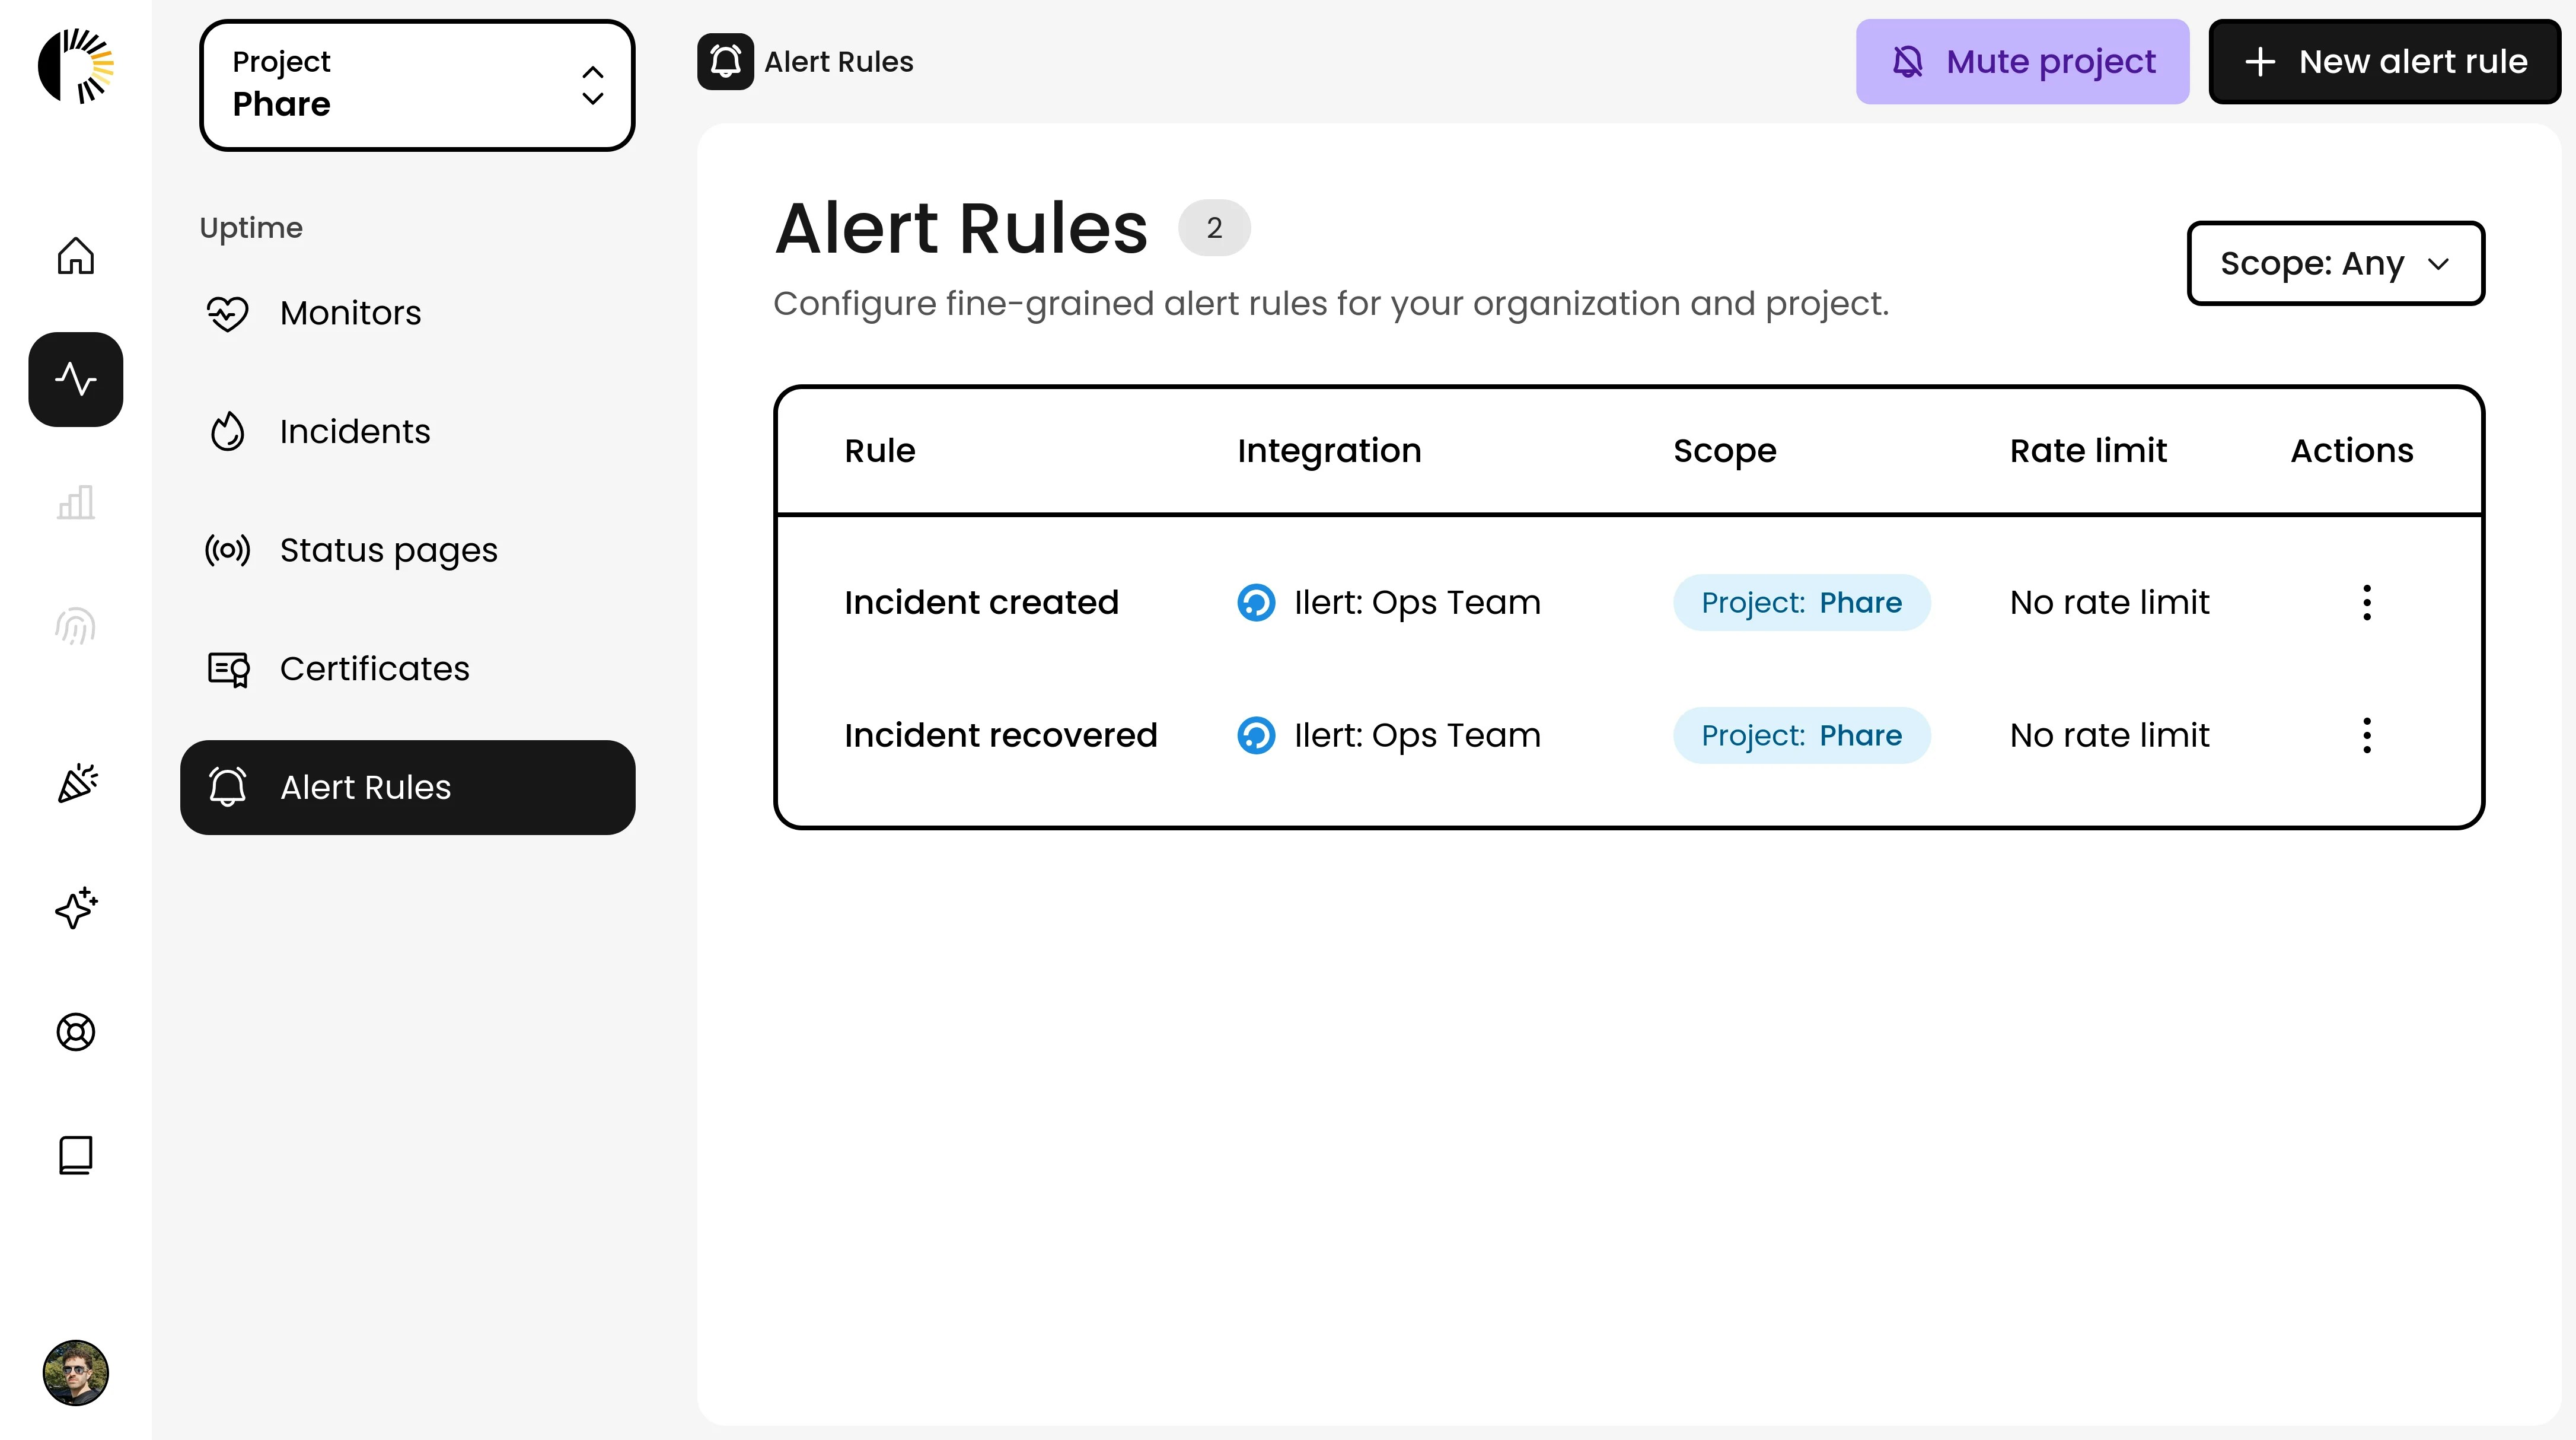
You can now forward 5 alert events to your ilert account, and they all got upgraded with way more data than before. The following events are now compatible:
- Incident created
- Incident propagated
- Incident recovered
- Monitor certificate discovered
- Monitor certificate expiring
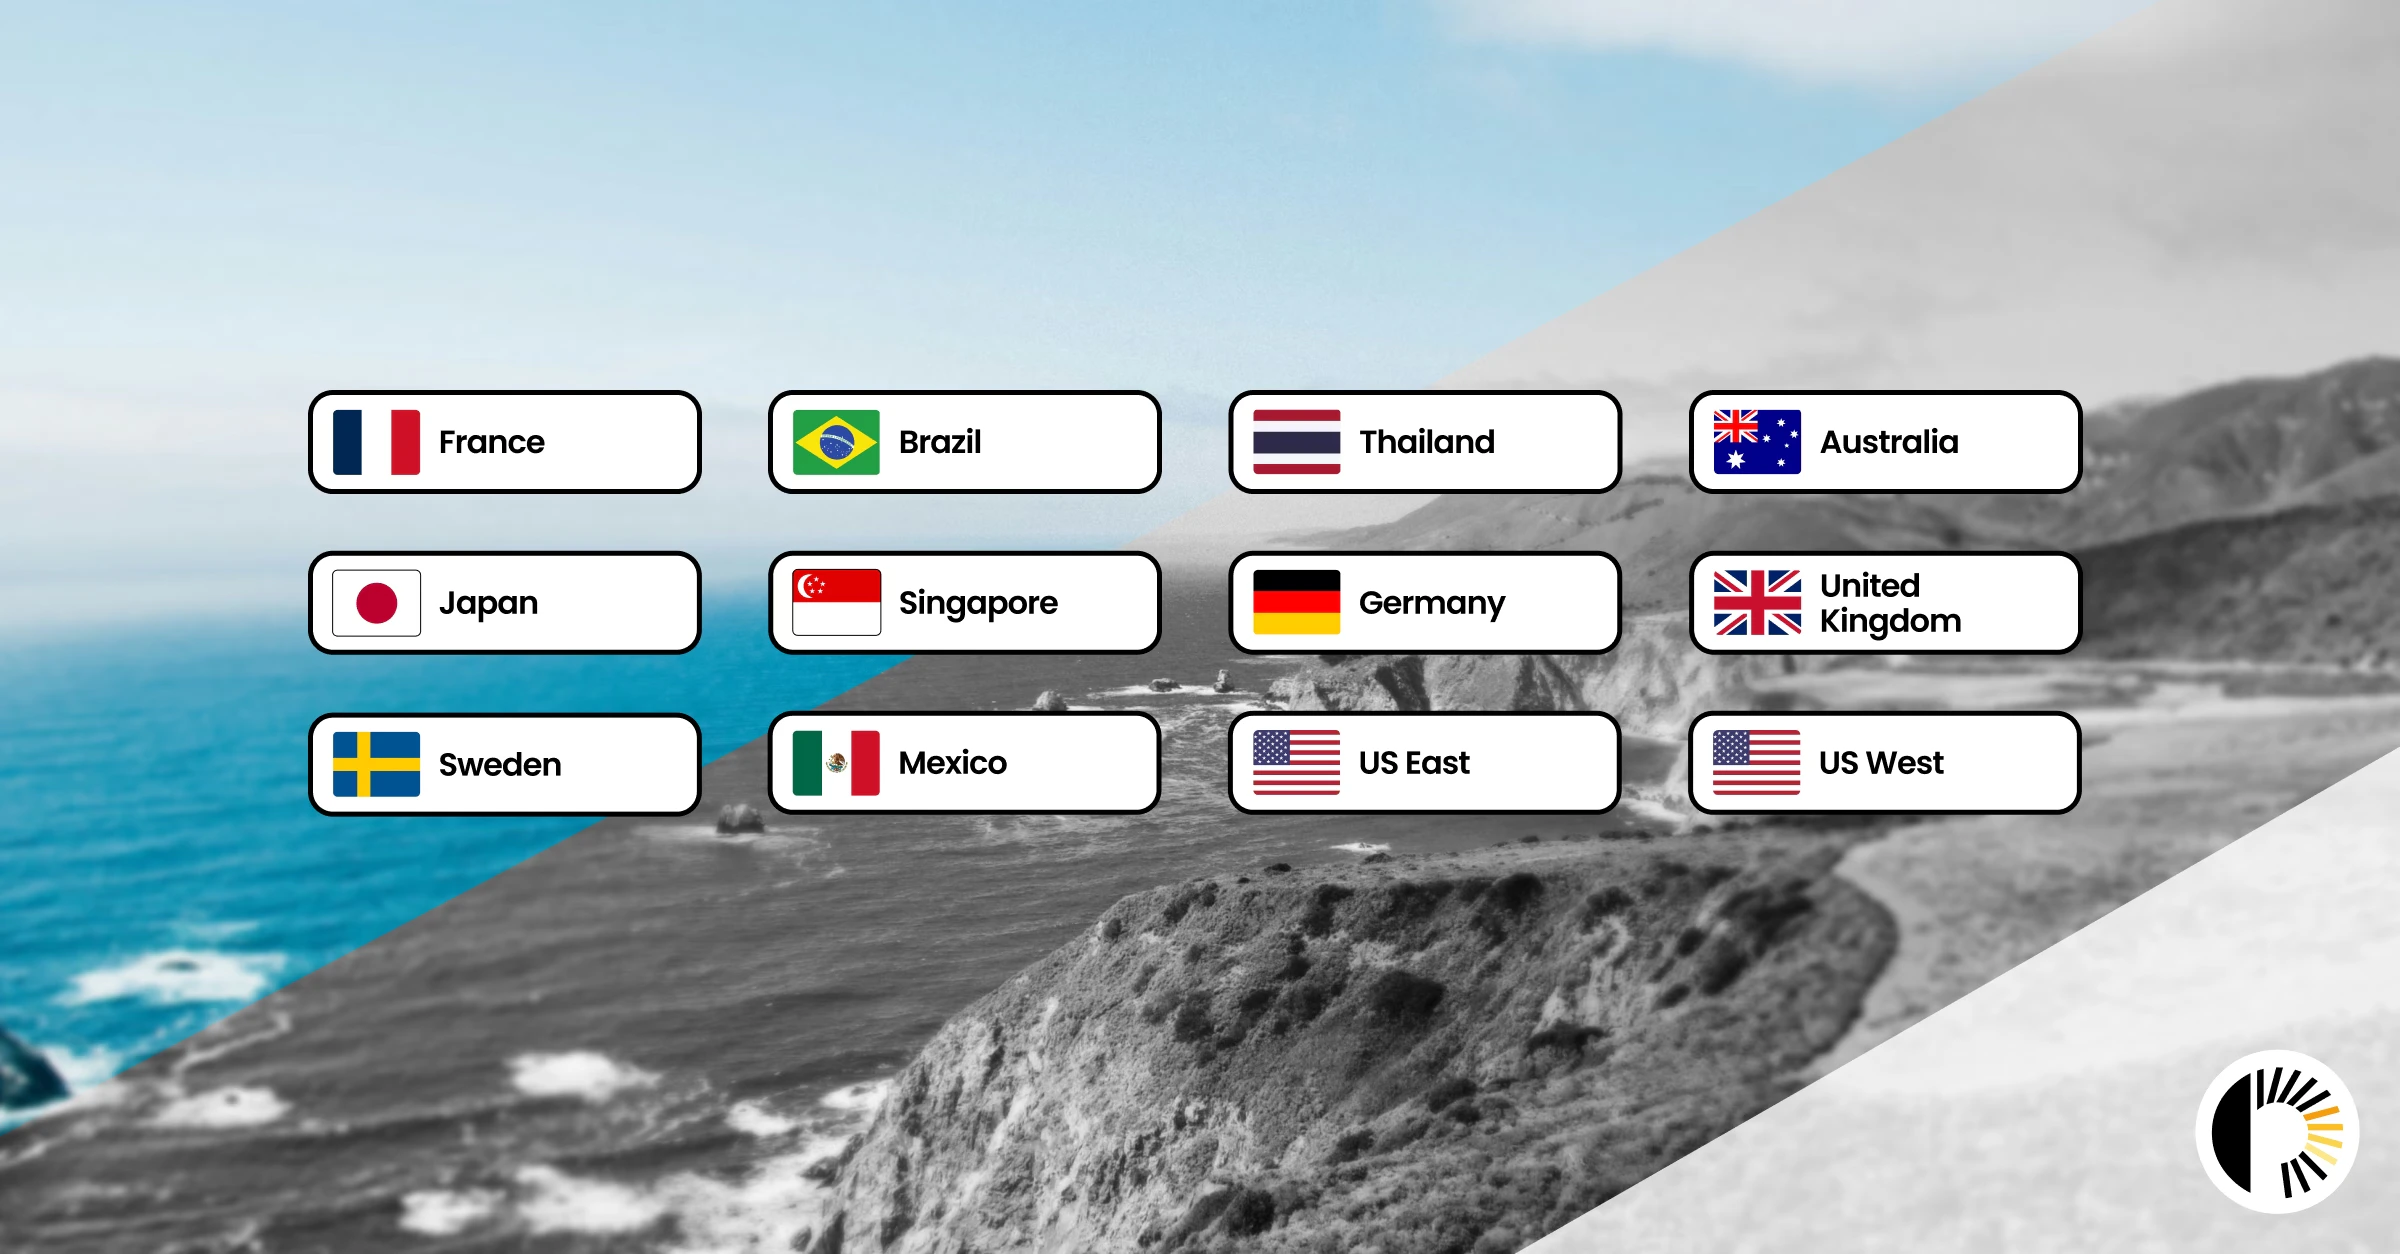
Checkout the full ilert documentation to get started.Single region failure detection
When monitoring from multiple regions, incidents were only triggered if at least two regions reported a failure, meaning a real regional outage could go completely undetected. Incidents are now flagged as soon as any single region goes down, regardless of how many regions you’re monitoring from.This change ensures your monitoring coverage actually reflects reality, with zero silent failures.2FA recovery codes
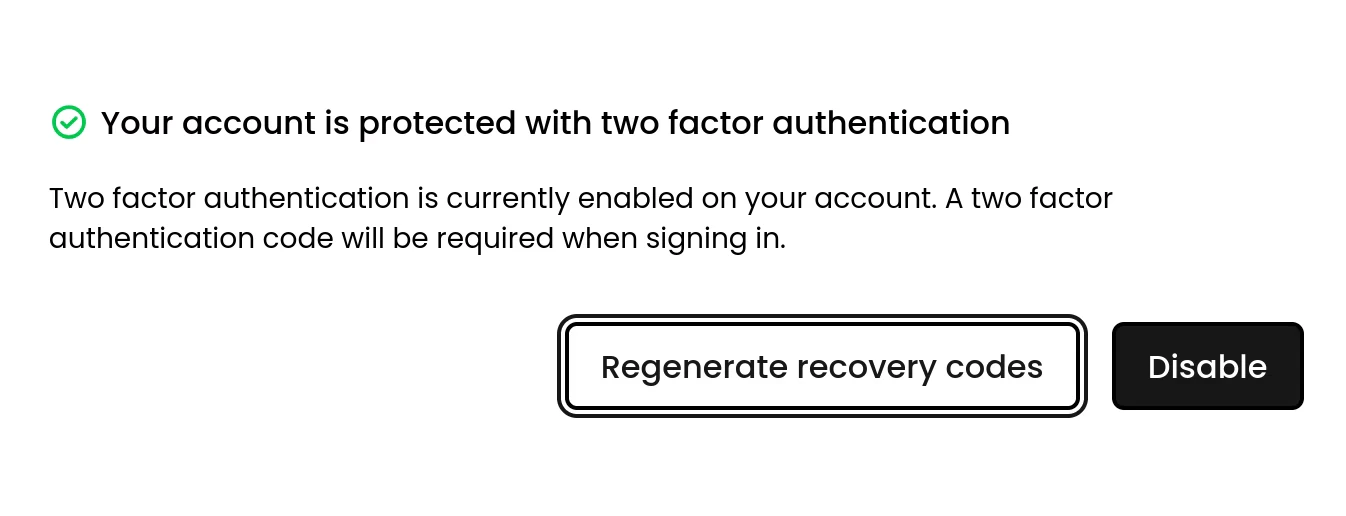
It’s now possible to get recovery codes when you have two-factor authentication (2FA) enabled on your account. This will allow you to recover your account if you ever loose access to your 2FA device.Status pages got a massive upgrade
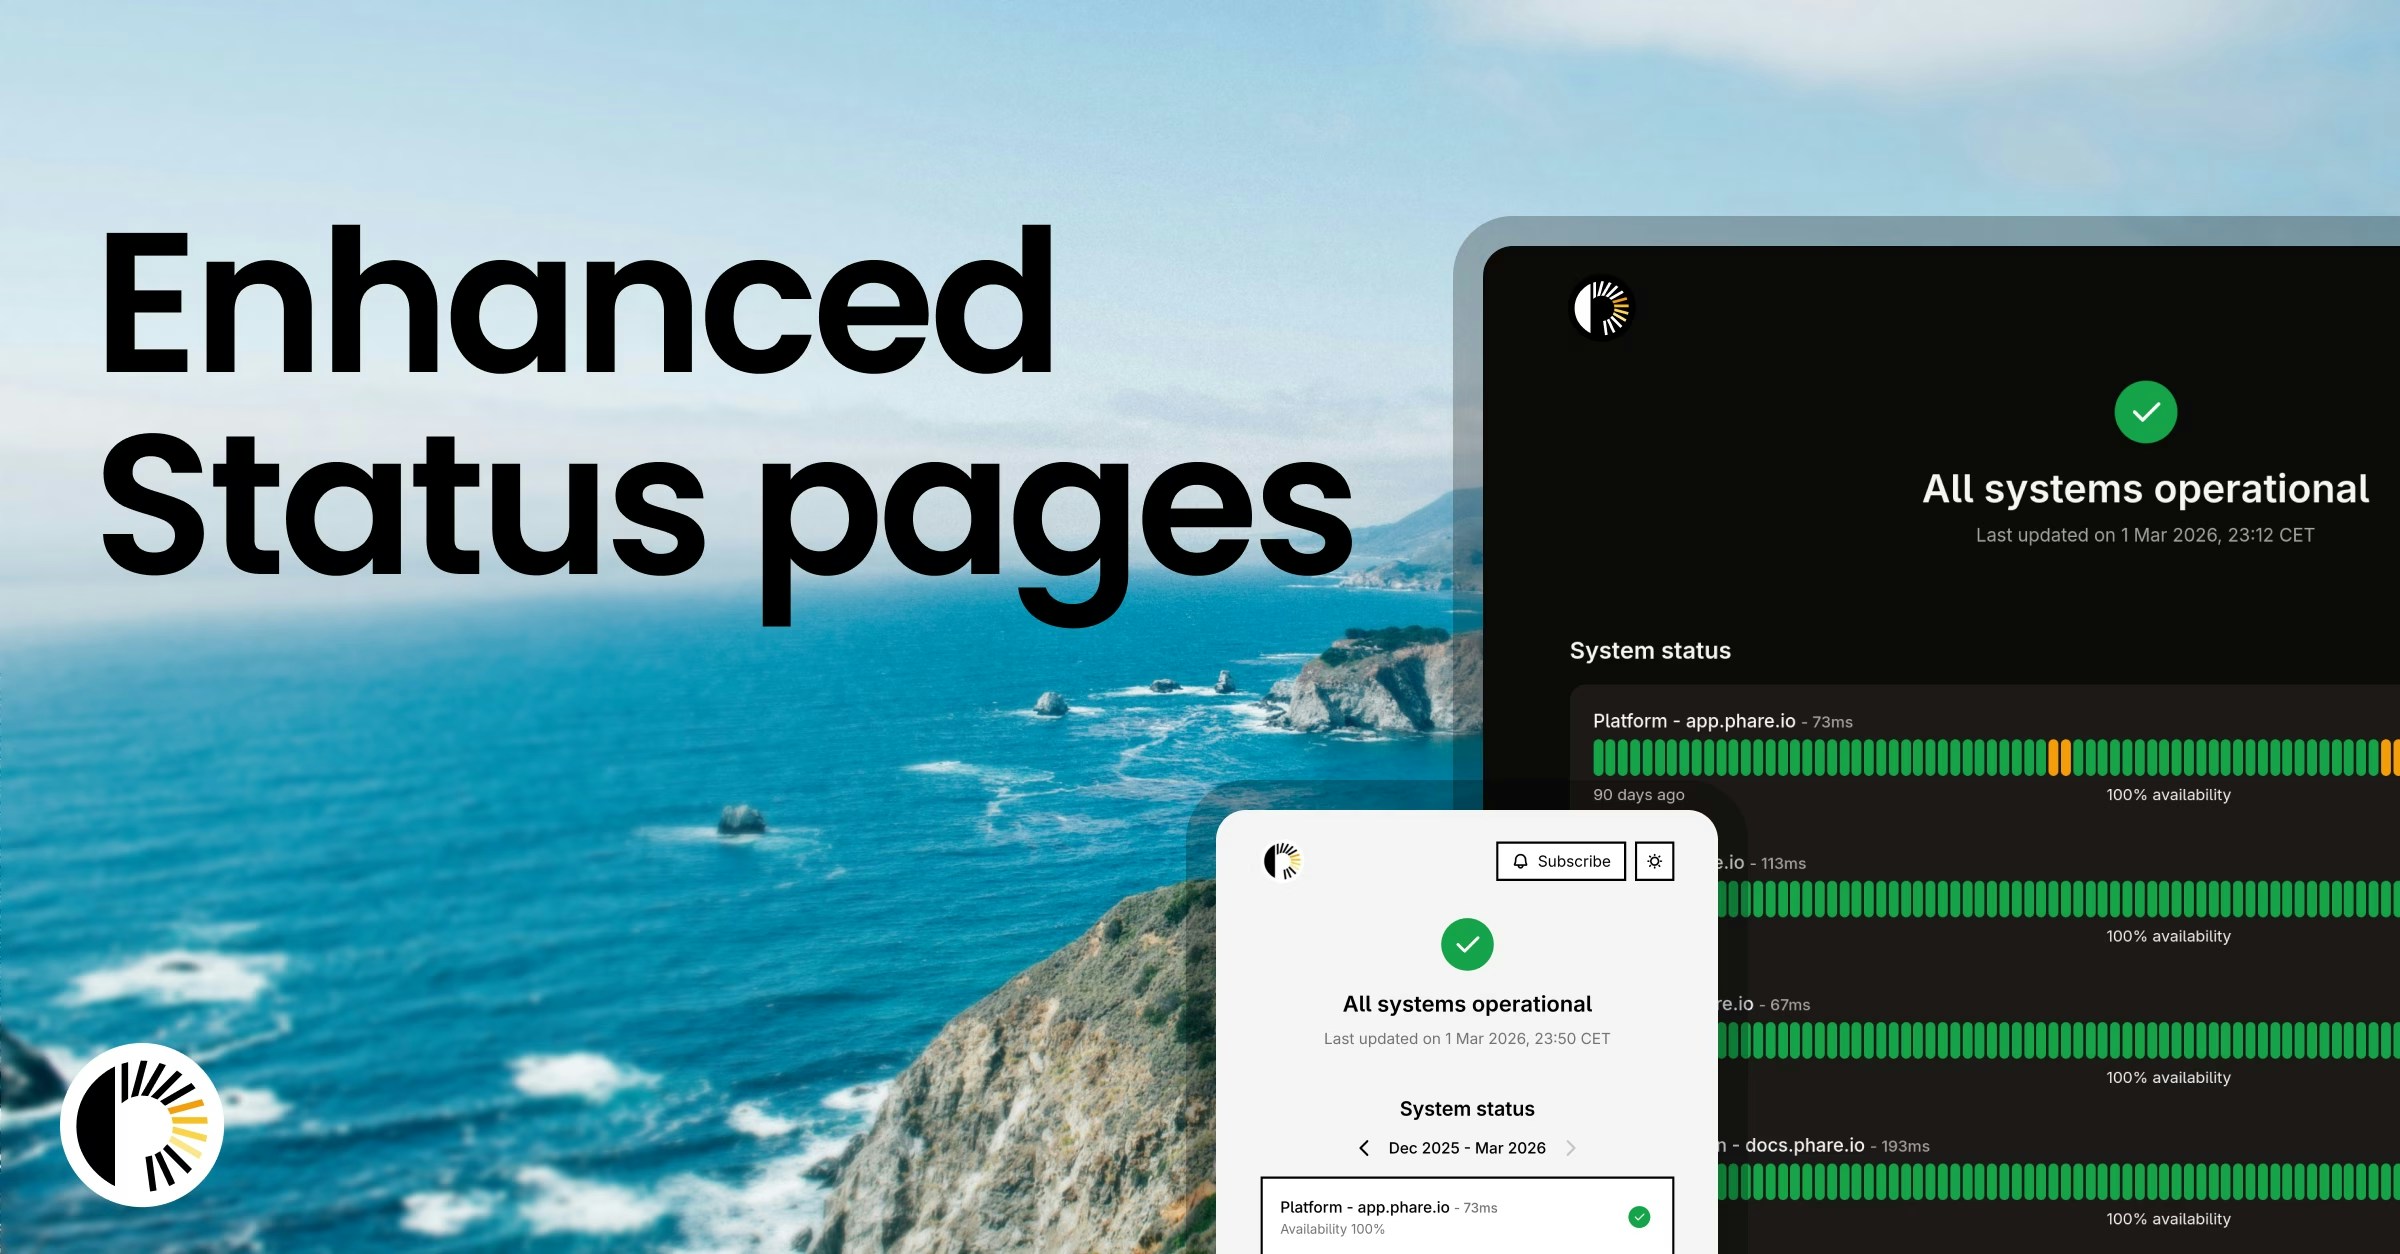
Phare’s status pages just received a major upgrade. You can now fully customise the design with adjustable text and background colours, rounded or squared layouts, and flexible border styles to properly match your brand. And more importantly, DARK MODE IS FINALLY HERE, easier on the eyes and long overdue.There’s now a complete uptime and incident history view, so users can clearly see what happened and when. A new RSS feed also makes it simple to stream real-time updates straight into Slack.Phare status pages remain in the top 1% for carbon efficiency with an A+ rating.Monitor incidents datatable
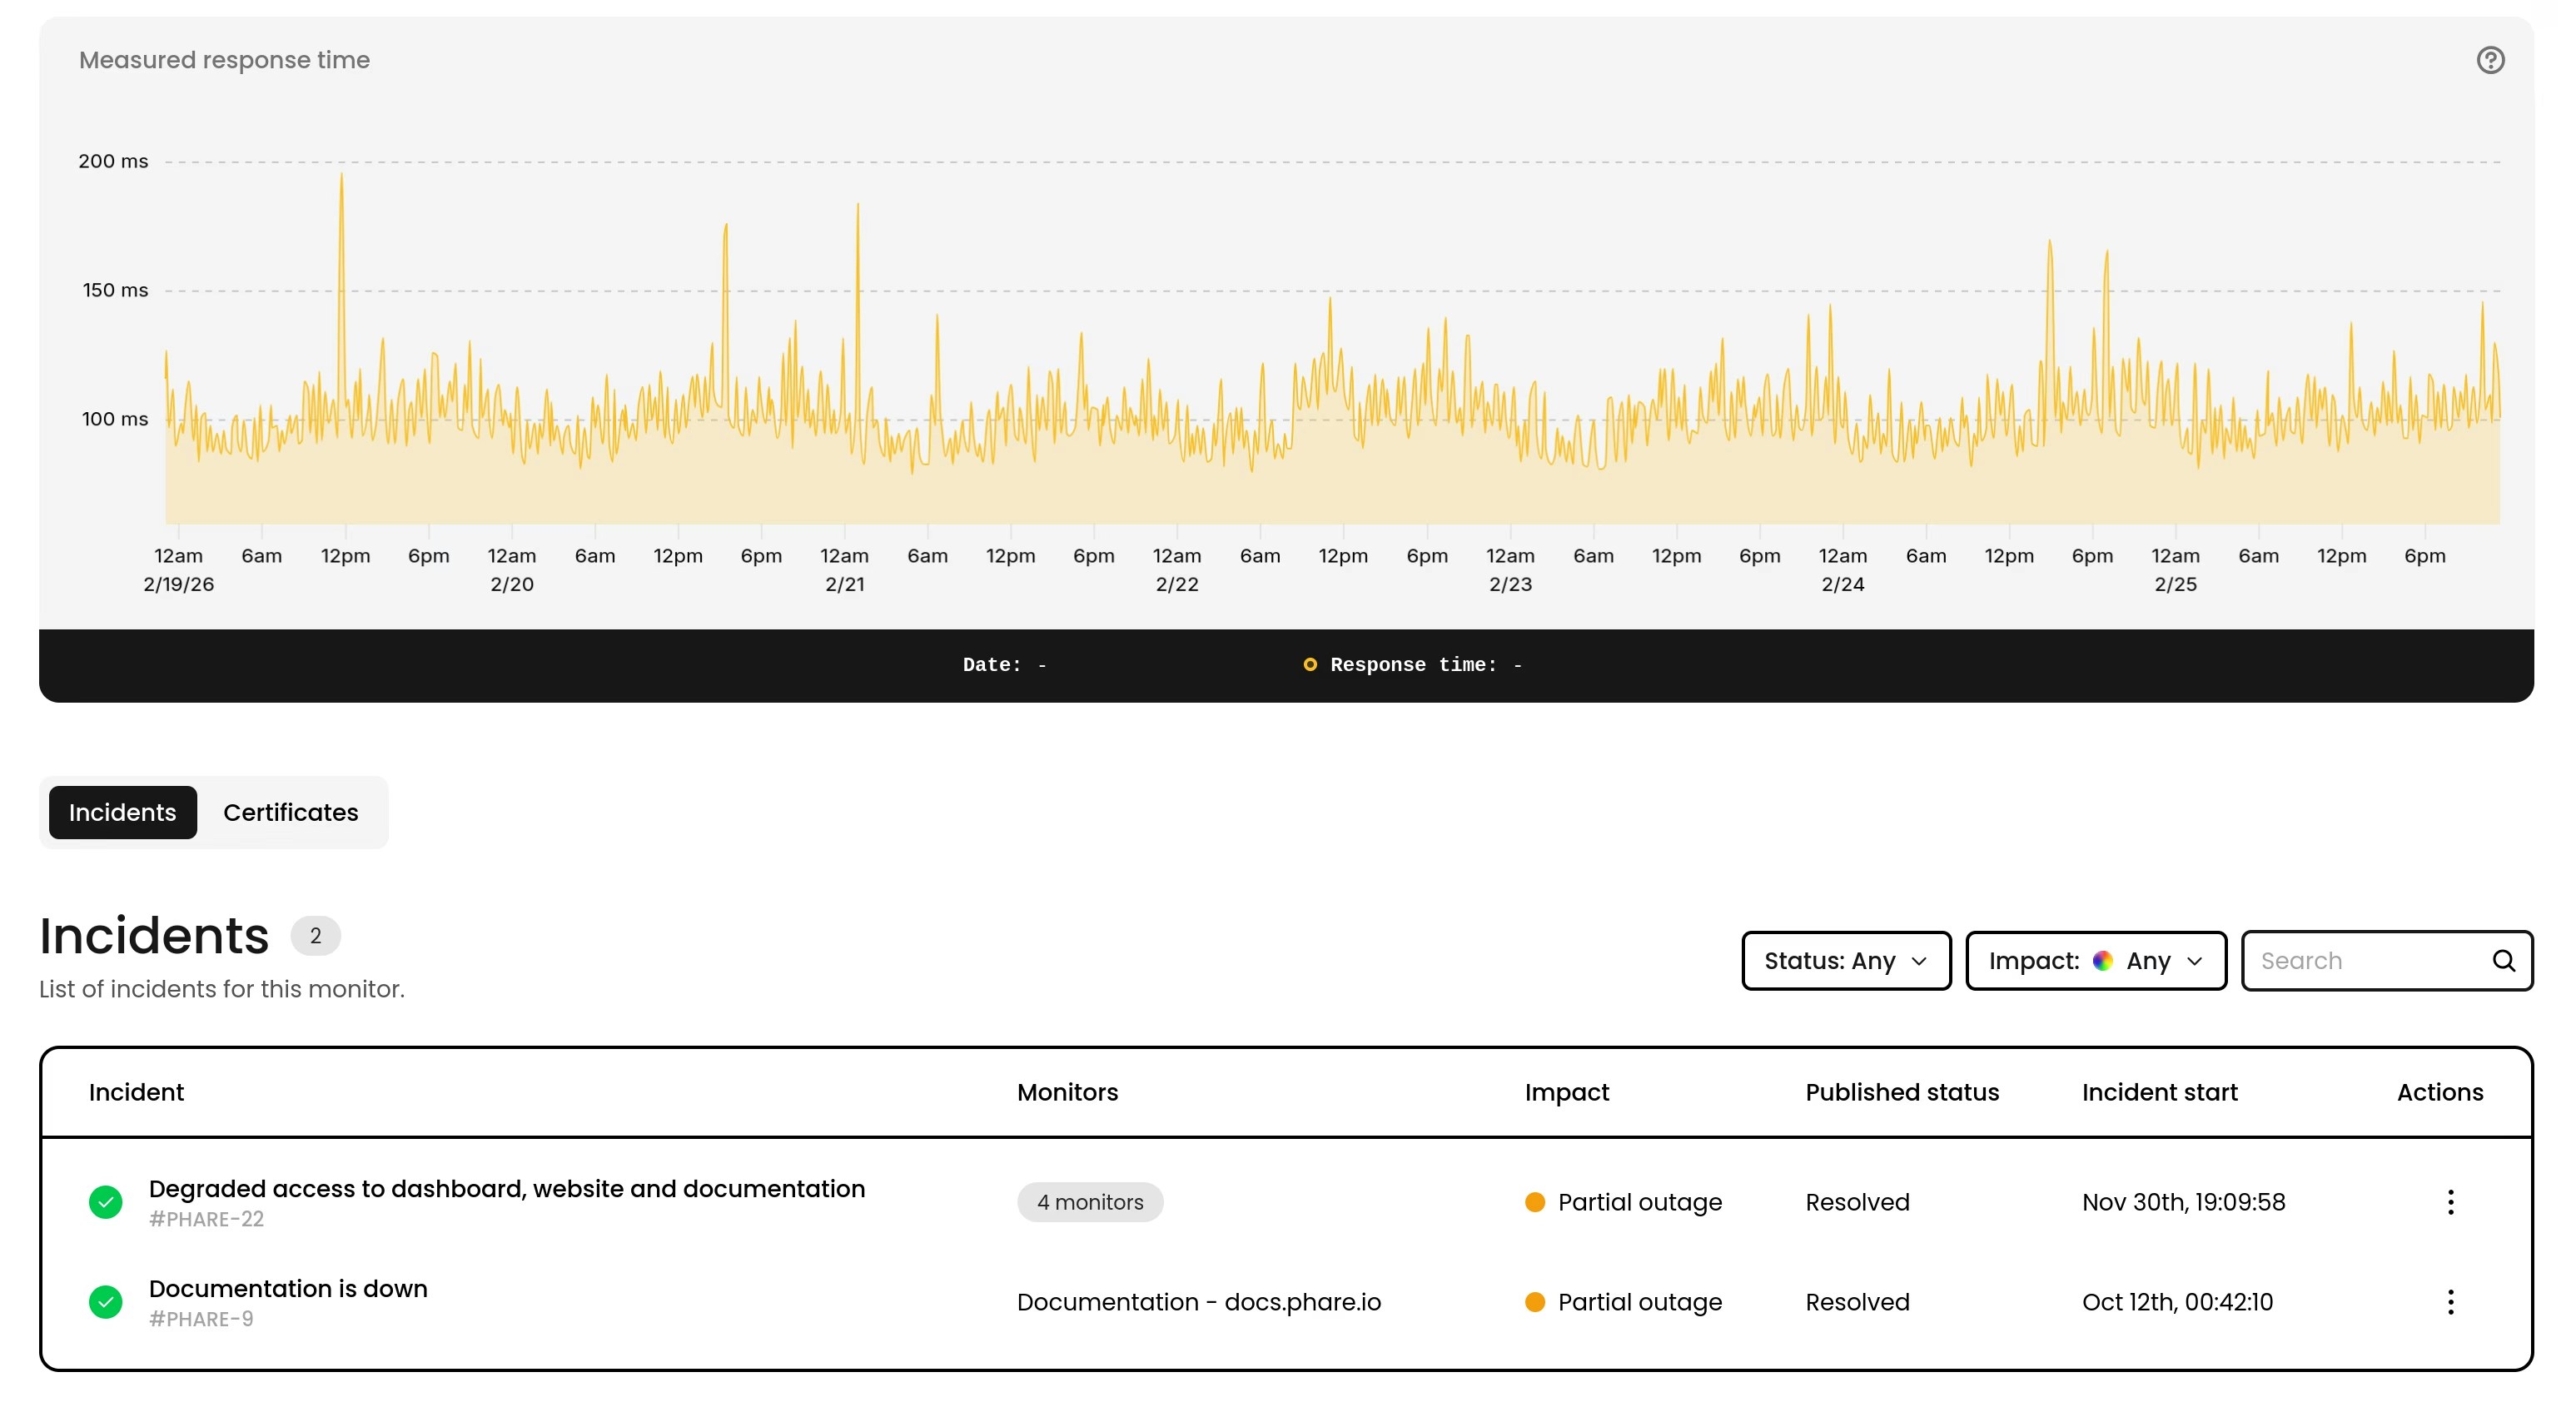
The monitor page now includes a datatable showing all incidents for that monitor. You can search, filter, and sort incidents directly from the table, making it easier to track and review past issues.Phare now has an official Terraform provider, available in beta. You can manage your projects, monitors, alert rules and status pages directly from your Terraform configuration. This has been one of the most requested features over the last three years, and it’s finally here after a huge amount of work.Check out the Terraform documentation to get started.New API endpoints for incident updates
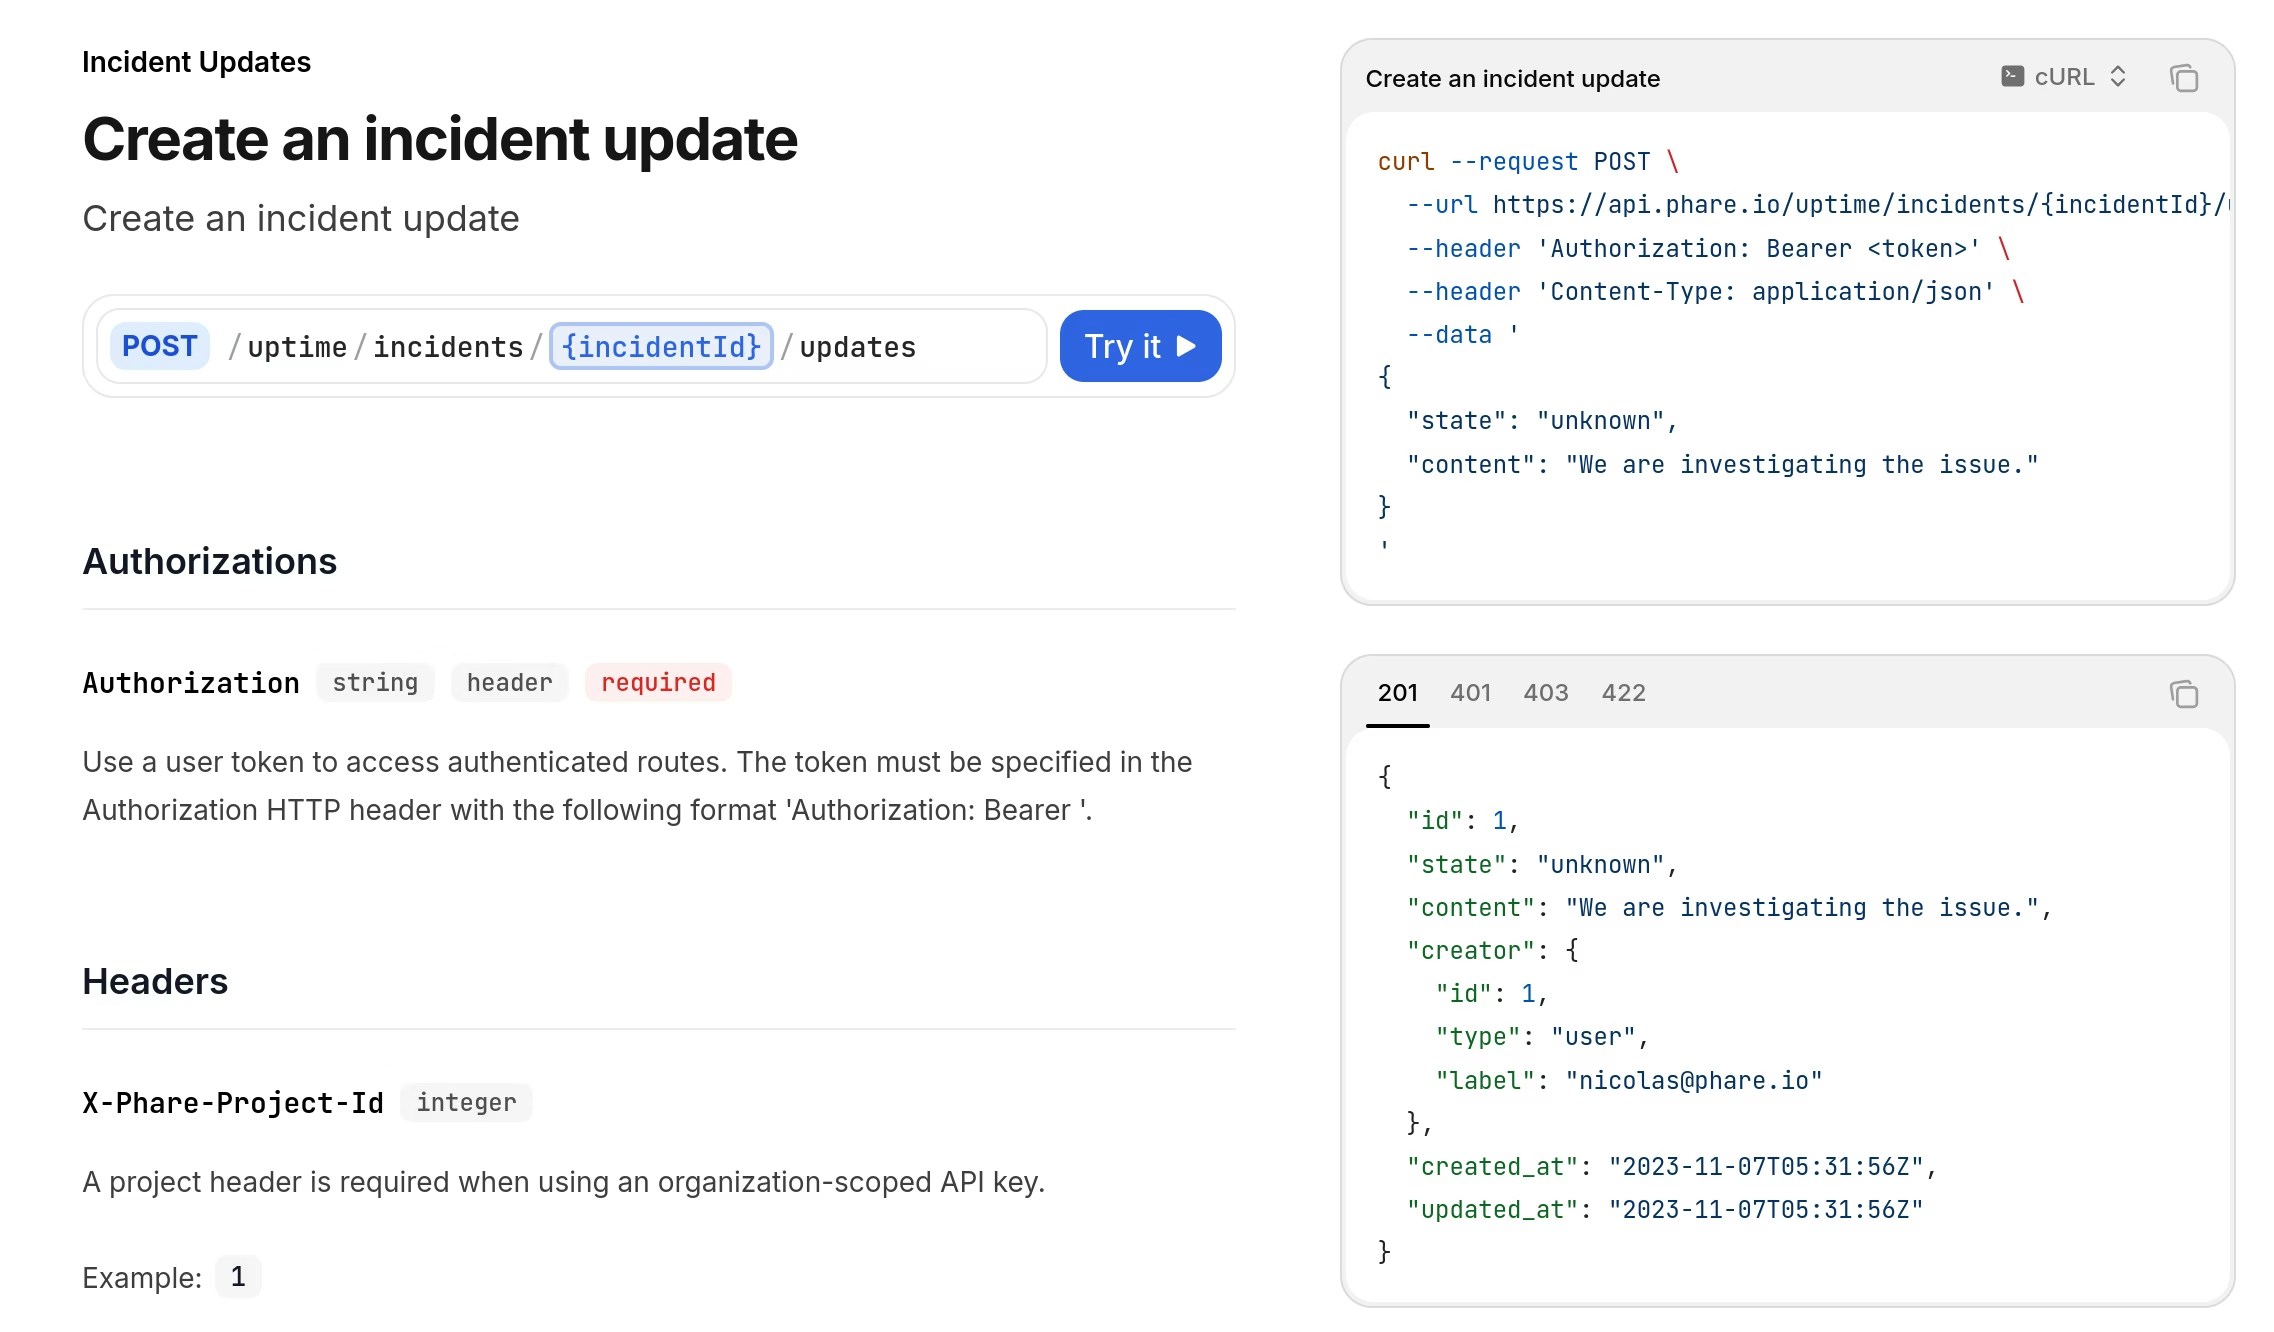
Five new API endpoints are now available to help you manage incident updates through the API:For organization-scoped API keys:Check out the Phare API documentation for all available endpoints.New API endpoints for project management
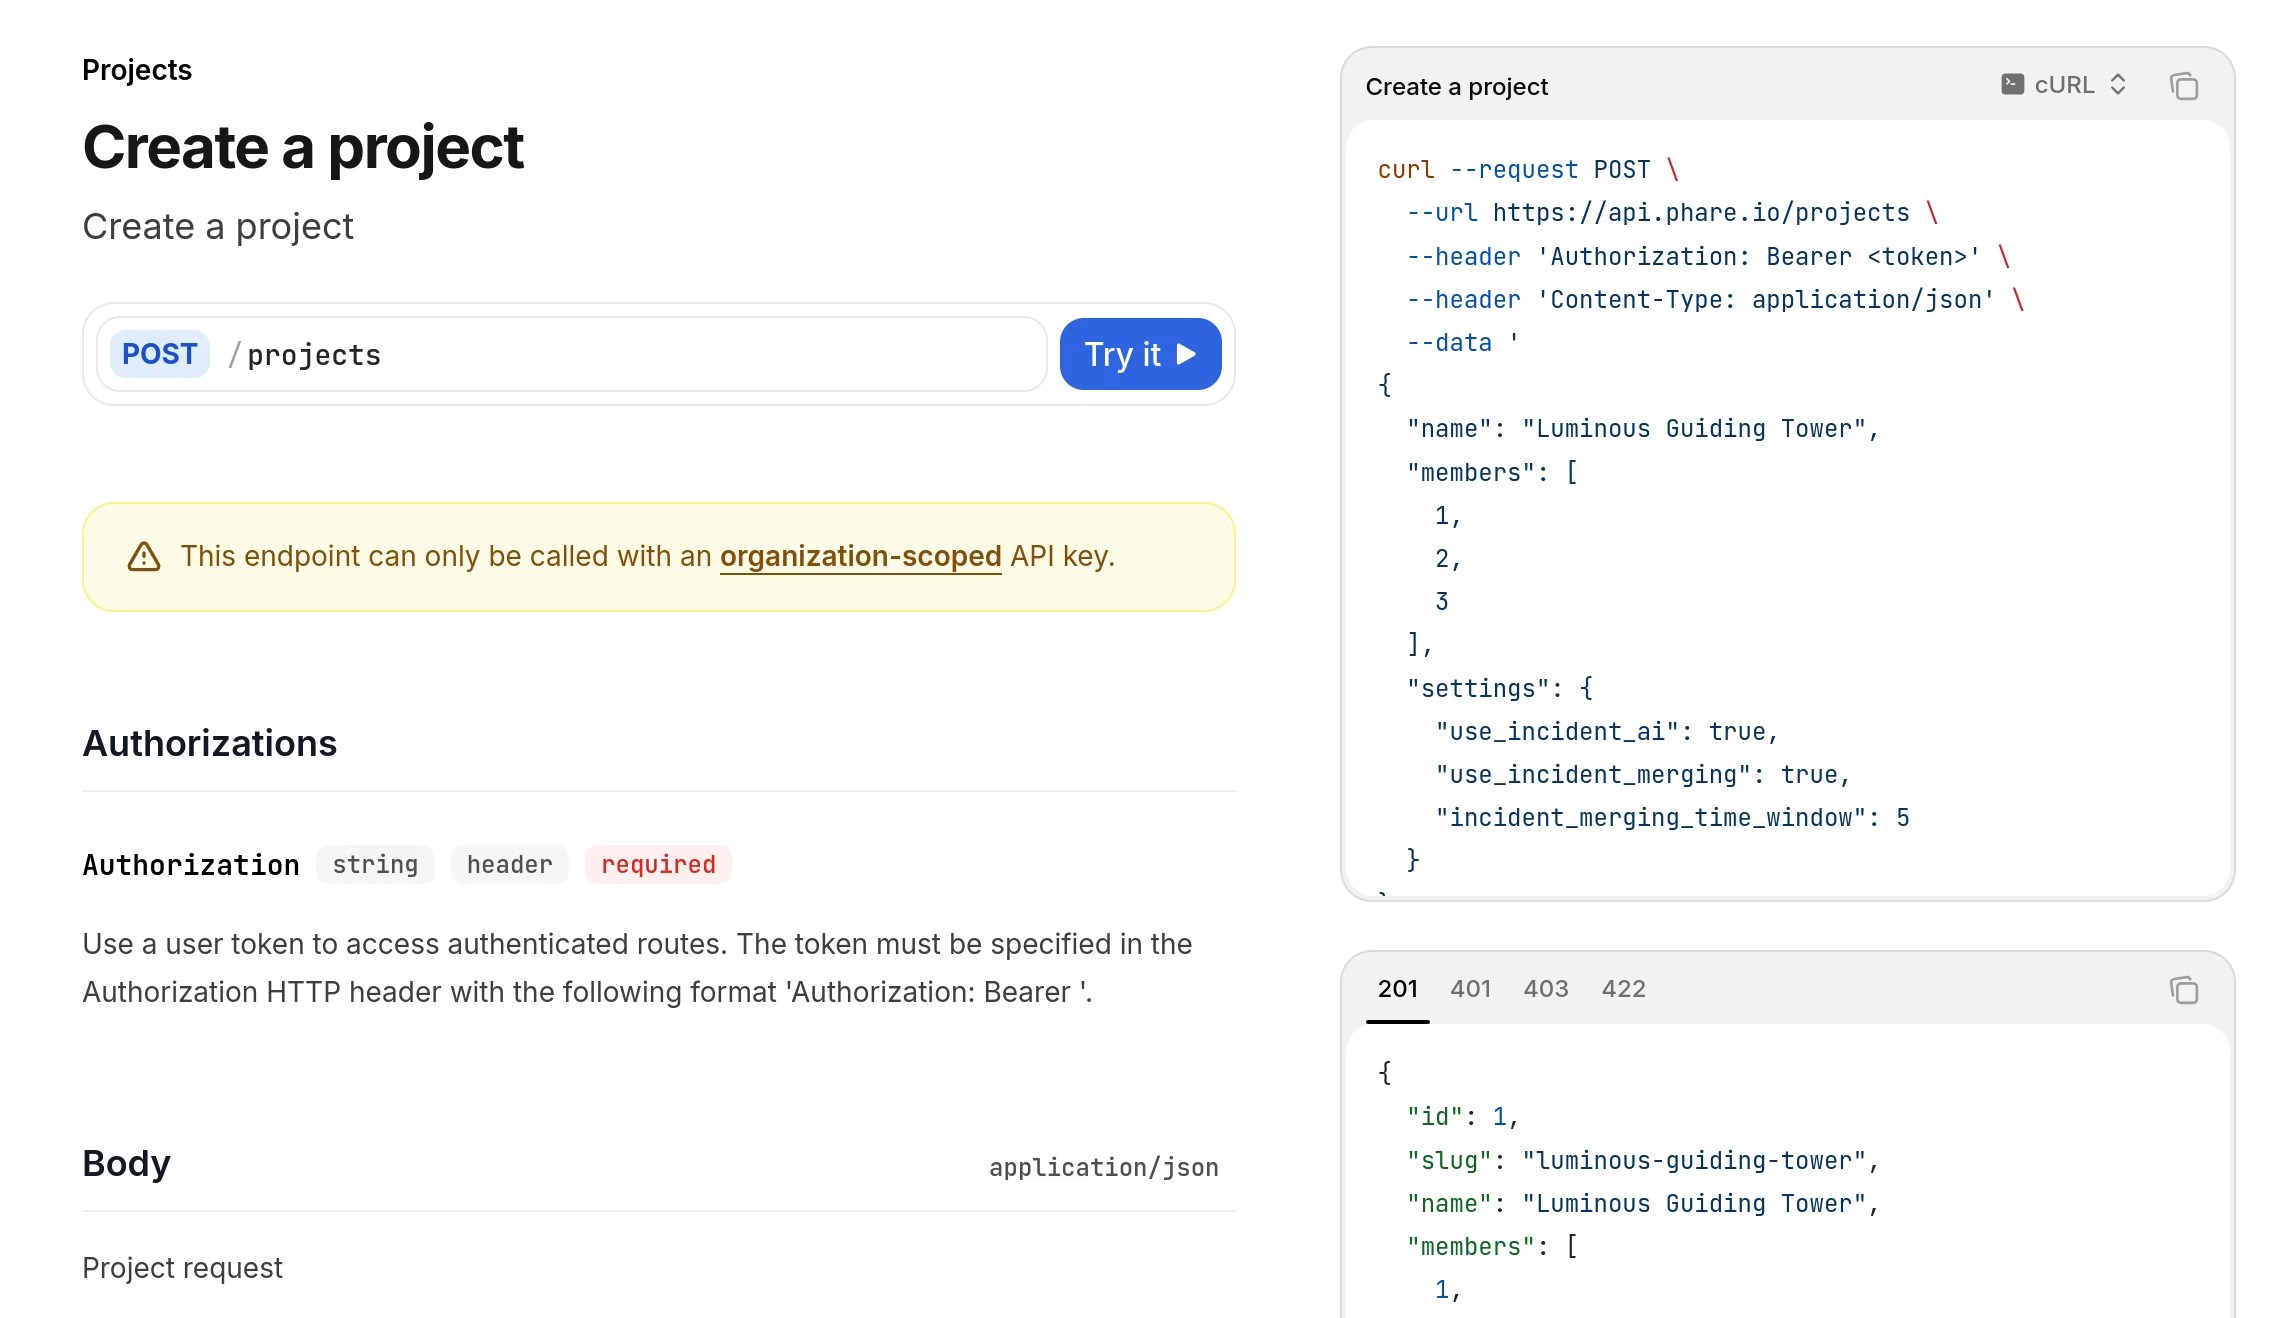
Five new API endpoints are now available to help you manage your projects directly through the API:For organization-scoped API keys:Check out the Phare API documentation for all available endpoints.Organization-scoped API keys
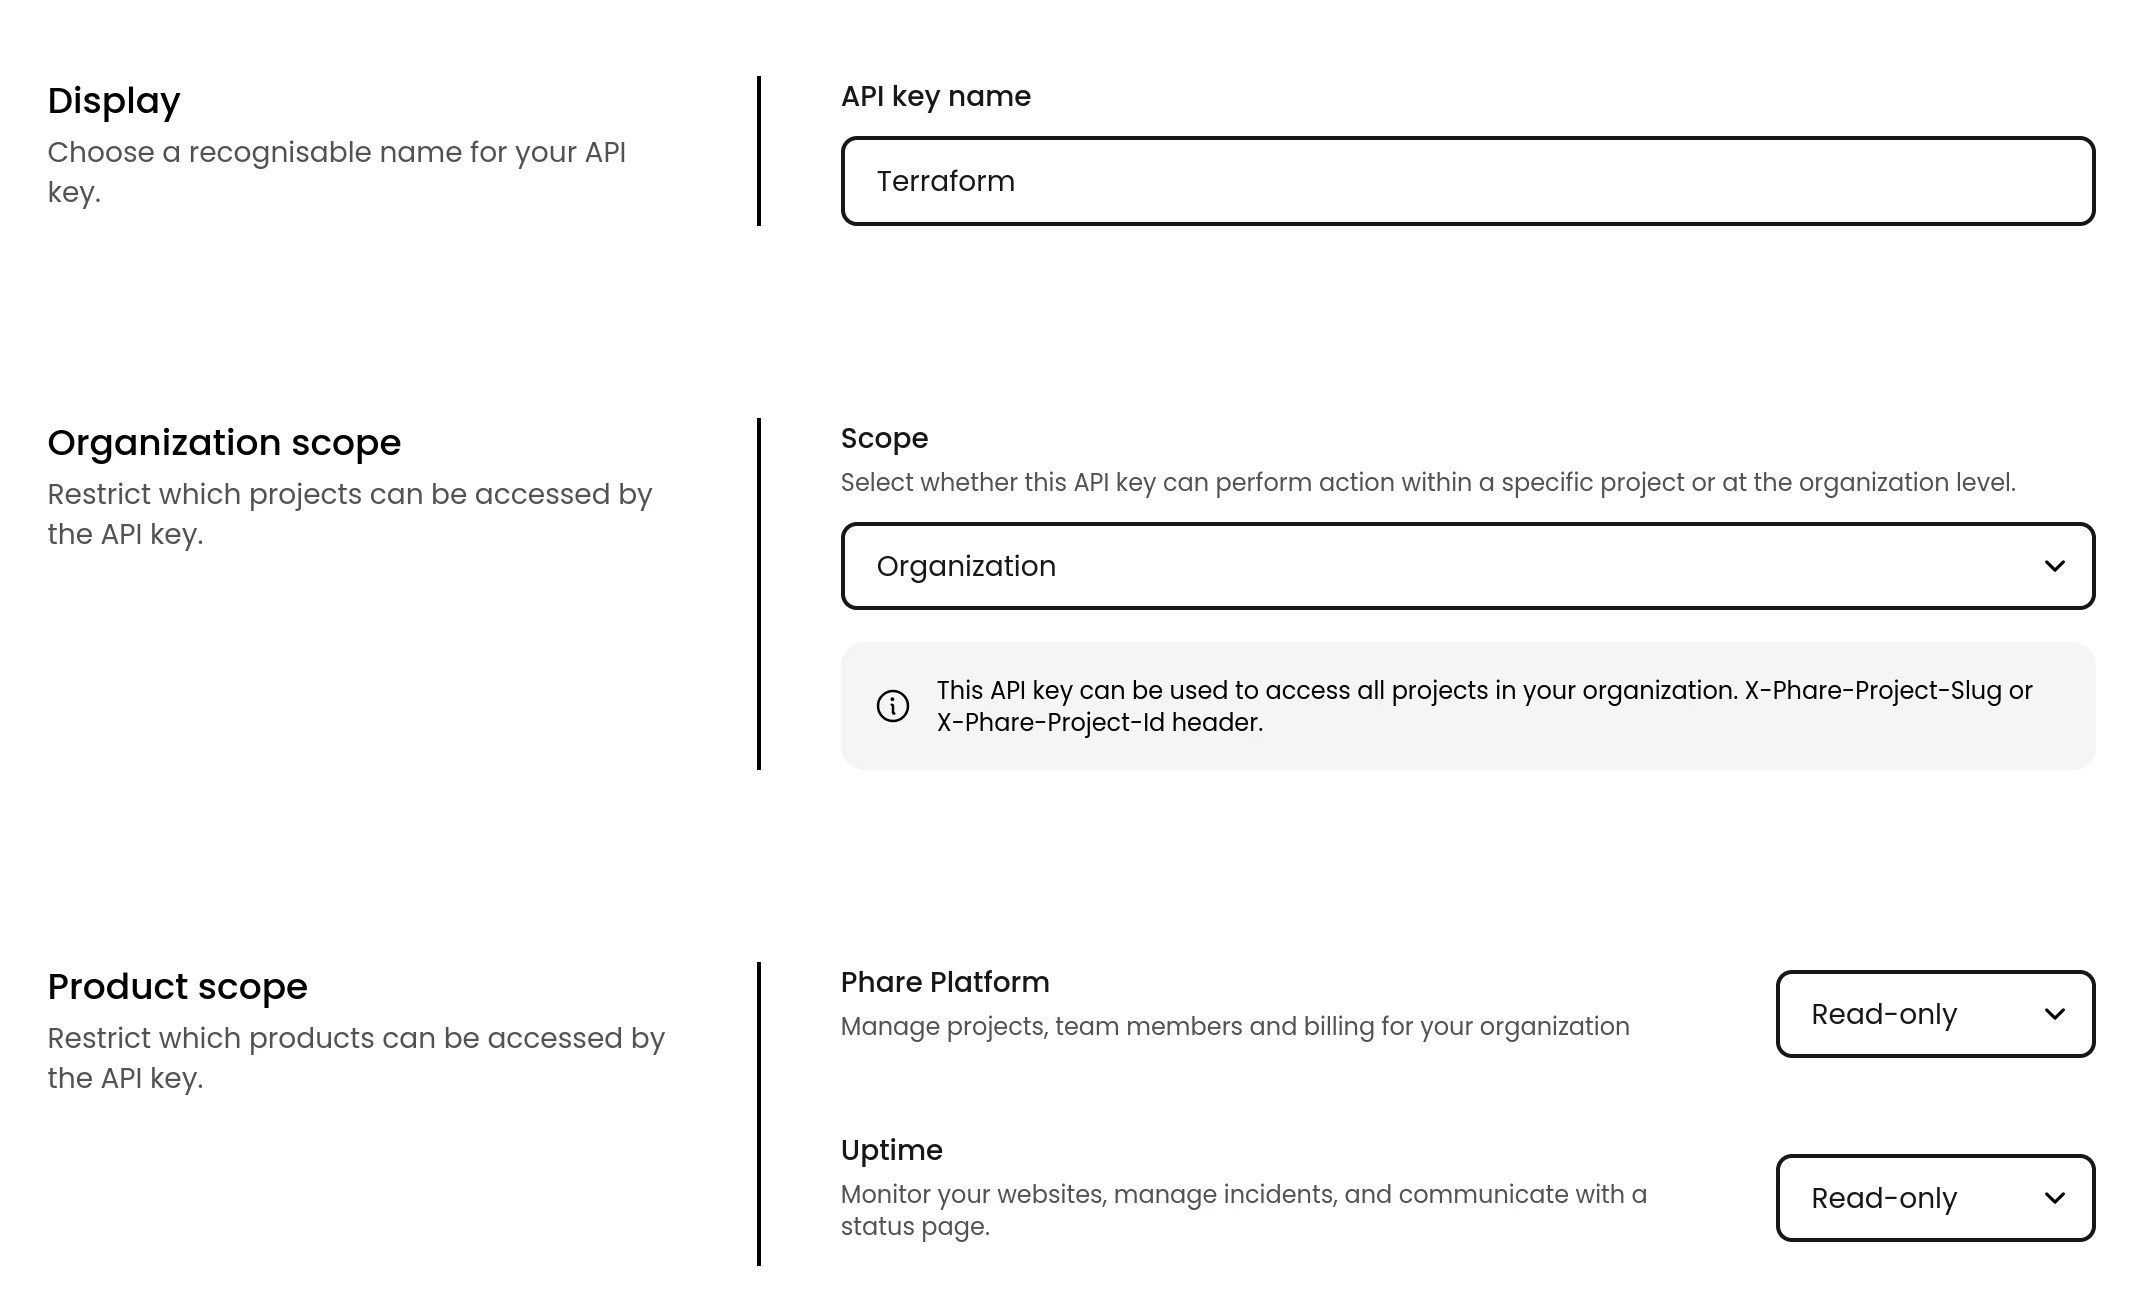
You can now create organization-scoped API keys. These keys provide access to all projects within your organization and allow full project management, including the ability to create and manage projects.Project-scoped API keys remain available and are still best for setups where projects must stay clearly separated, such as agencies or larger organizations.Organization-scoped API keys are ideal for small teams, startups, and infrastructure provisioning. Most API requests with these keys require a project selection header.New API endpoints for incident management
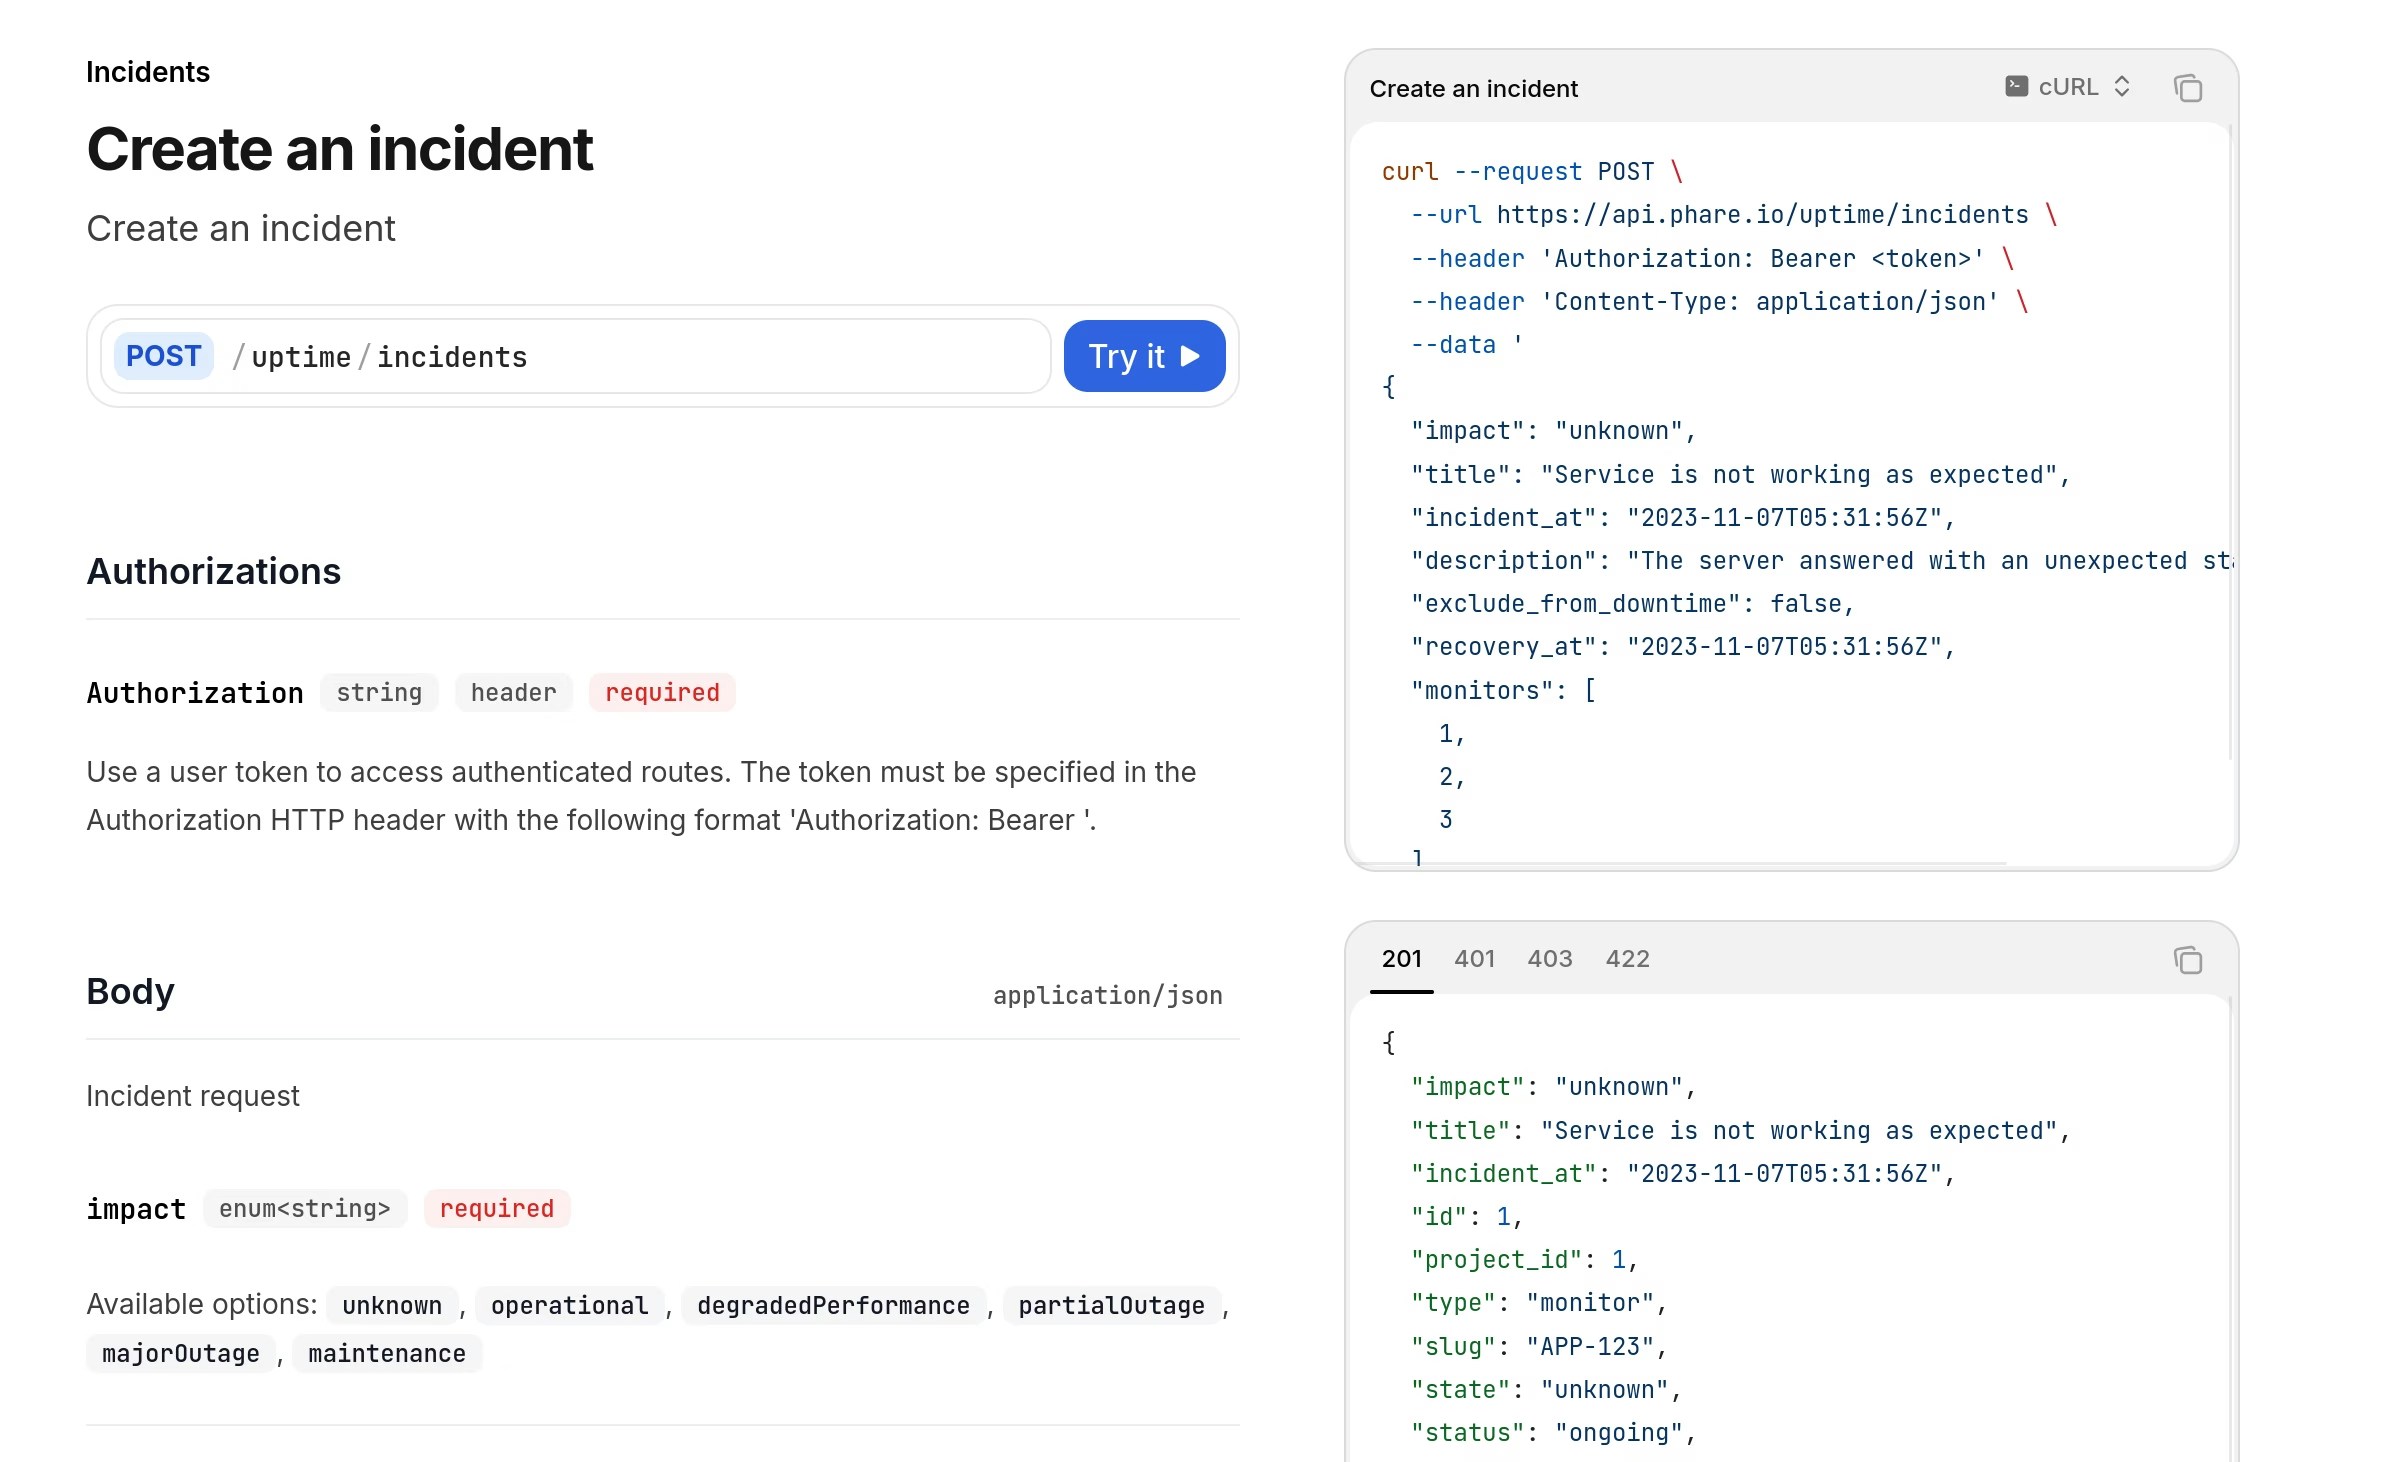
Three new API endpoints are available to give you more possibilities to automate your incident workflows:Check out the Phare API documentation for all available endpoints.More control over incident timing and history
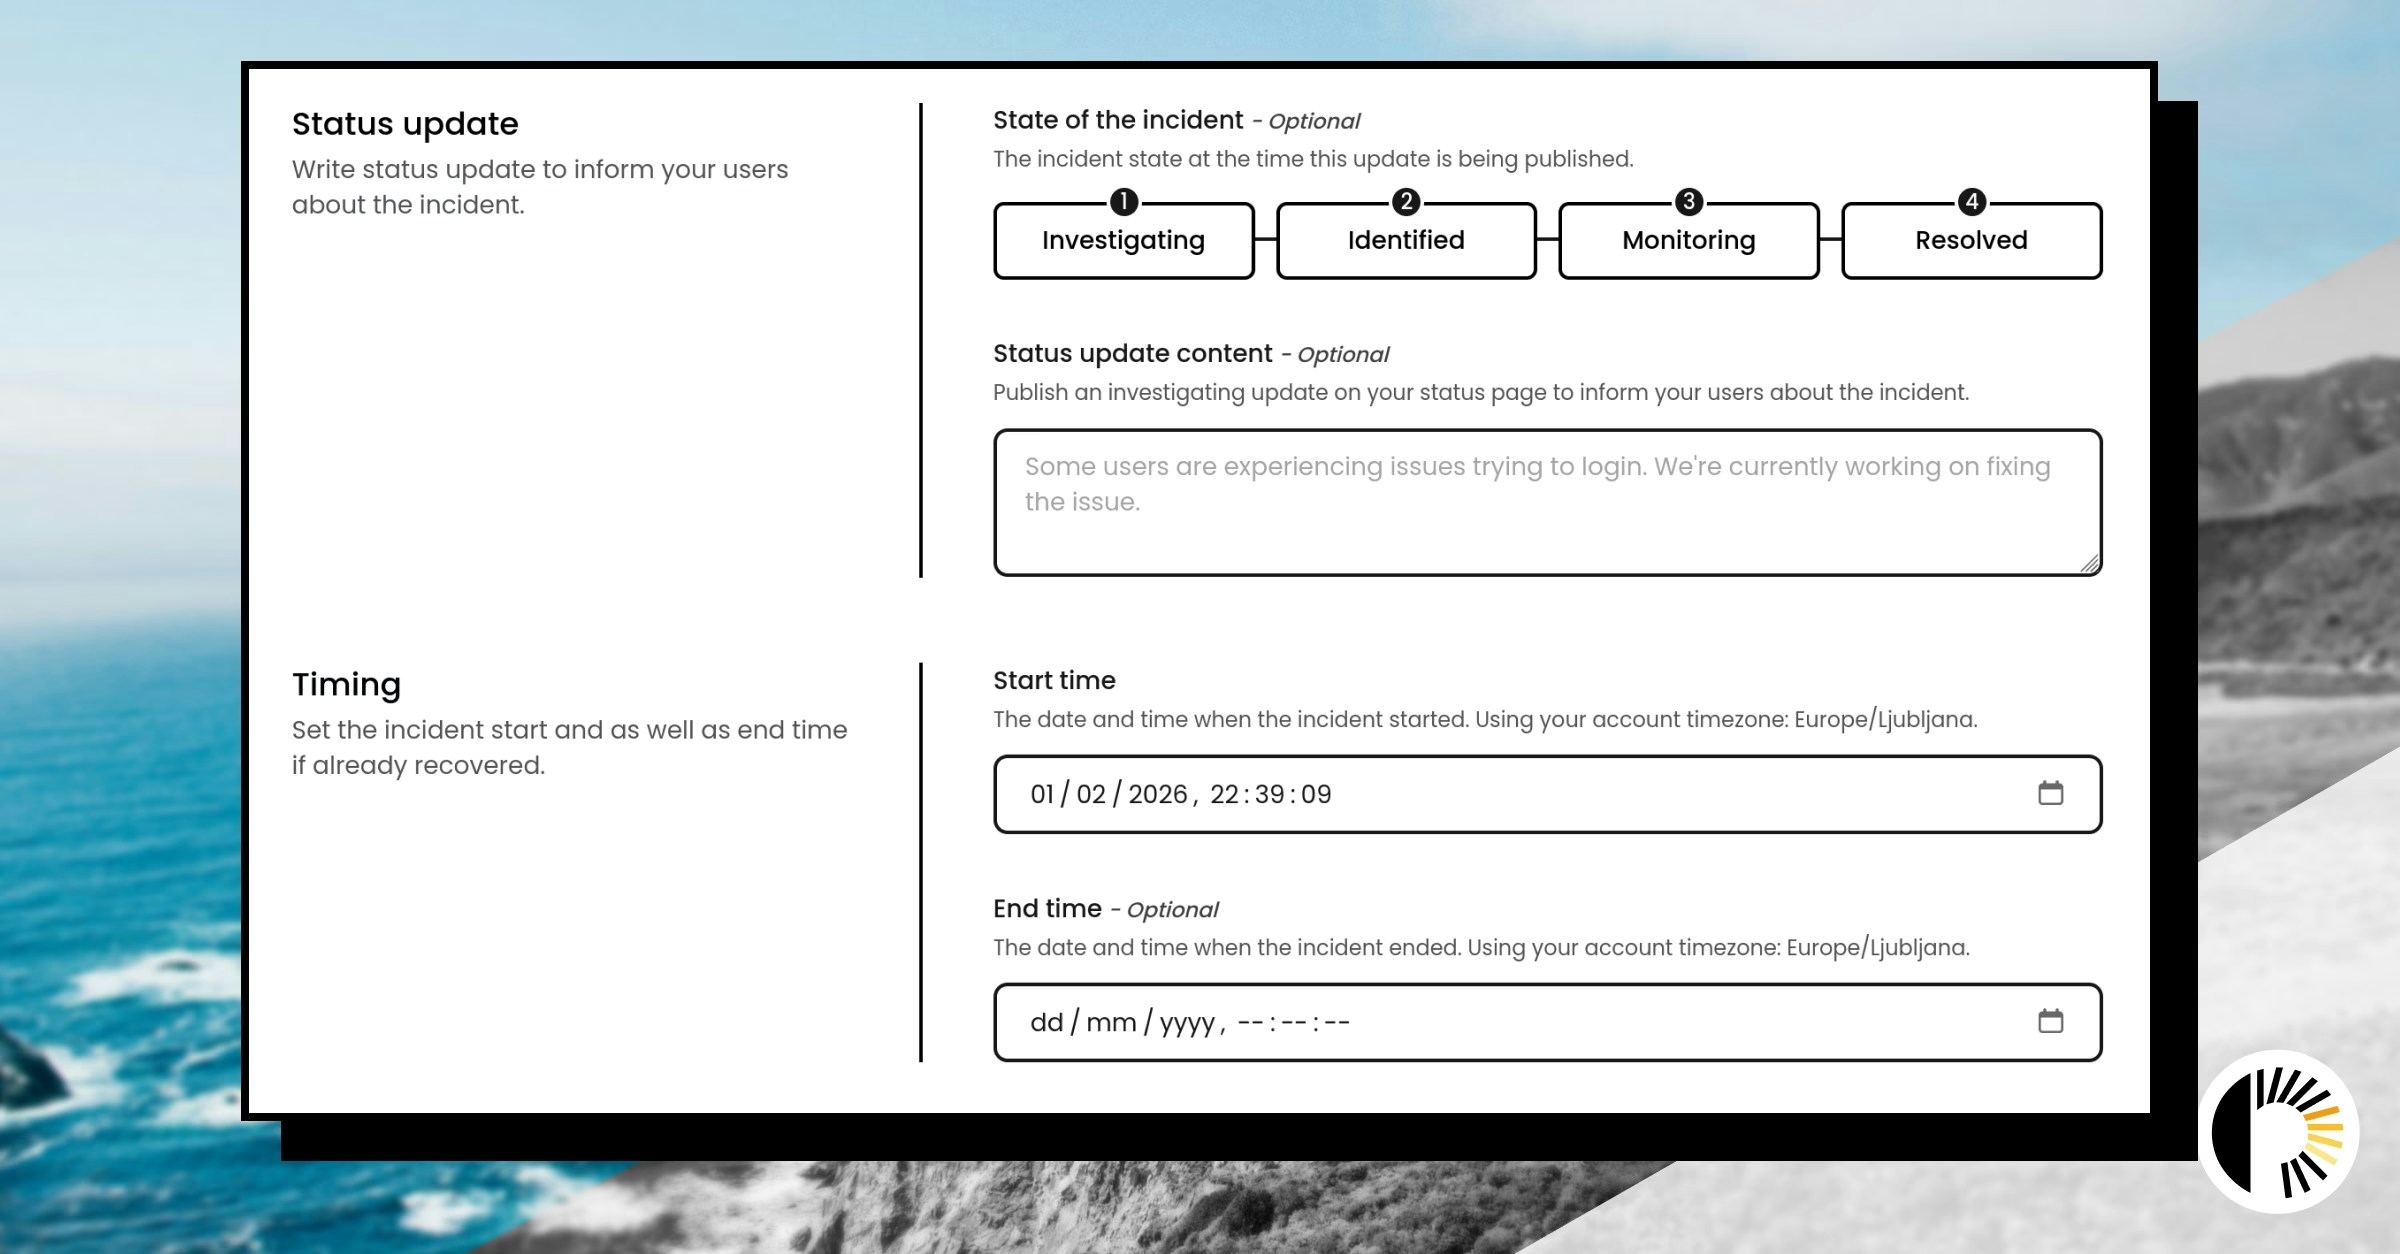
Incidents can now be created with precise start and end times, and existing incidents can be adjusted if the original timing was off. This helps keep status pages accurate when something was detected late or when special circumstances change how an incident should be reported.It’s also now possible to choose what type of status page update should be published at creation time. This is just a shortcut: all update types can still be posted later if needed.SMTP ports now available for monitoring
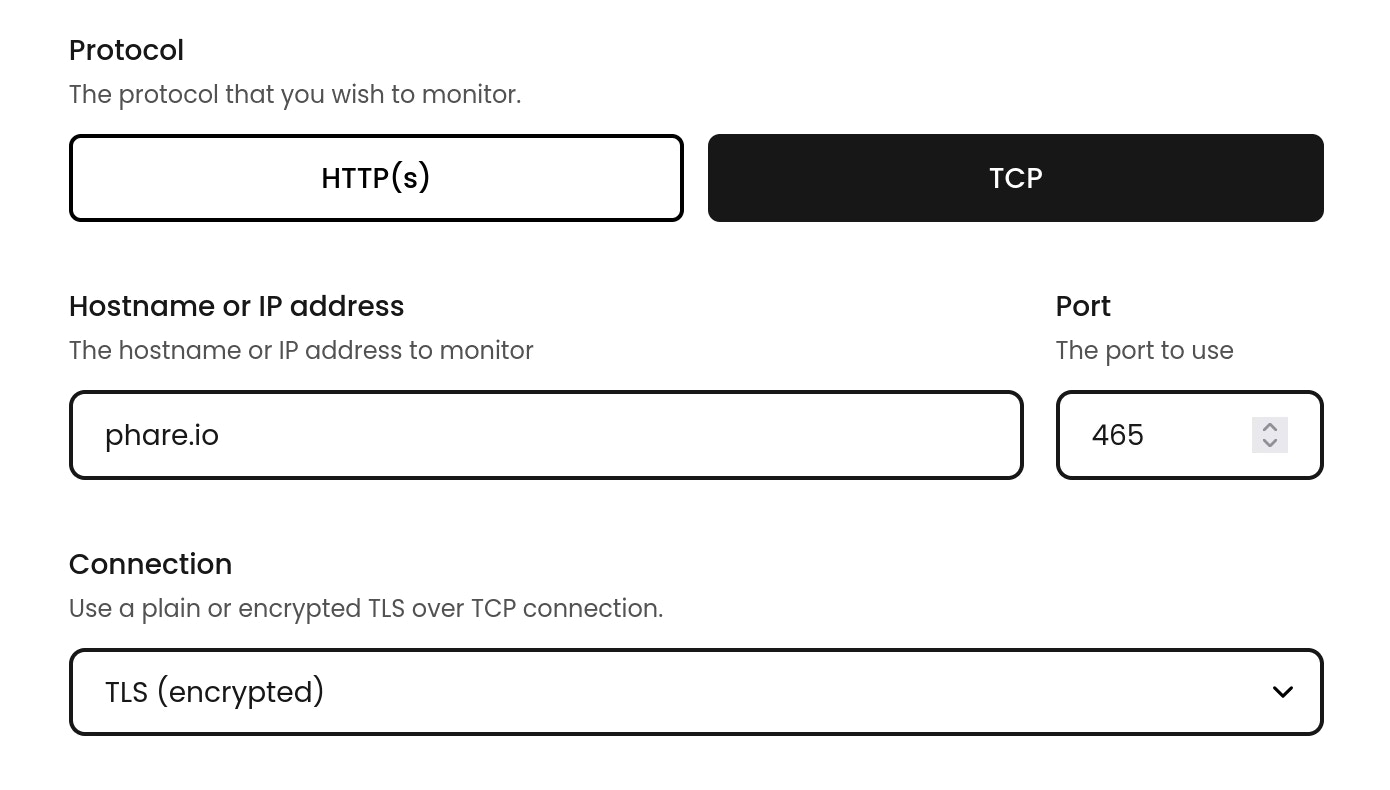
SMTP ports can now be monitored like other services over TCP. The usual ports are supported: 25, 465, 587, and 2525, making it easier to keep an eye on your in-house mail servers.Improved webhook JSON editor
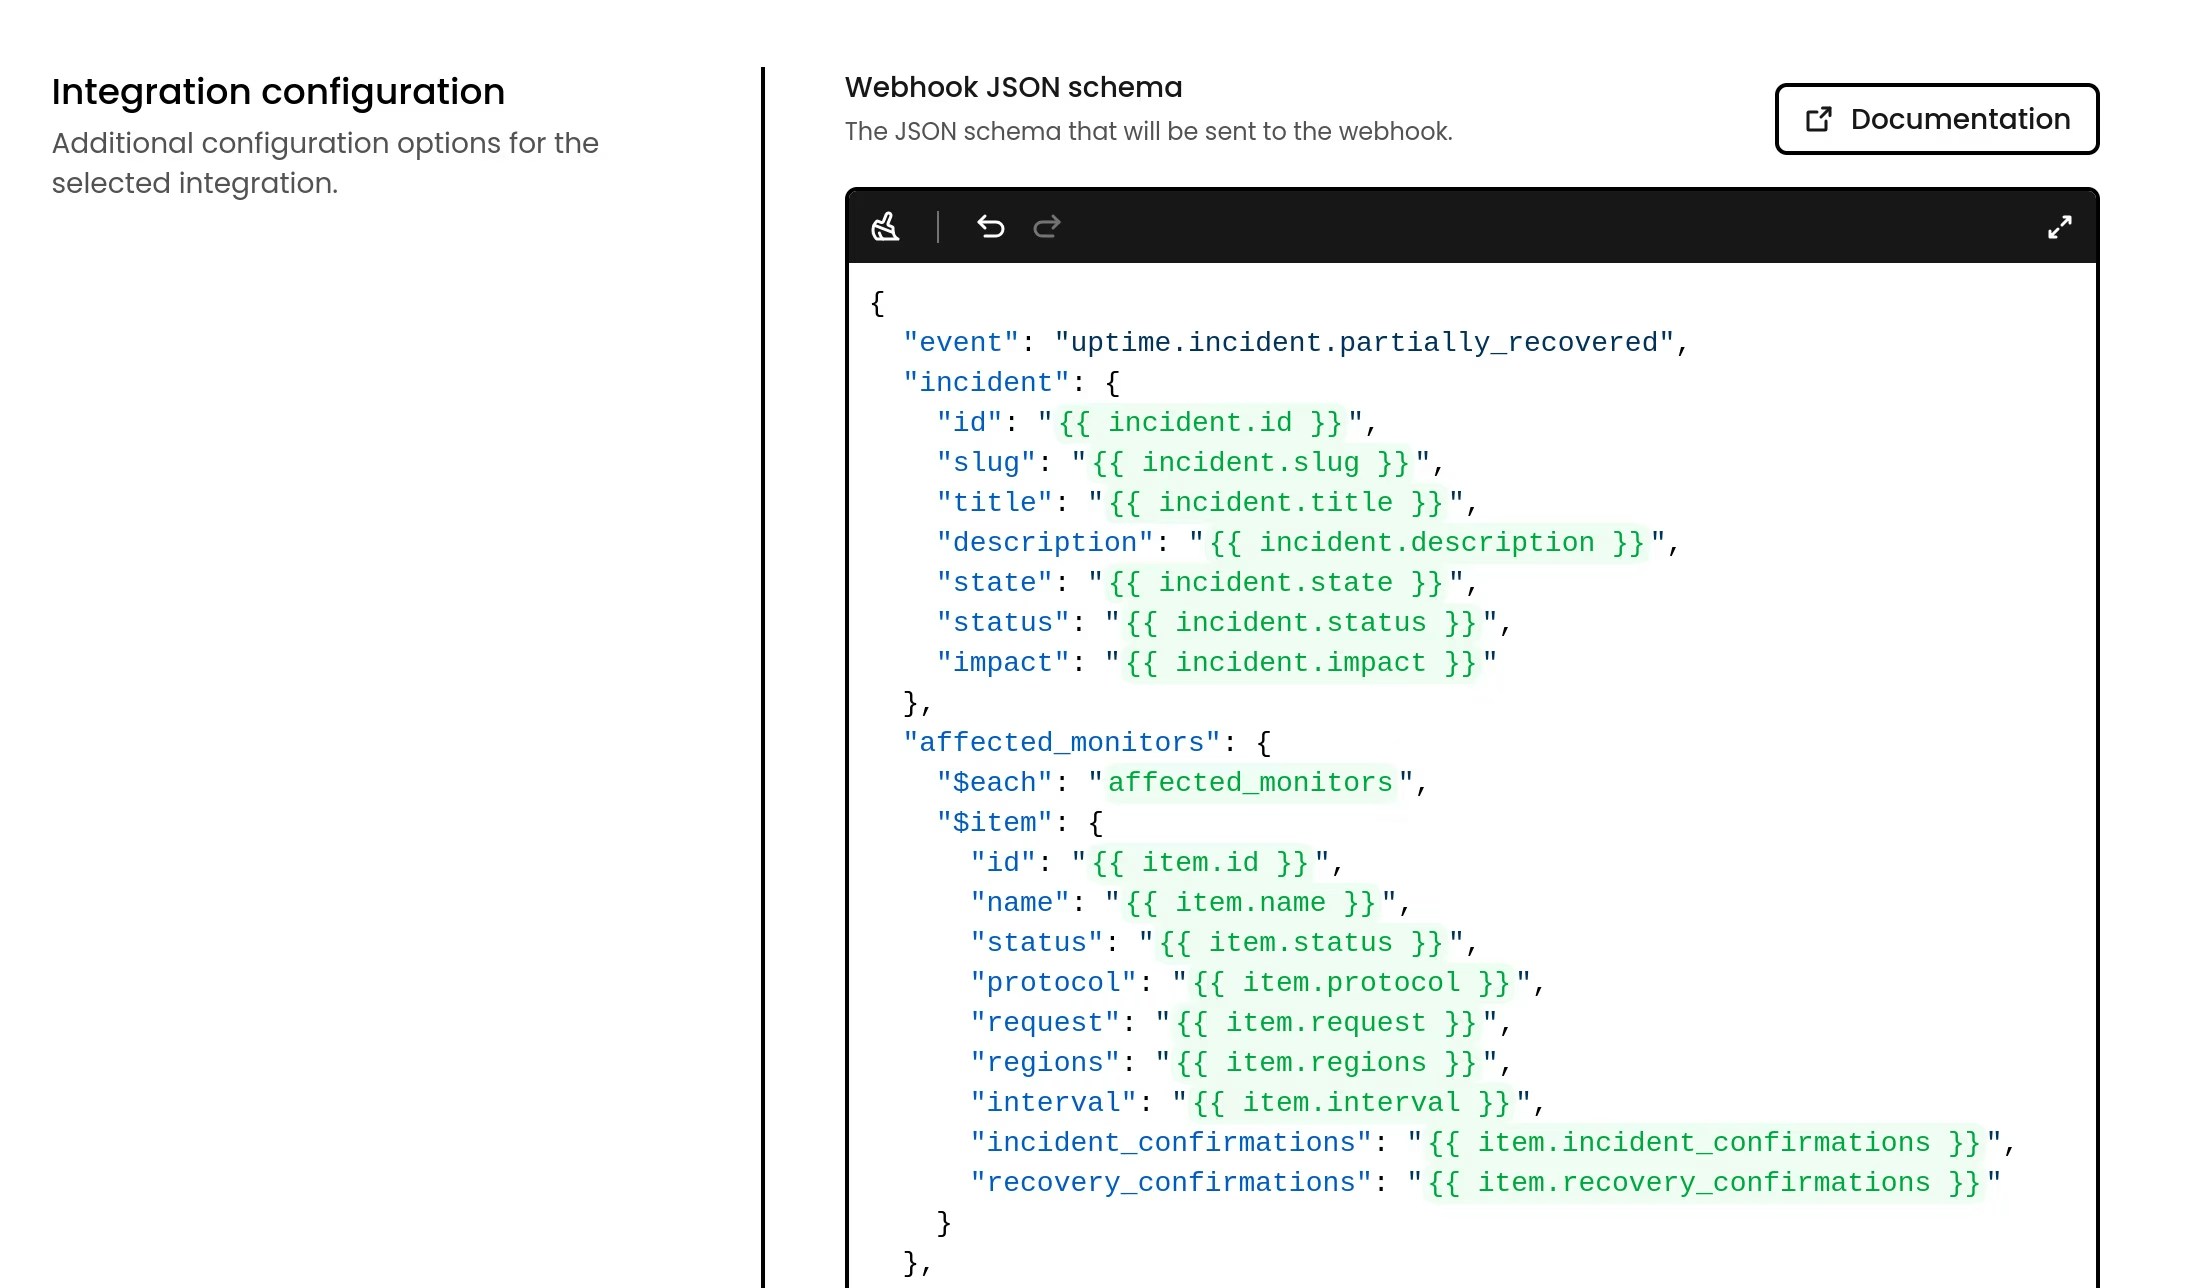
The JSON editor to customize outgoing webhook payloads now highlights valid placeholders and loop names, warns on invalid tokens, and suggests available entities and properties as you type.Editing is smoother too: new lines are pre-filled, error handling is clearer, and the editor can expand for large schemas.It’s like a small handcrafted IDE inside Phare 🌞Outgoing webhook schema upgrades
Schemas now support loops, and the default schemas for every alert event have been revamped to expose richer data out of the box. The new placeholder syntax uses {{ entity.property }} and is documented in the Outgoing Webhooks docs.Improved notification preferences
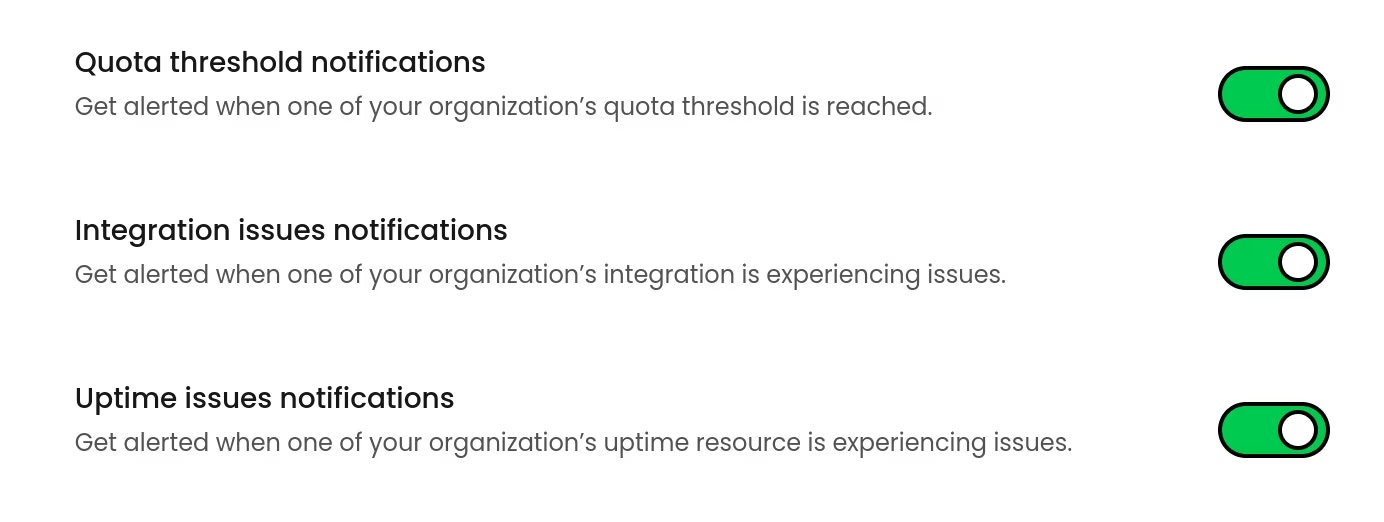
Important organization-level notifications are now sent to all admins, not just the organization owner. In addition, every user can opt out of individual notification types from personal settings.This removes the single-owner bottleneck while keeping you in control of what lands in your inbox.Custom quota notification thresholds
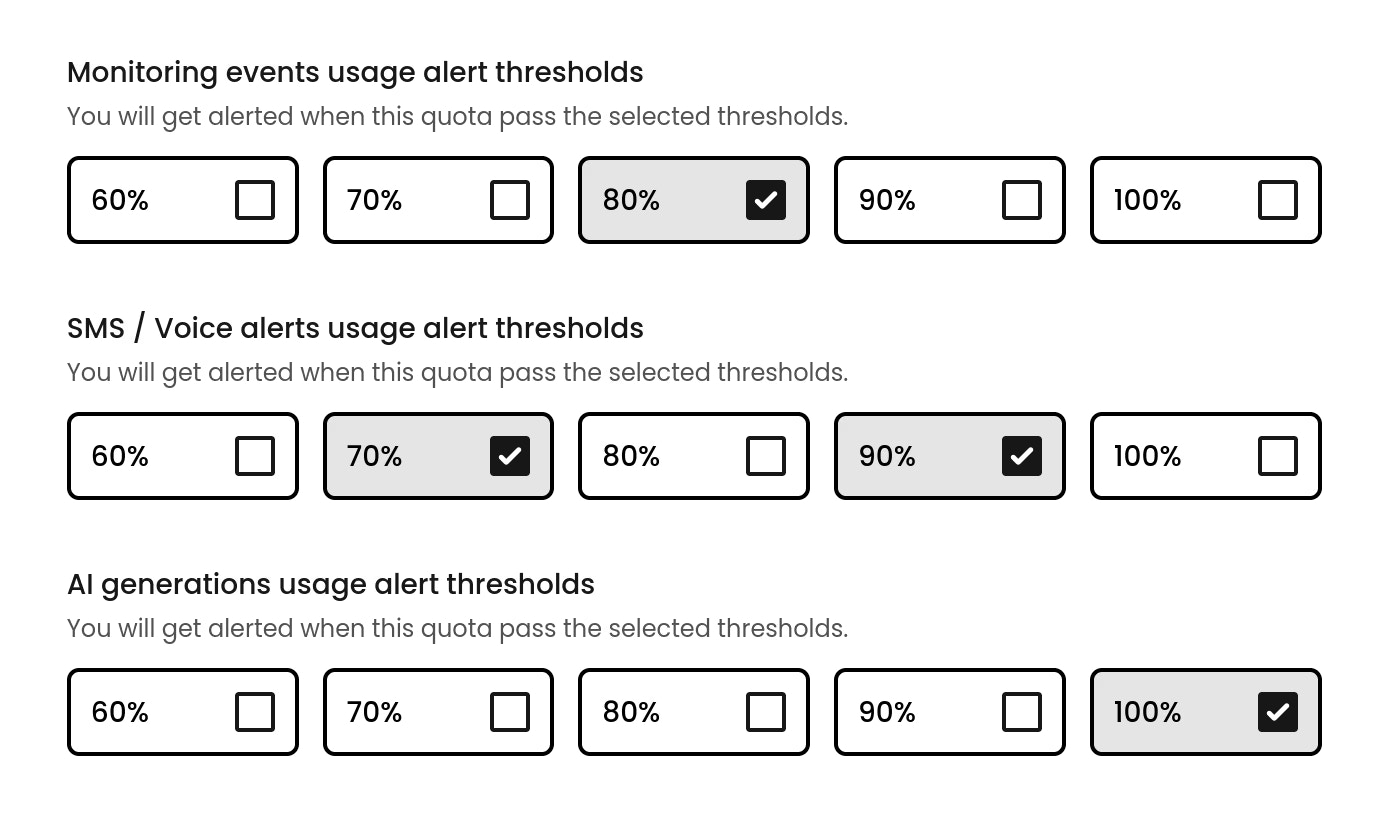
Notification thresholds for billable quotas are now fully configurable. Instead of fixed alerts at 80% and 100%, each quota can trigger notifications at values that actually match how you monitor usage.This is useful if you want earlier warnings for critical quotas or fewer alerts for ones you don’t care about.Legal and billing emails per organization
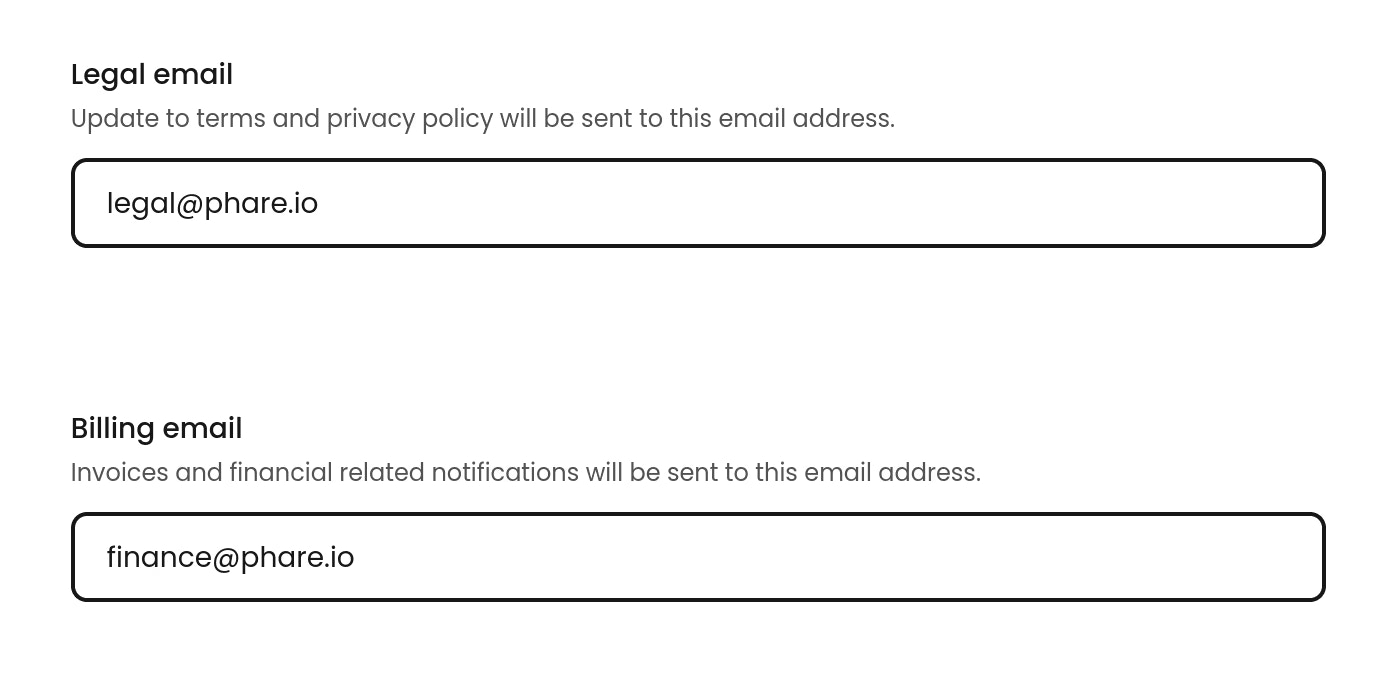
Organizations can now configure separate Legal and Billing email addresses. The legal email is used for privacy policy and terms of service updates, while the billing email receives invoices and other payment-related notifications.If your legal and finance departments are actually just you, feel free to send both emails to yourself and role-play.Native ilert integration
Phare now integrates natively with ilert! Connect your ilert account to receive incident alerts directly in your existing incident management workflow, ensuring your team stays informed and can respond quickly to any issues.Read more about the ilert integration in the documentation.Last modified on July 30, 2026