Shield status badges
December 23rd, 2024
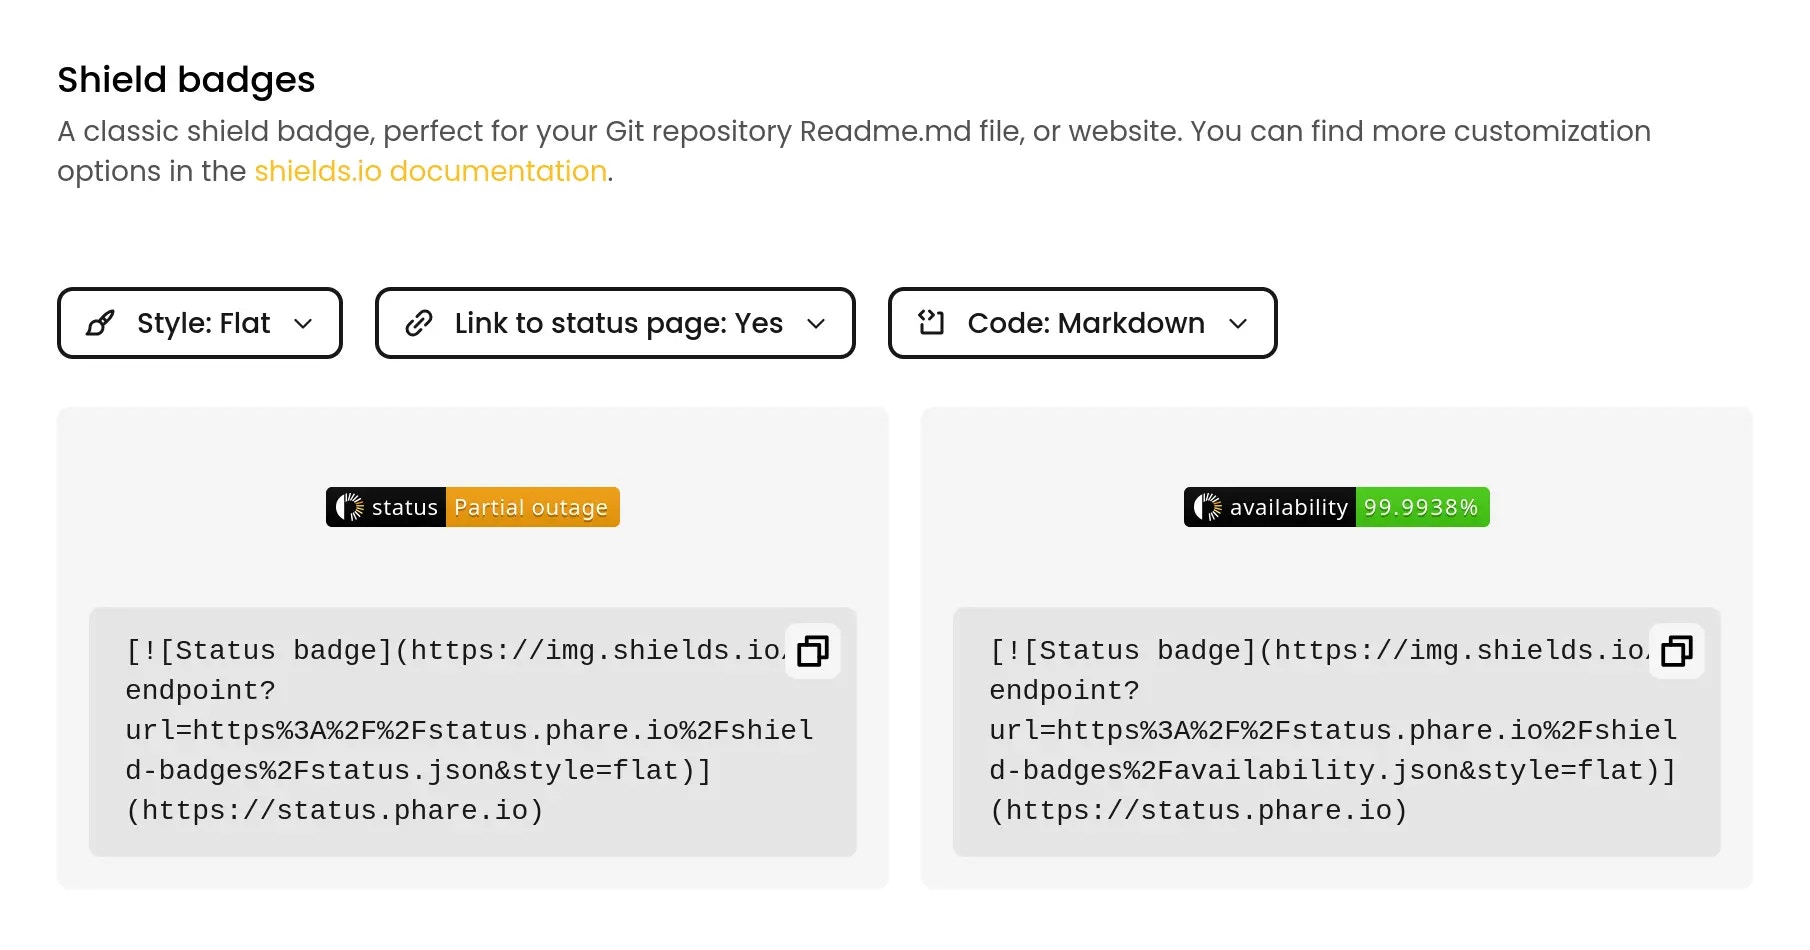
Shield status badges are now available for your status pages. You can embed these badges in your documentation, README files, or any other web page to show the current status of your services.
Two types of badges are currently available, a status badge showing the overall status of your status page, and an availability badge showing the uptime percentage of your services.
Send test alert rule notifications
December 11th, 2024
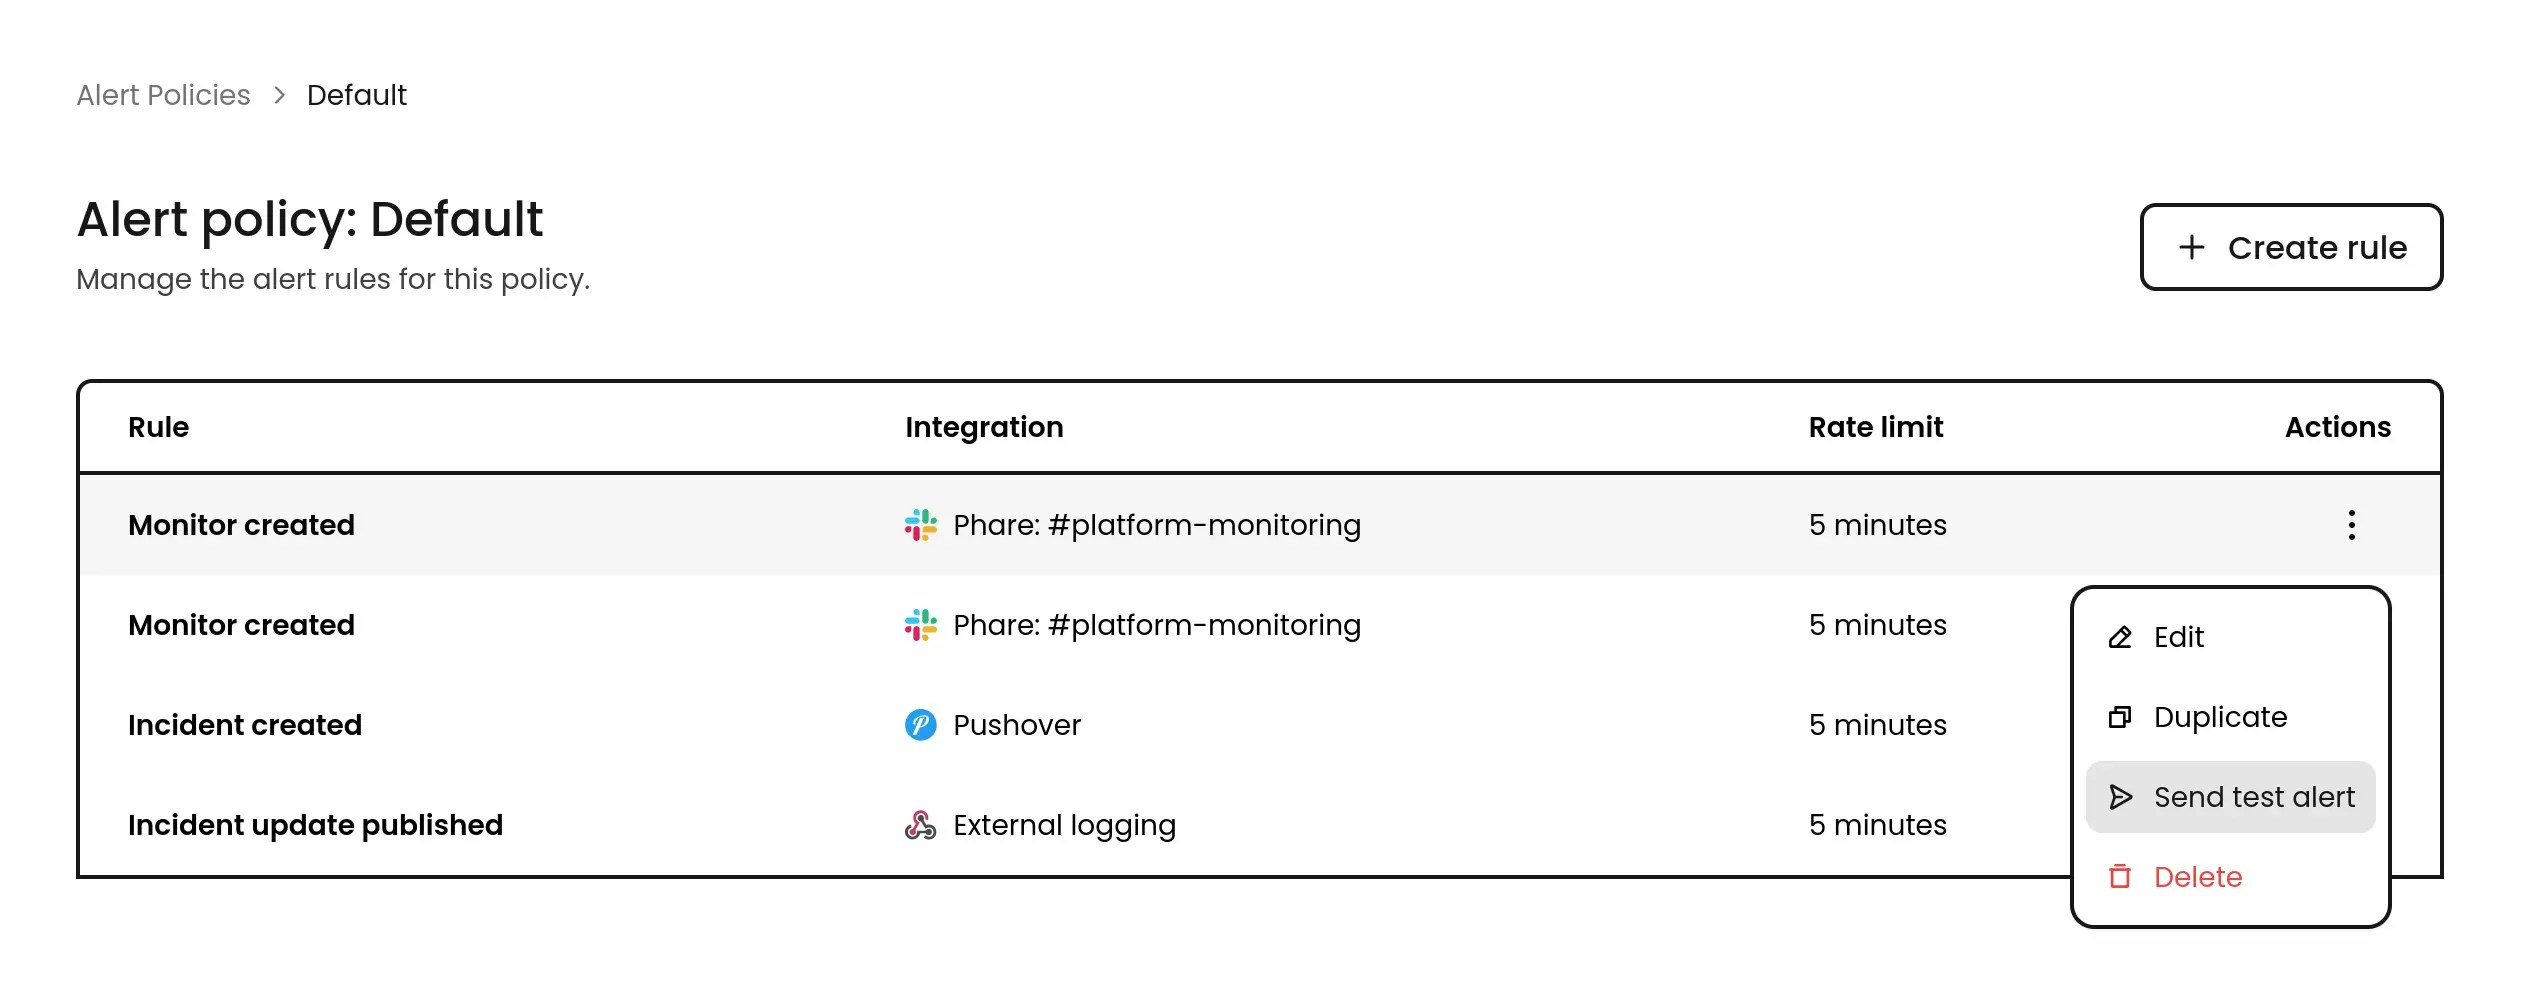
Phare now lets you send test notifications for your configured alert rules. Whether you’re fine-tuning an alert or setting up a new monitor, you can see exactly how it works before going live.
This is particularly useful for more complex alert rules, like outgoing webhooks, where you can verify that the payload is correctly formatted and received by your system.
This release also includes some quality of life improvements around alert policies and rules.
Pushover integration
December 6th, 2024
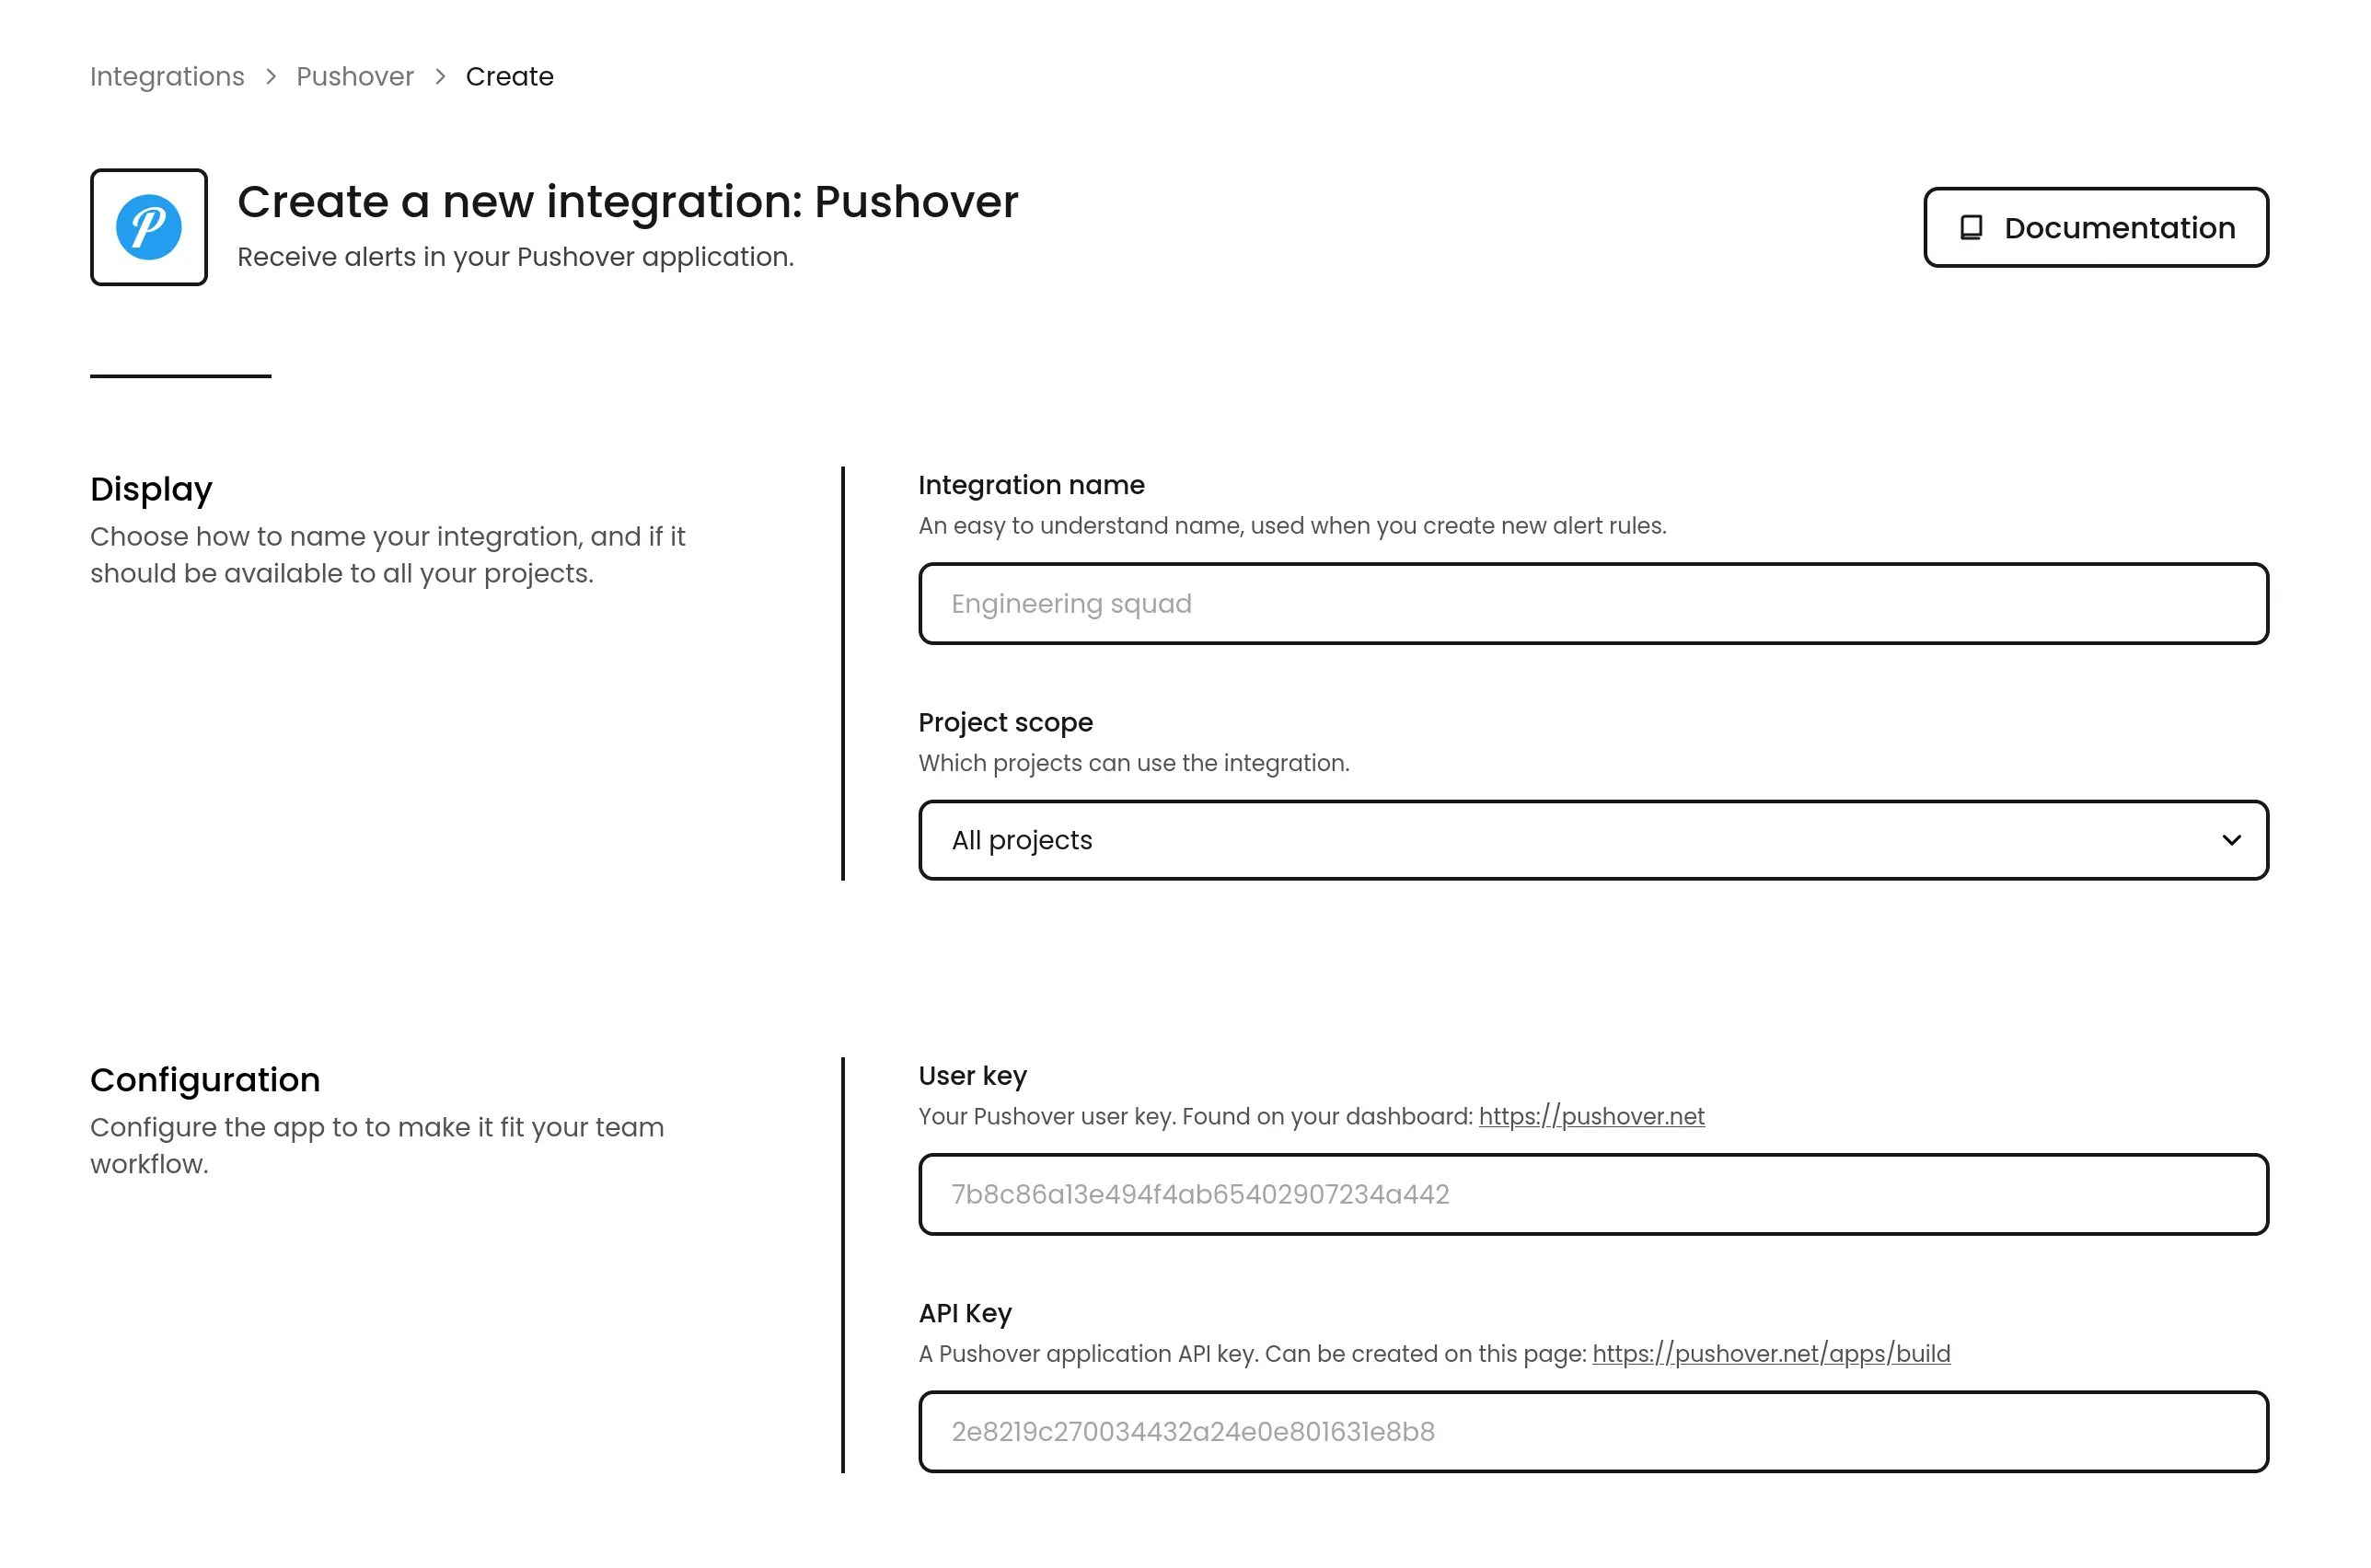
Phare now supports Pushover, so you can get your alert notifications straight to your preferred device.
Unlike other Pushover integrations you might have tried, Phare lets you set a custom priority for each type of notification, giving you fine-grained control over your alerts.
Read the Pushover integration documentation to get started.
Quickly pause and resume monitors
November 22th, 2024
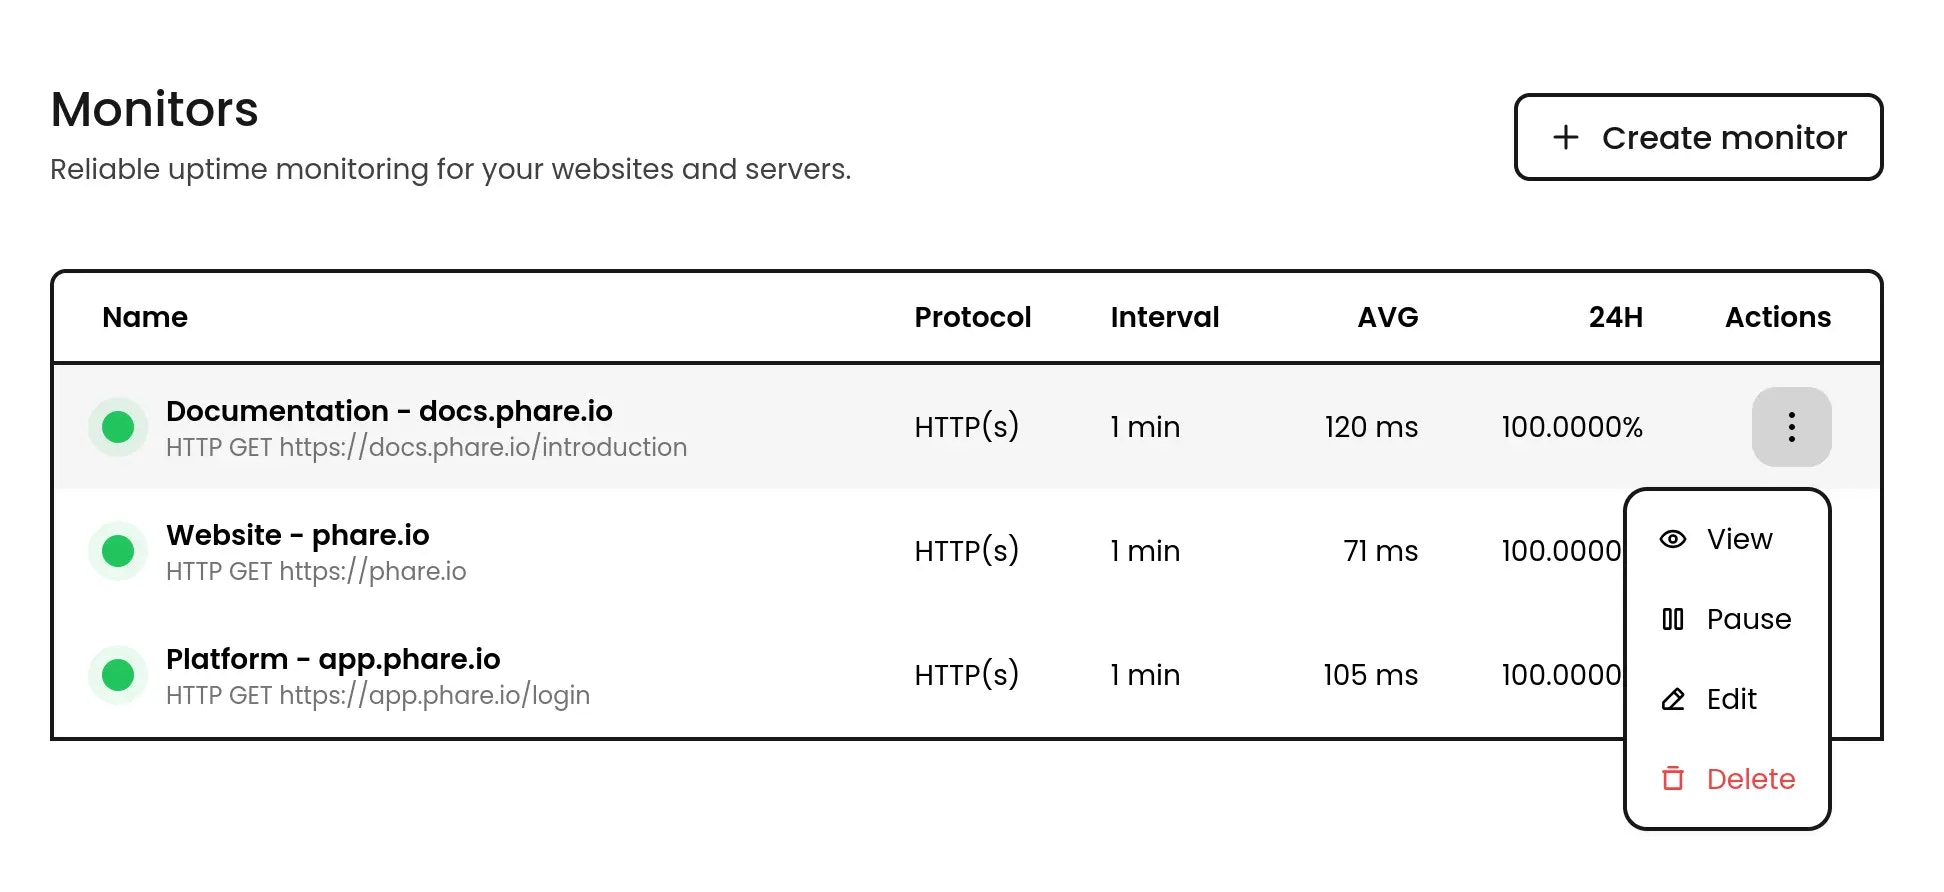
Monitors can now be paused and resumed directly from the monitor list. This feature allows you to quickly disable monitoring for a specific monitor without having to navigate to the monitor page.
Favicon support on status pages
November 22th, 2024
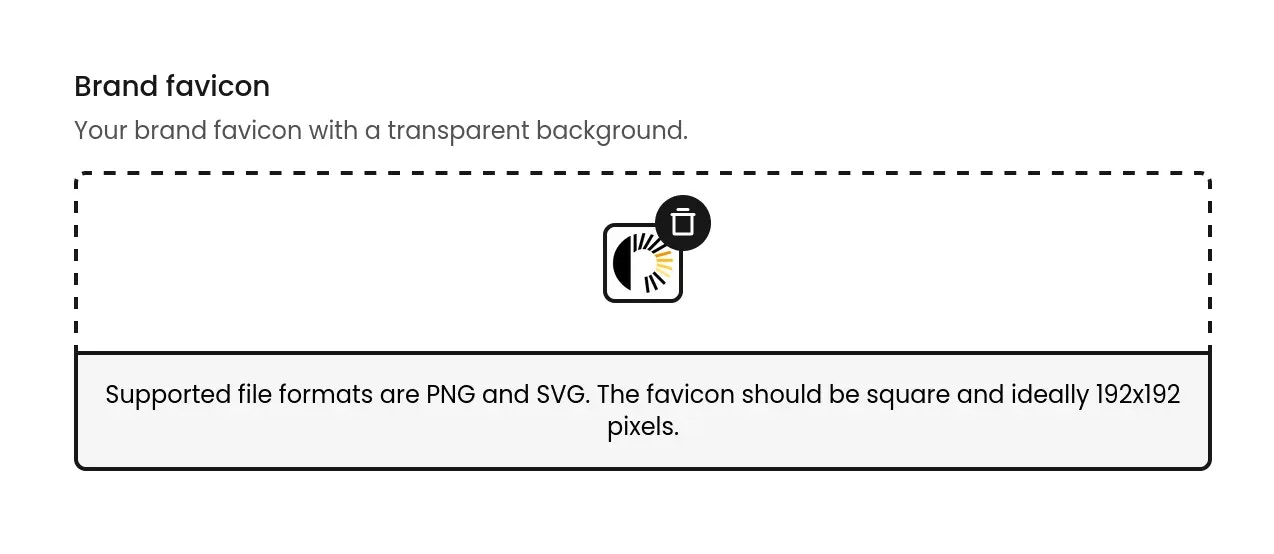
You can now customize the favicon displayed on your status pages. This feature allows you to add a personal touch to your status page and provide a more branded experience for your users.
Simplified TCP monitoring
November 20th, 2024
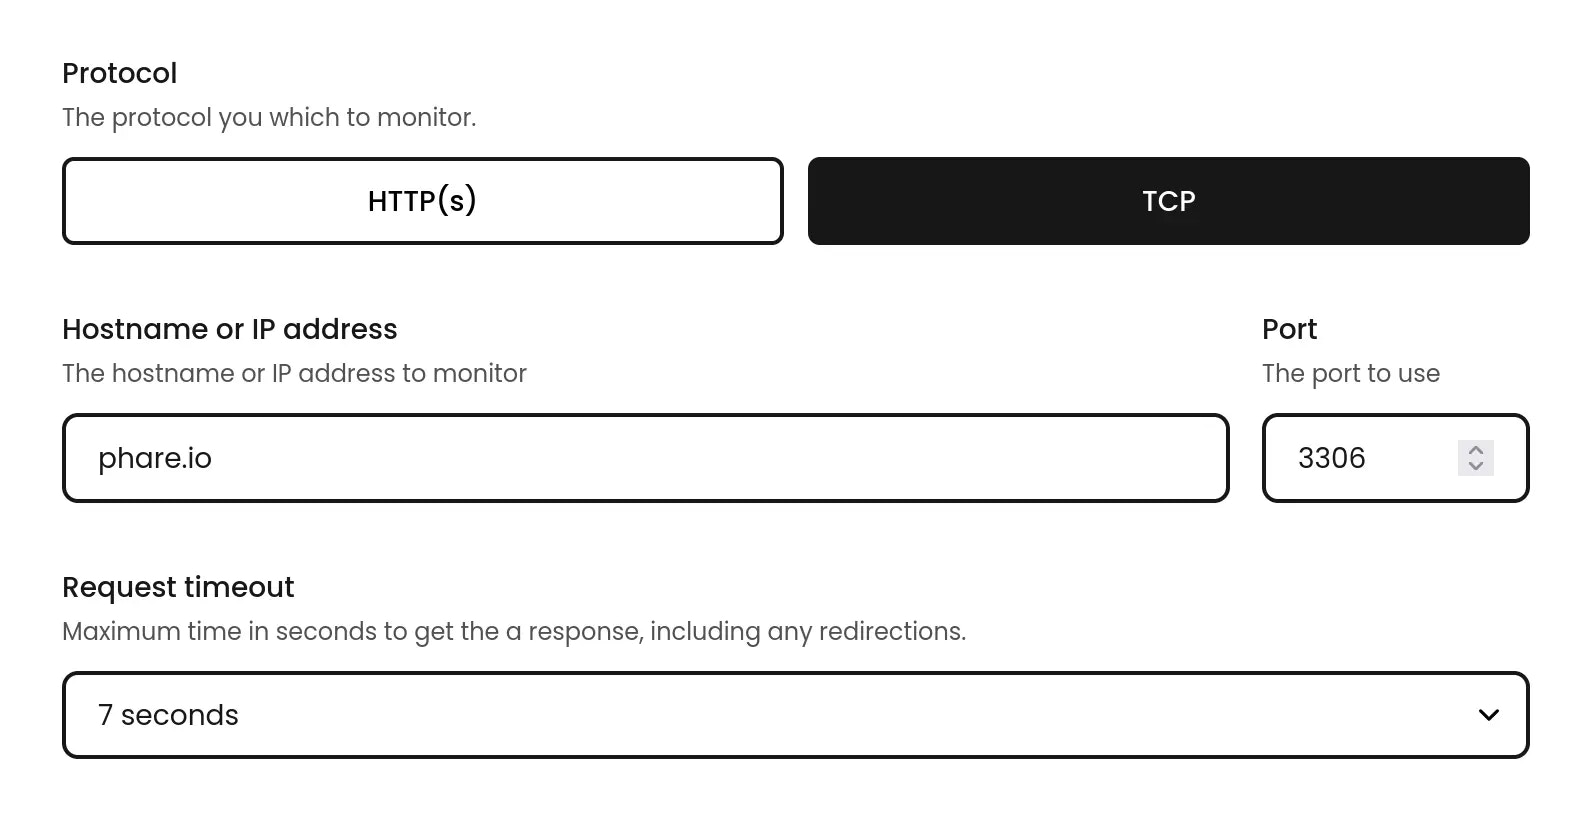
TCP monitoring has been simplified to make it easier to set up and manage monitoring for your services. No need to specify a payload and an expected response.
Refreshed status pages
November 11th, 2024
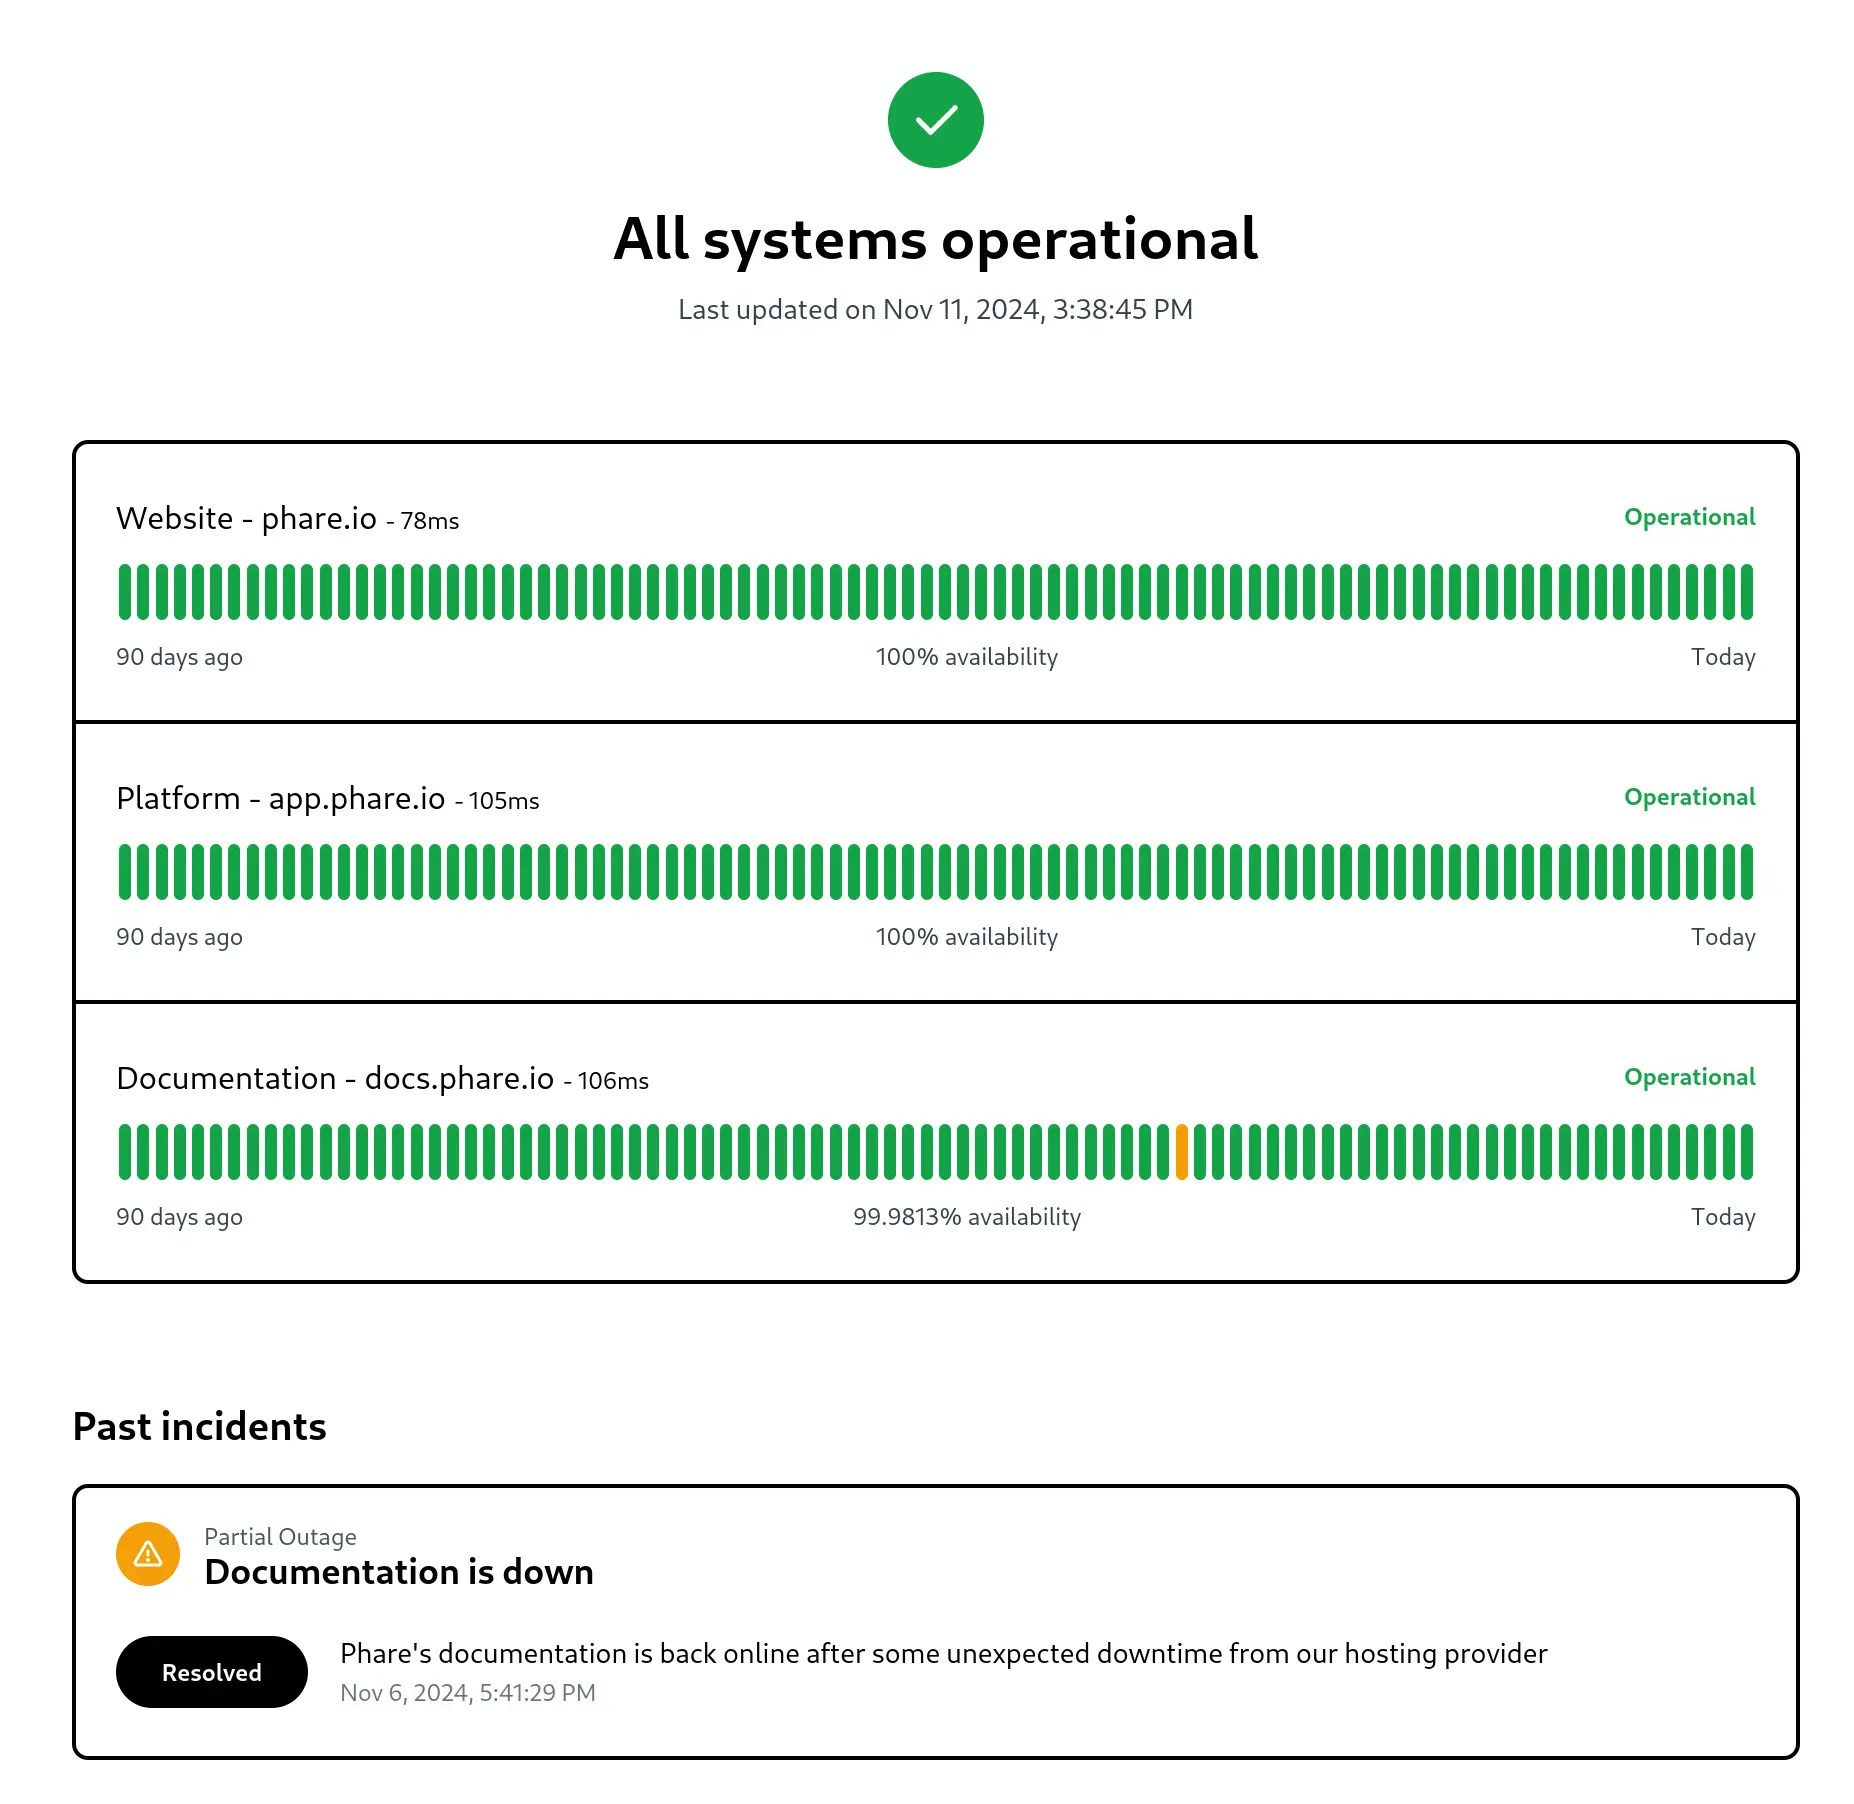
Status page design has been slightly refreshed to provide a better look and feel. This also includes a few bug fixes and improves how incidents and downtime are presented to your users in a more coherent way.
Incident management enhancements
November 8th, 2024
Several improvements have been introduced to the incident management system to streamline incident creation and give you more control:
Manual incident resolution
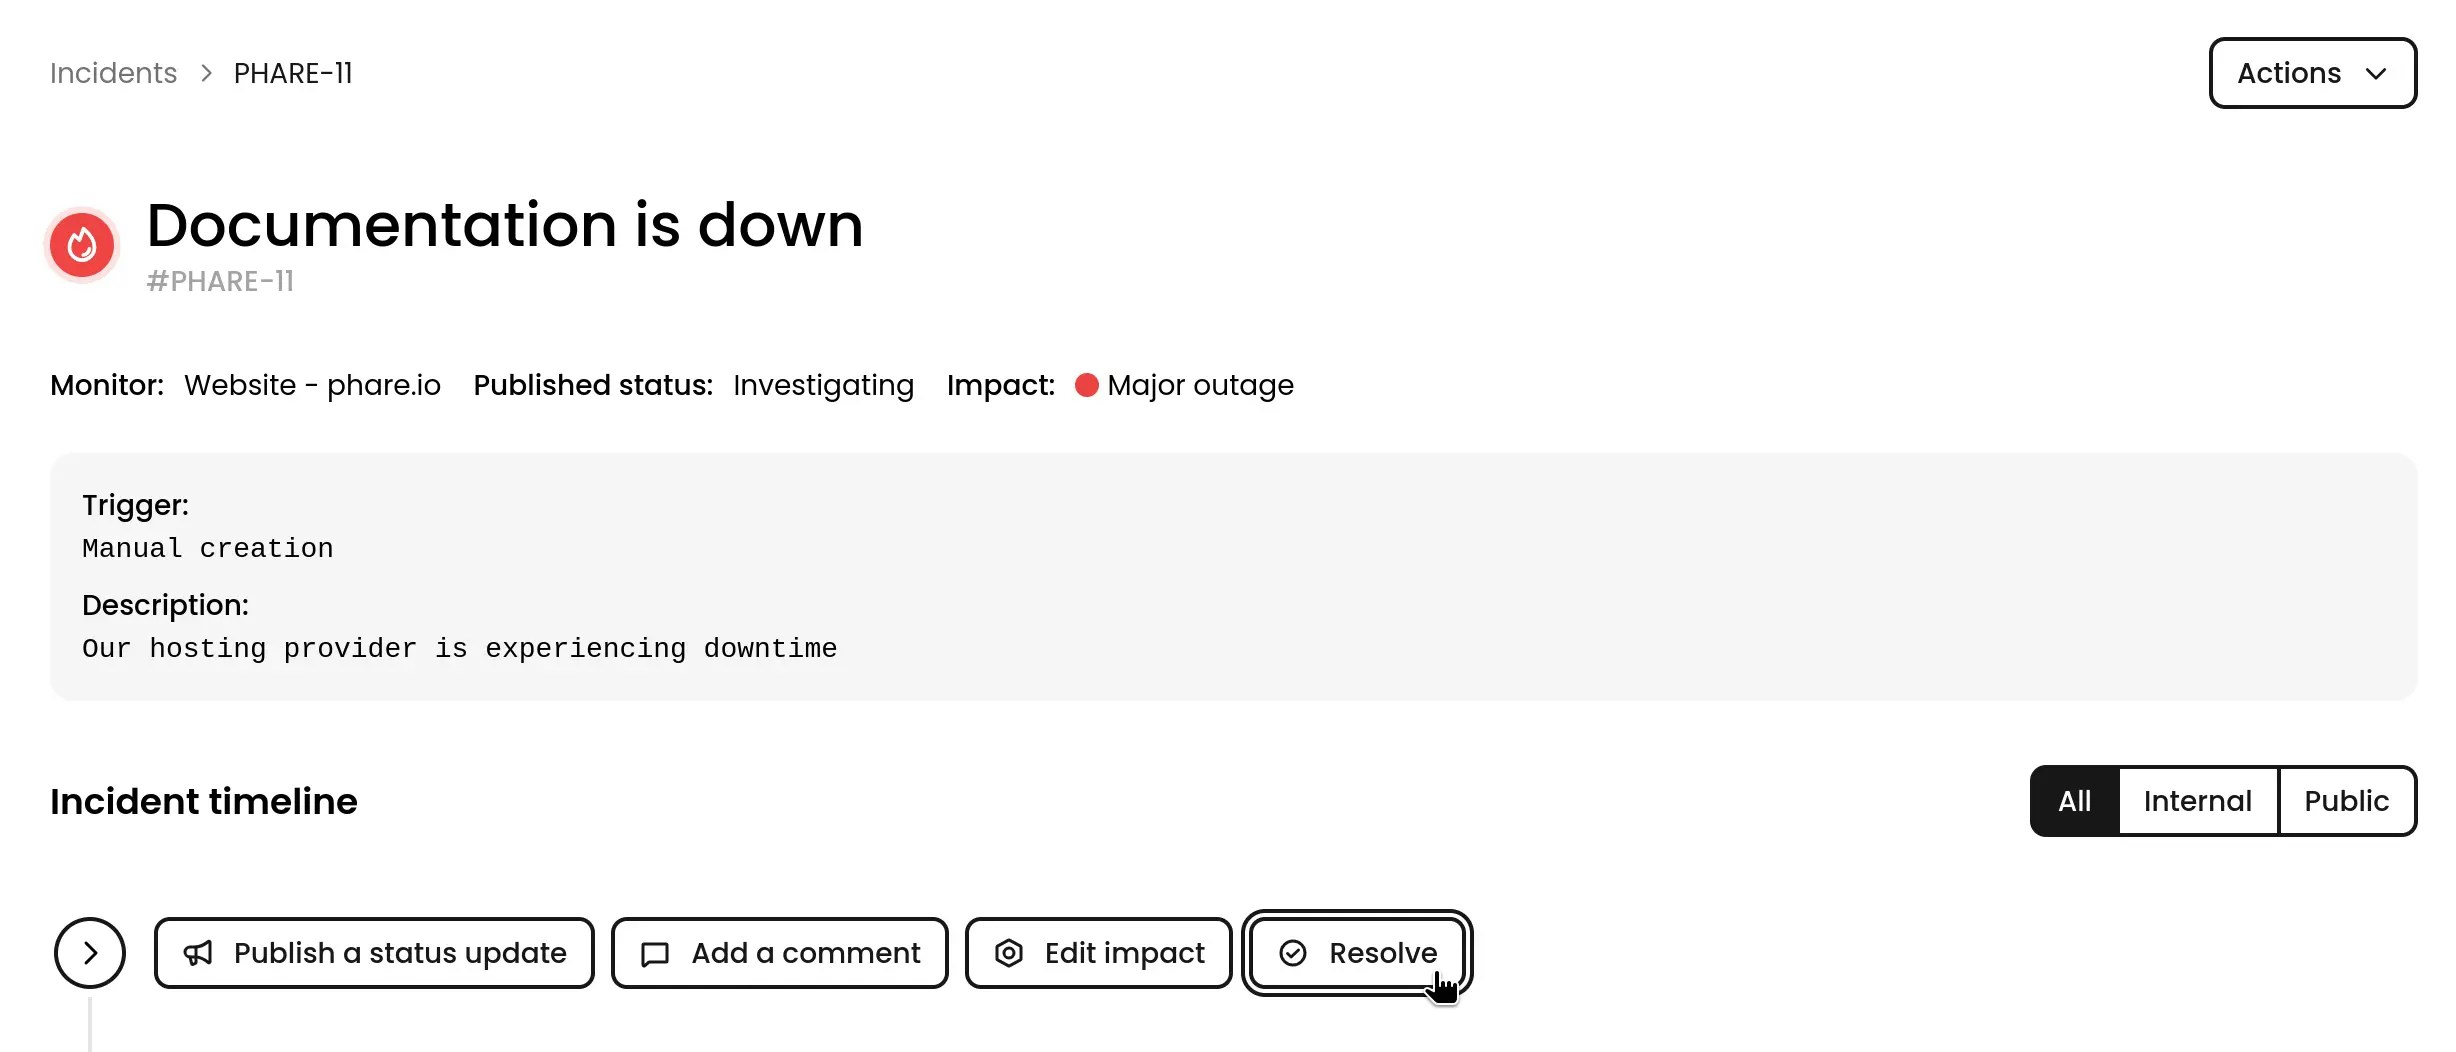
You can now manually resolve incidents, providing greater control over the incident lifecycle and ensuring accurate status reporting.
Publish status update during incident creation
When creating a new incident, you can now publish a status update immediately, keeping your users informed from the very beginning.
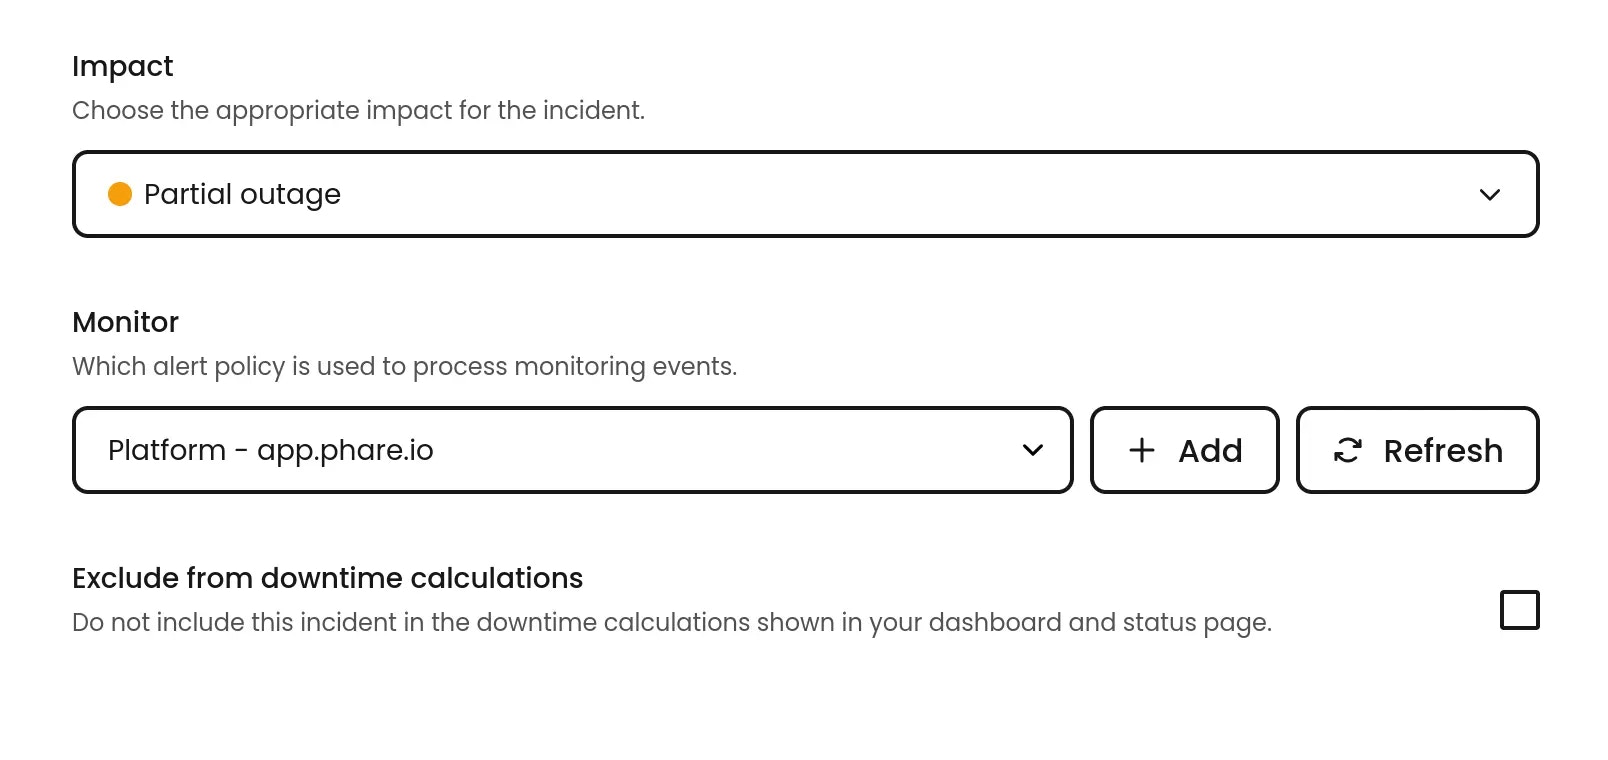
Control on incident downtime calculation
You now have the ability to exclude an incident from the downtime calculation, allowing you to maintain accurate uptime metrics and avoid skewing your performance data. This feature is particularly useful for maintenance windows with downtime that are already part of your SLA, or for incidents that have minimal impact on your users.
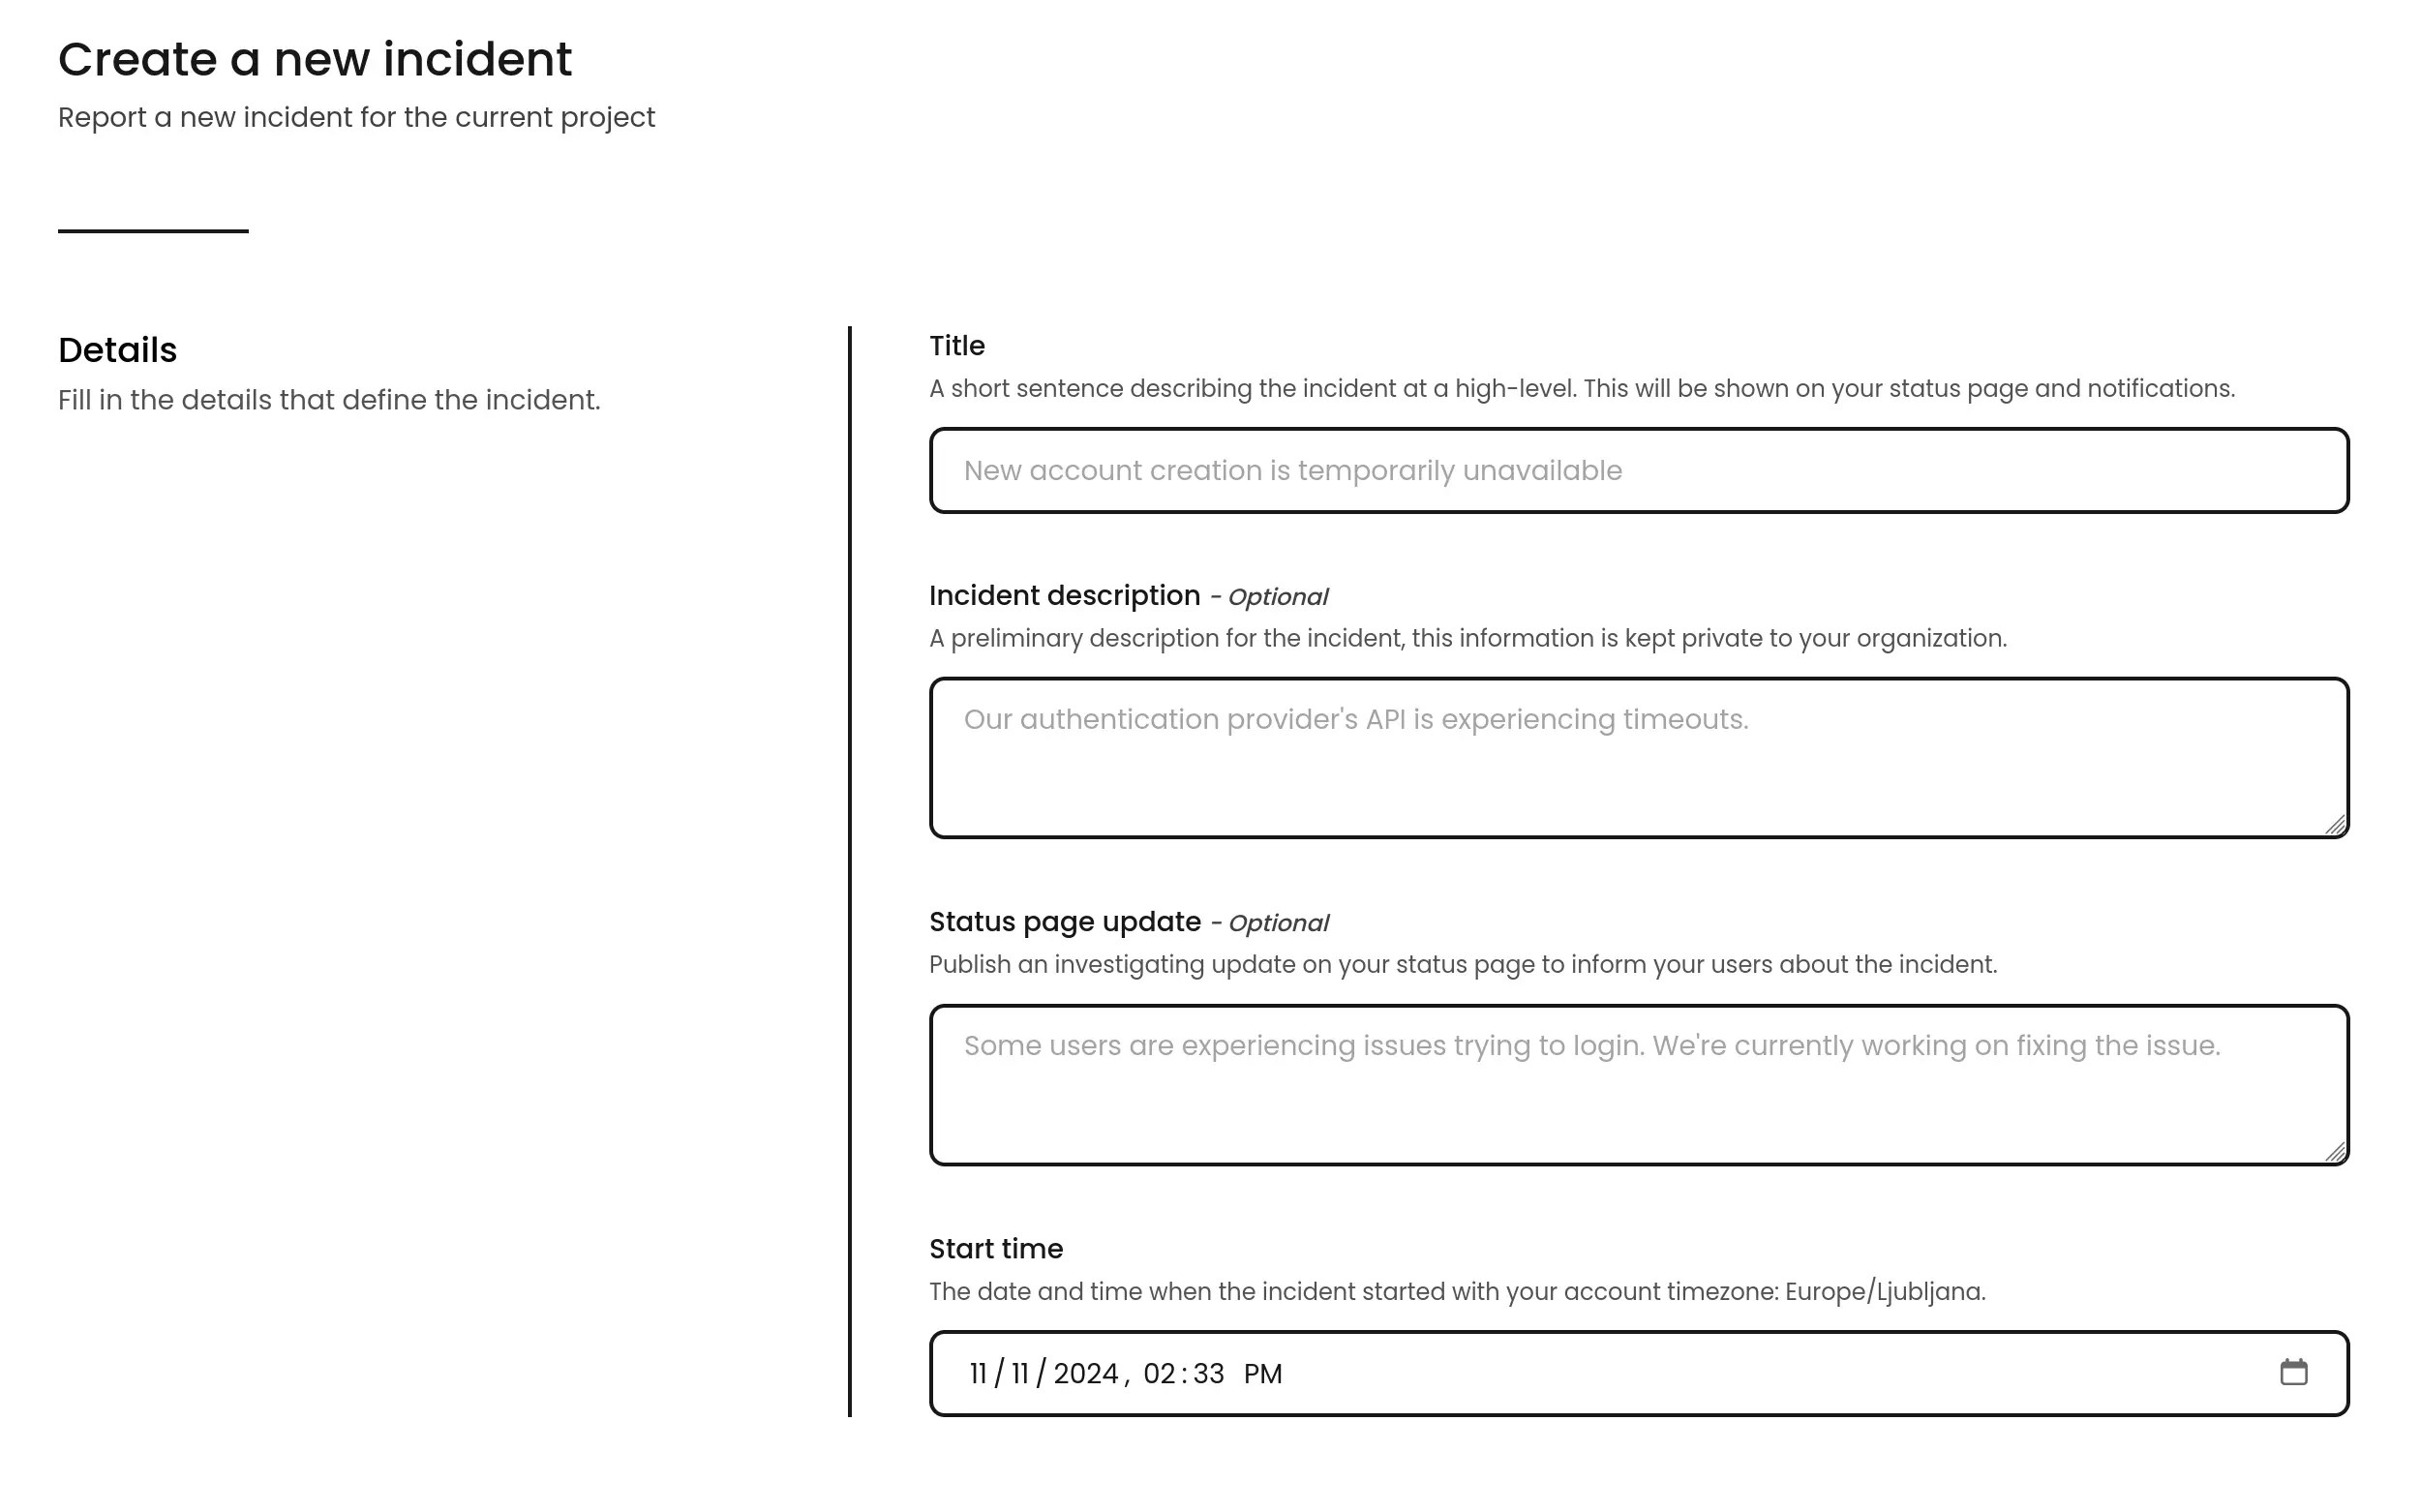
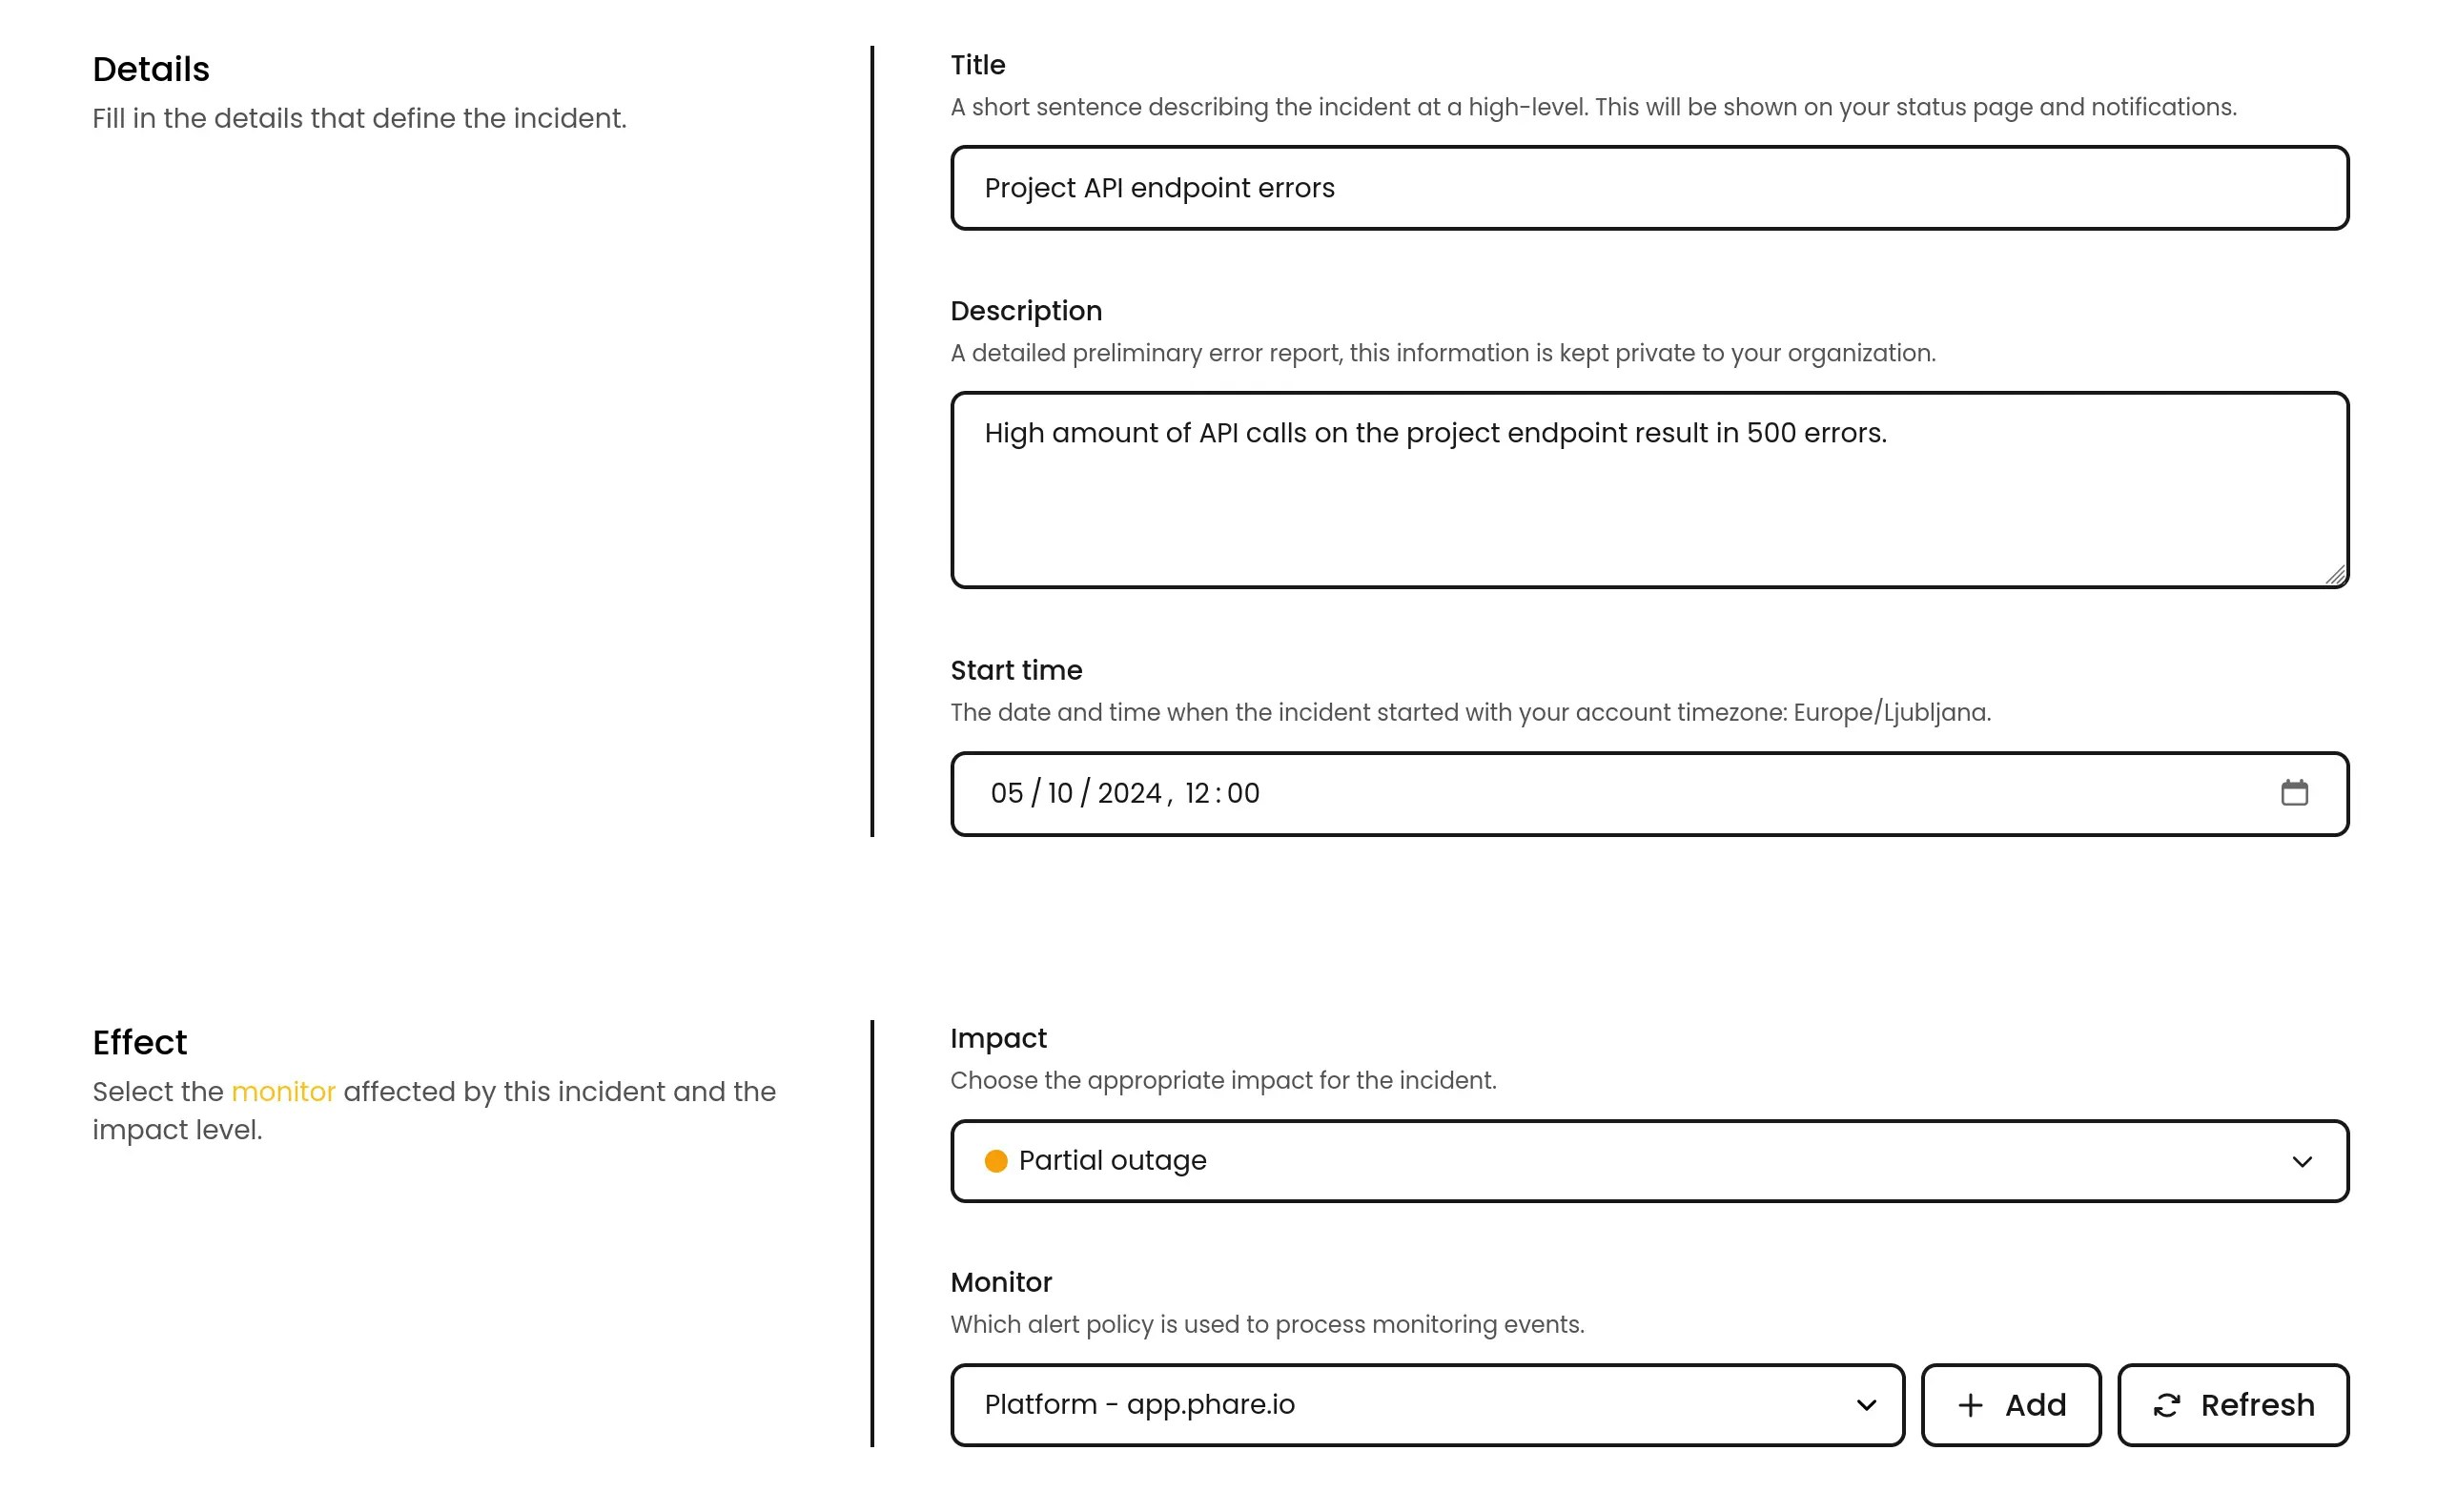
Incident creation
October 7th, 2024
Incidents can now be created manually. This feature allows you to easily track and manage incidents that are not automatically detected by uptime monitoring checks.
It is now also possible to modify incidents created automatically by the platform, allowing you to customize incident titles shown on your status page and add more details to the incident report.
Manually created incidents use alert policies under the hood and are not automatically resolved when associated monitors are successful.
This feature makes it easier to communicate with users during incidents.
Phare for good
August 30th, 2024
Phare is introducing the “Phare for Good” initiative, offering an extended free plan to open source projects and nonprofit organizations.
This initiative supports projects making a positive impact by providing the full suite of monitoring and incident management tools, completely free.
If you’re driving change through technology or social causes, Phare is here to help keep your online presence strong and reliable.
Join the program here: https://phare.io/for-good
Blog
August 22th, 2024
An official blog is now live for Phare. New content is posted occasionally, but only when there is something valuable to share.
You can already read a few articles:
August 5th, 2024
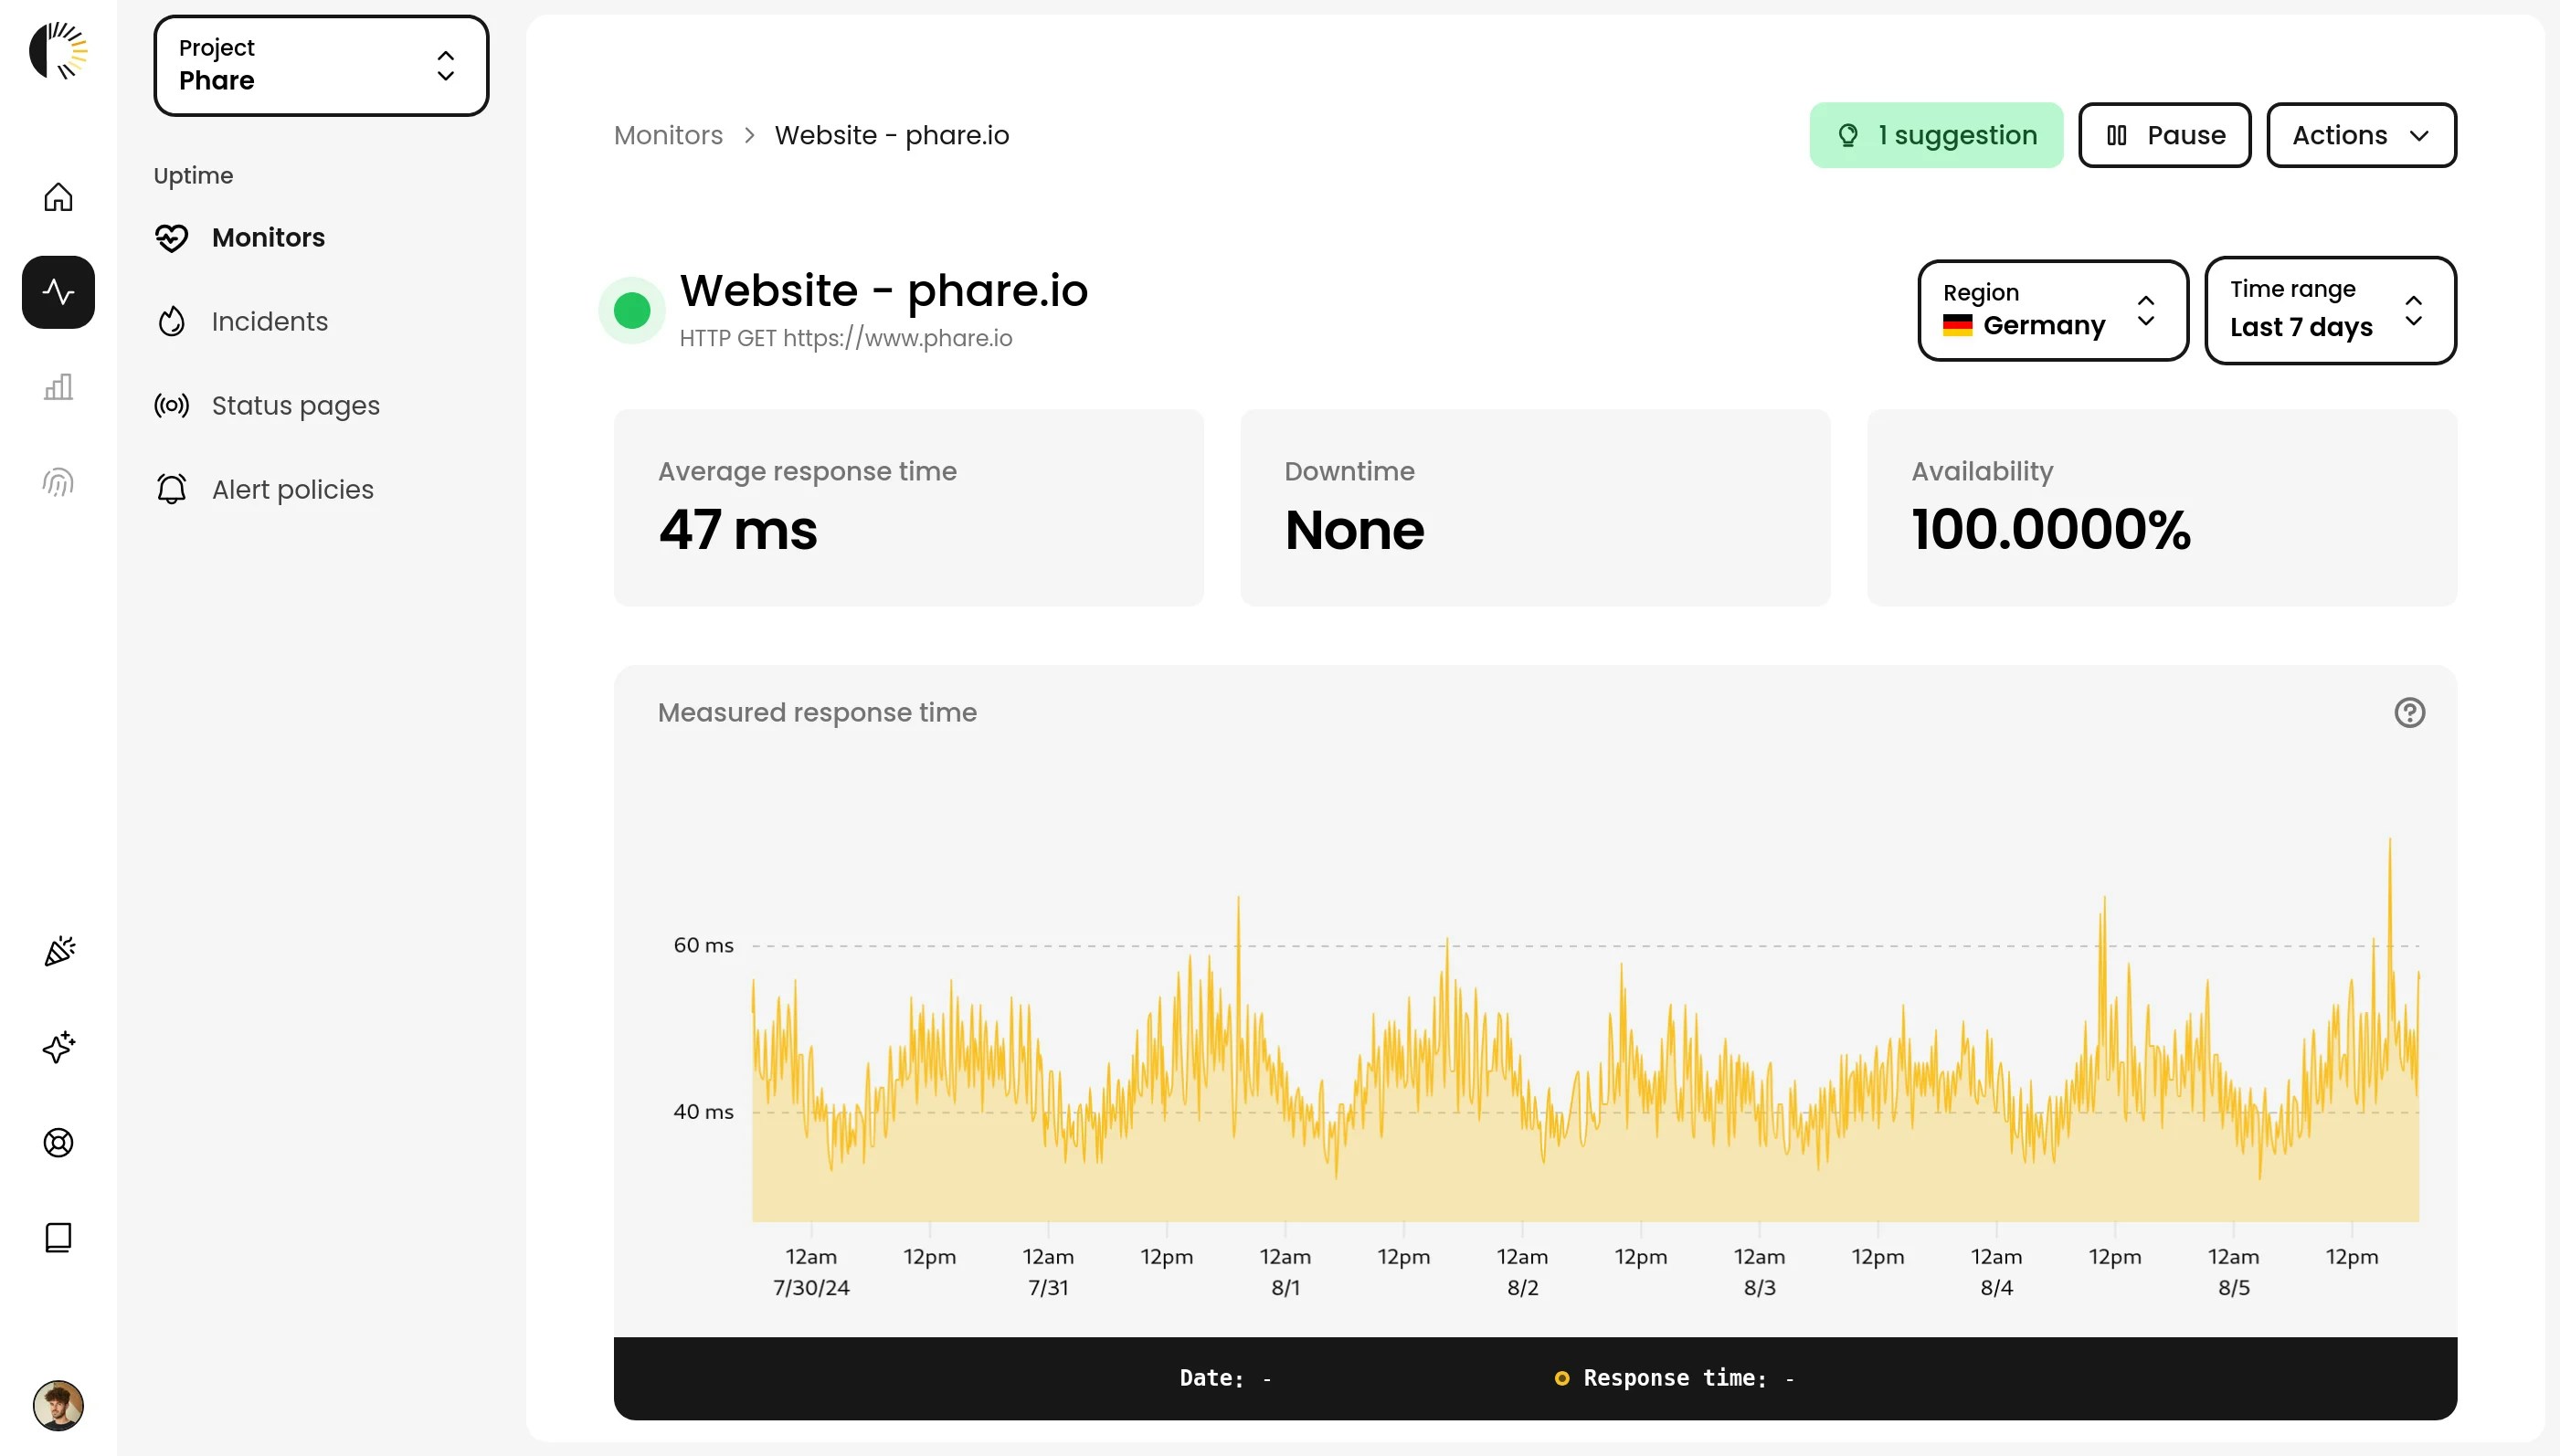
The Phare platform received a makeover focused on improving the navigation and user experience. The new design provides a cleaner and more intuitive interface, making it easier to access the features you need. Most pages have been updated with many small improvements to improve the overall user experience.
Your monitoring pages have also been redesigned slightly and given a new filter to show performance data specific to a region. This allows you to quickly identify any regional performance issues and take appropriate action.
July 29th, 2024
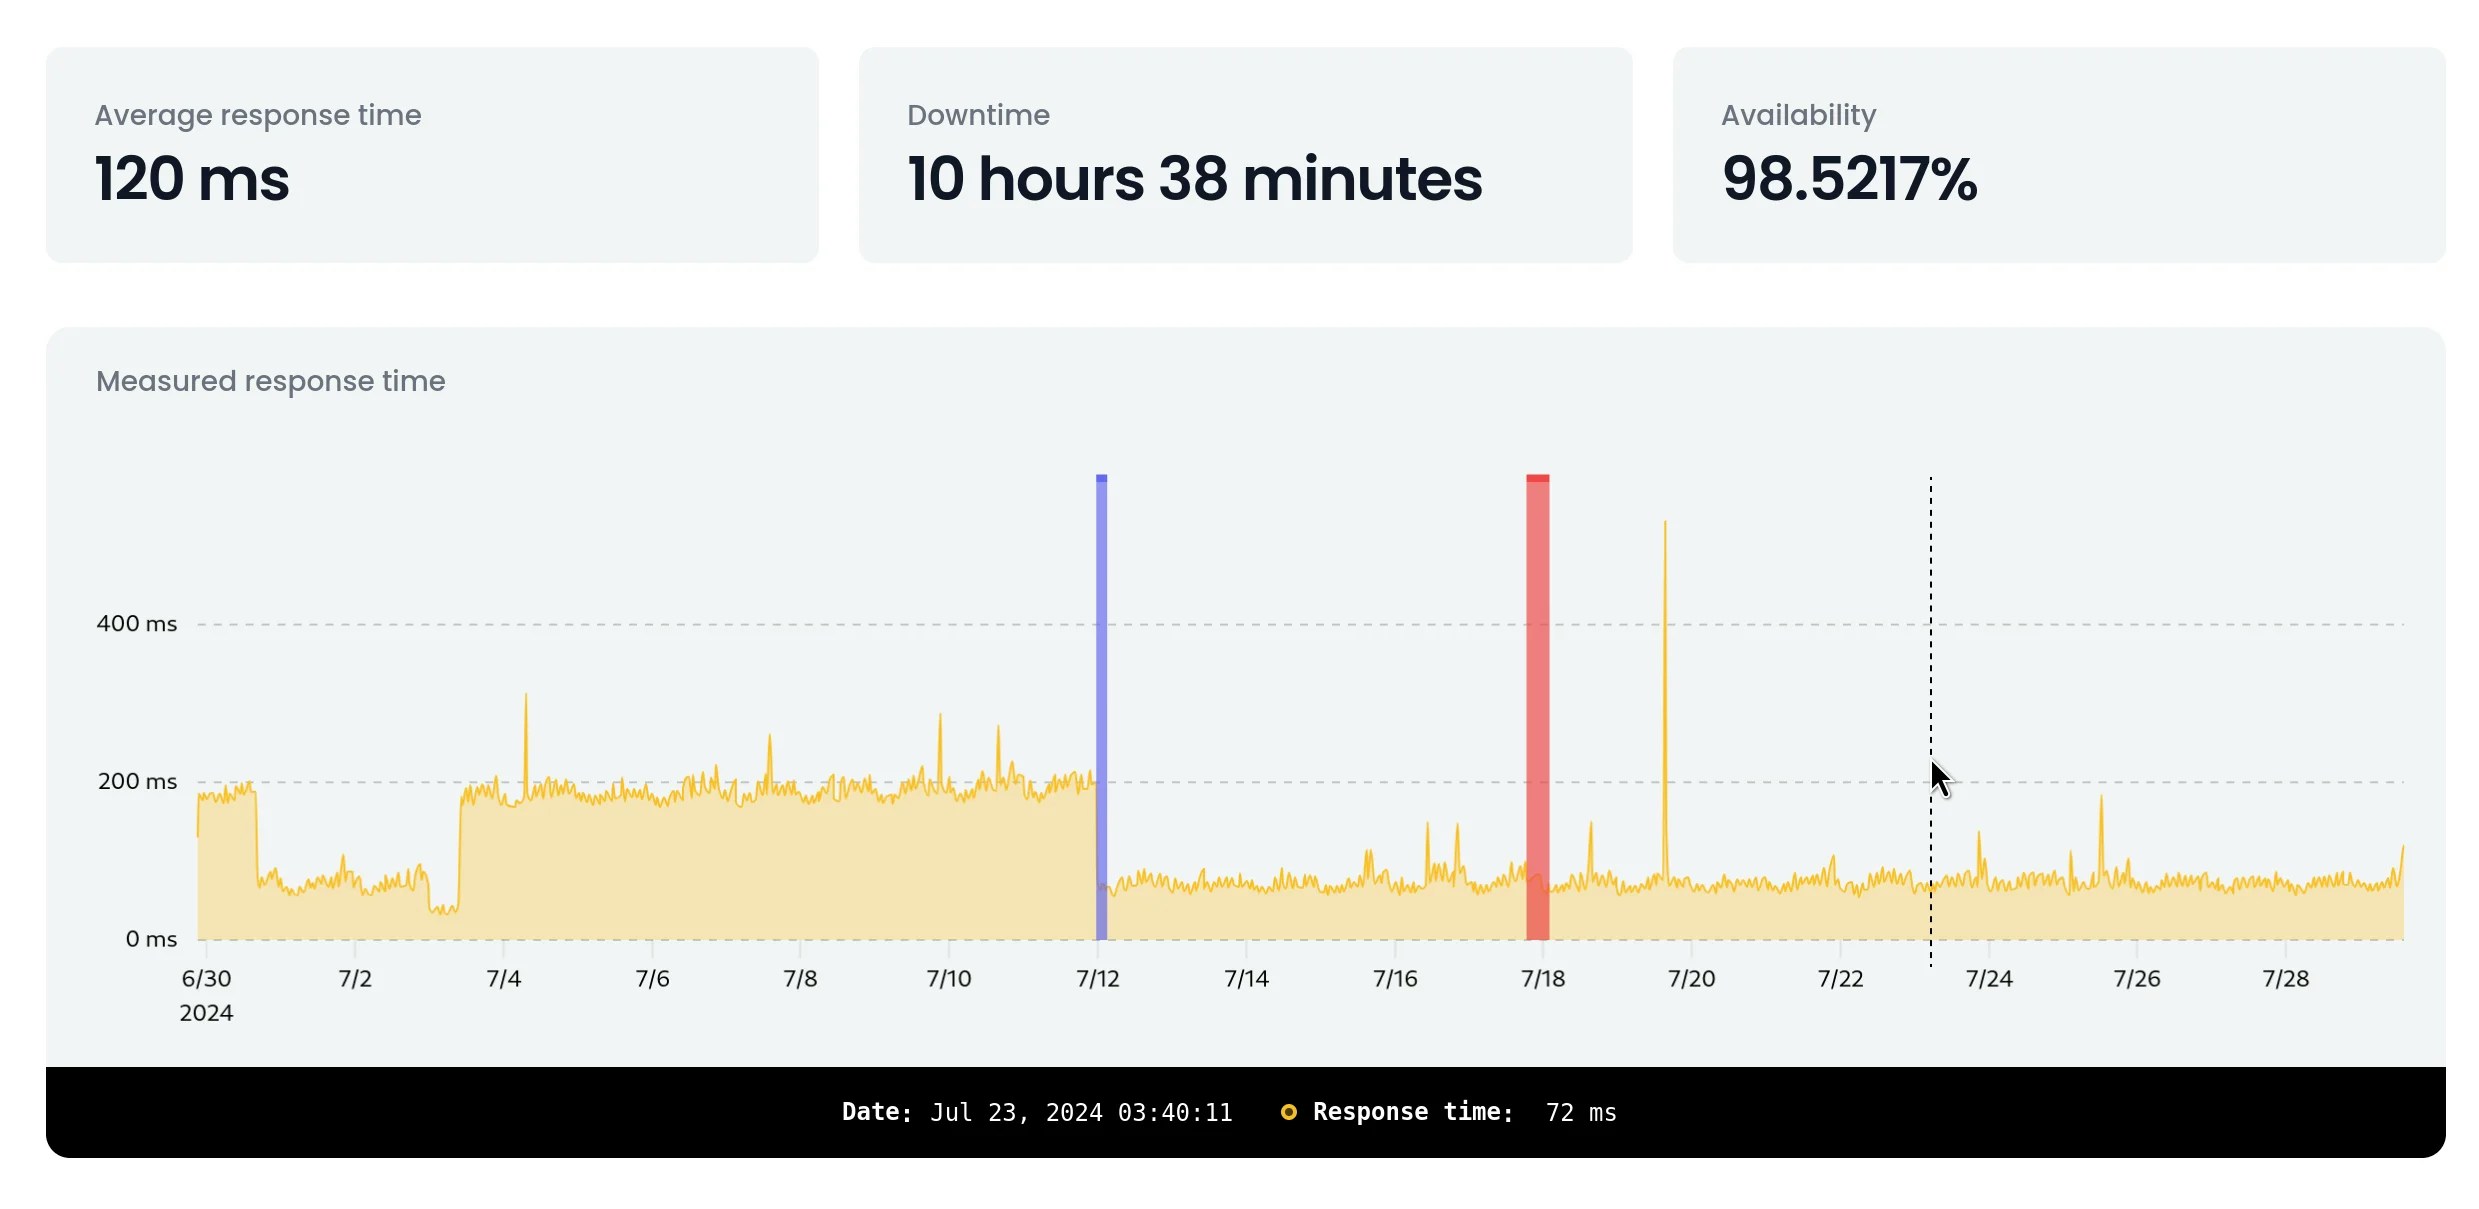
The algorithm used to generate the performance chart has been improved to provide a more accurate representation of your monitor’s performance. This change allows for better anomaly removal and a more precise representation of the overall performance shown by your monitor.
Incidents are now displayed on the chart with their respective impact colors, making it easier to understand any correlation at a glance.
If you’re interested in learning more about how Phare generates the performance chart, read the article on downsampling time series data.
Custom domains for status pages
July 22th, 2024
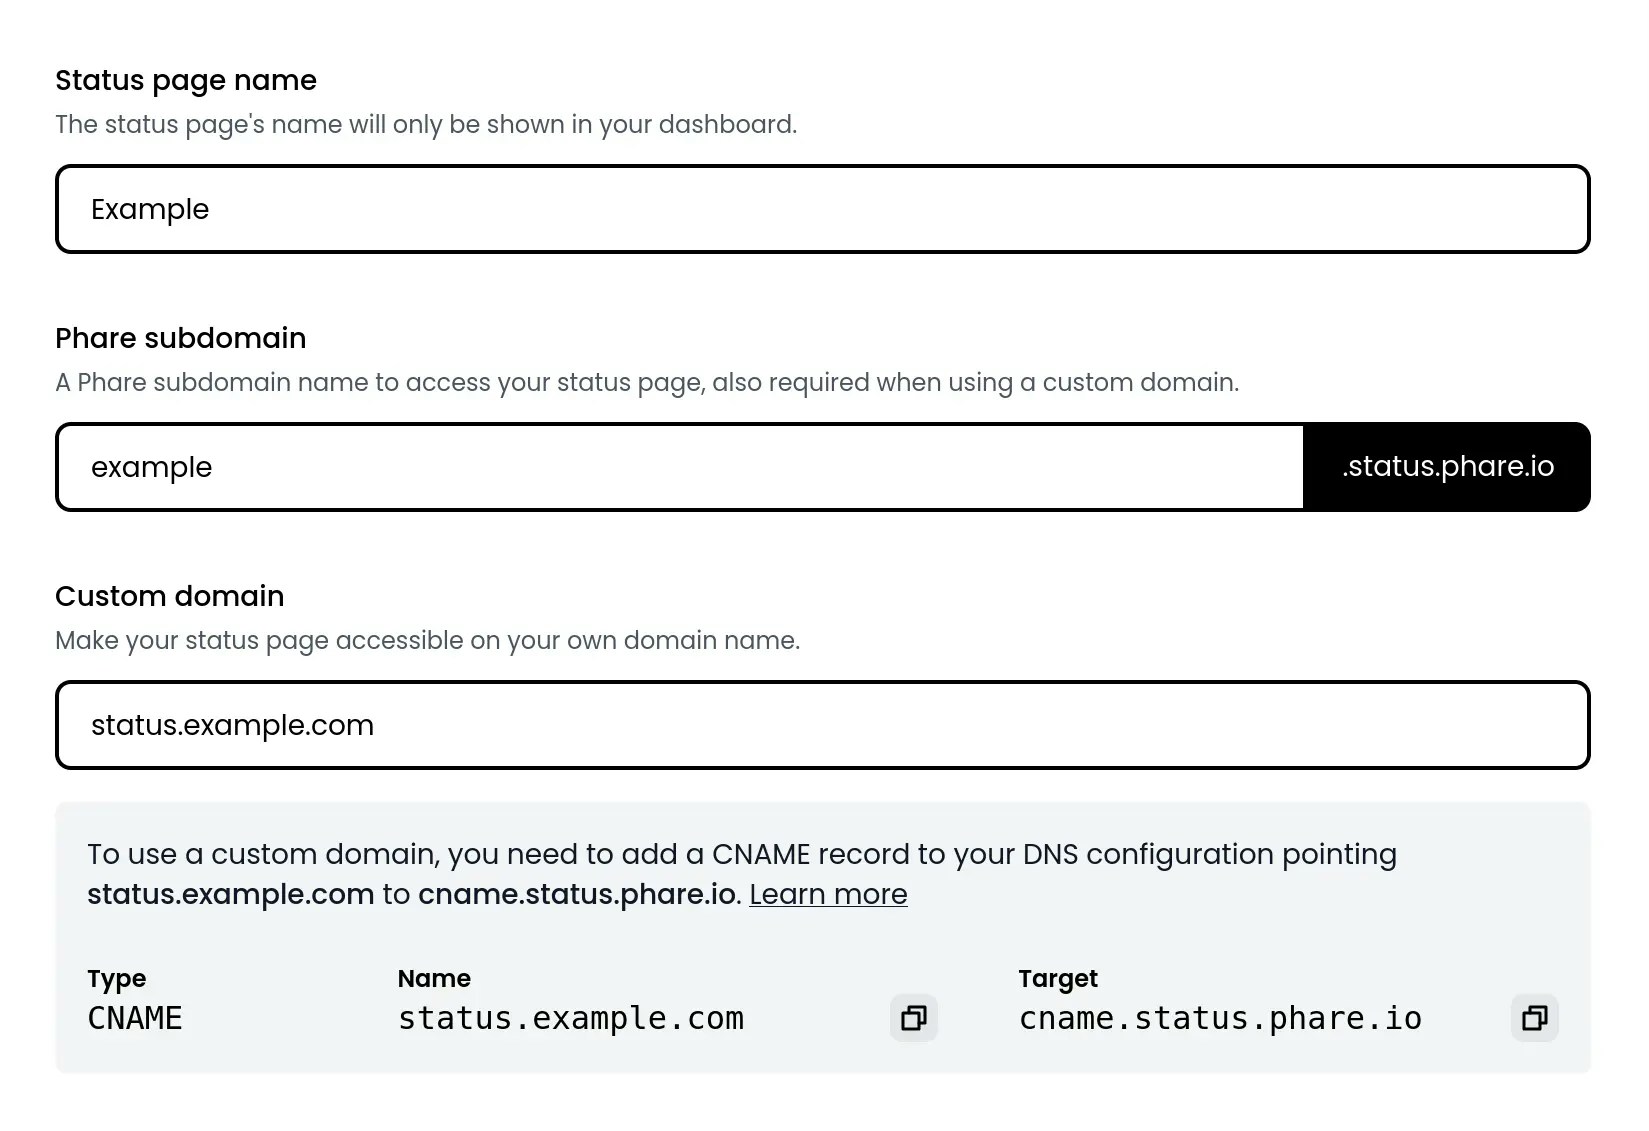
You can now use your own domain for your status pages, providing a more seamless and branded experience for your users. This feature allows you to create a custom subdomain for your status pages, such as status.example.com, and link it to your Phare status page.
The Phare-provided subdomain *.status.phare.io attached to your status page will stay active and will automatically redirect users to your custom domain if you configure one.
Instructions on how to set up a custom domain for your status page can be found in the documentation.
Outgoing webhooks integration
July 17th, 2024
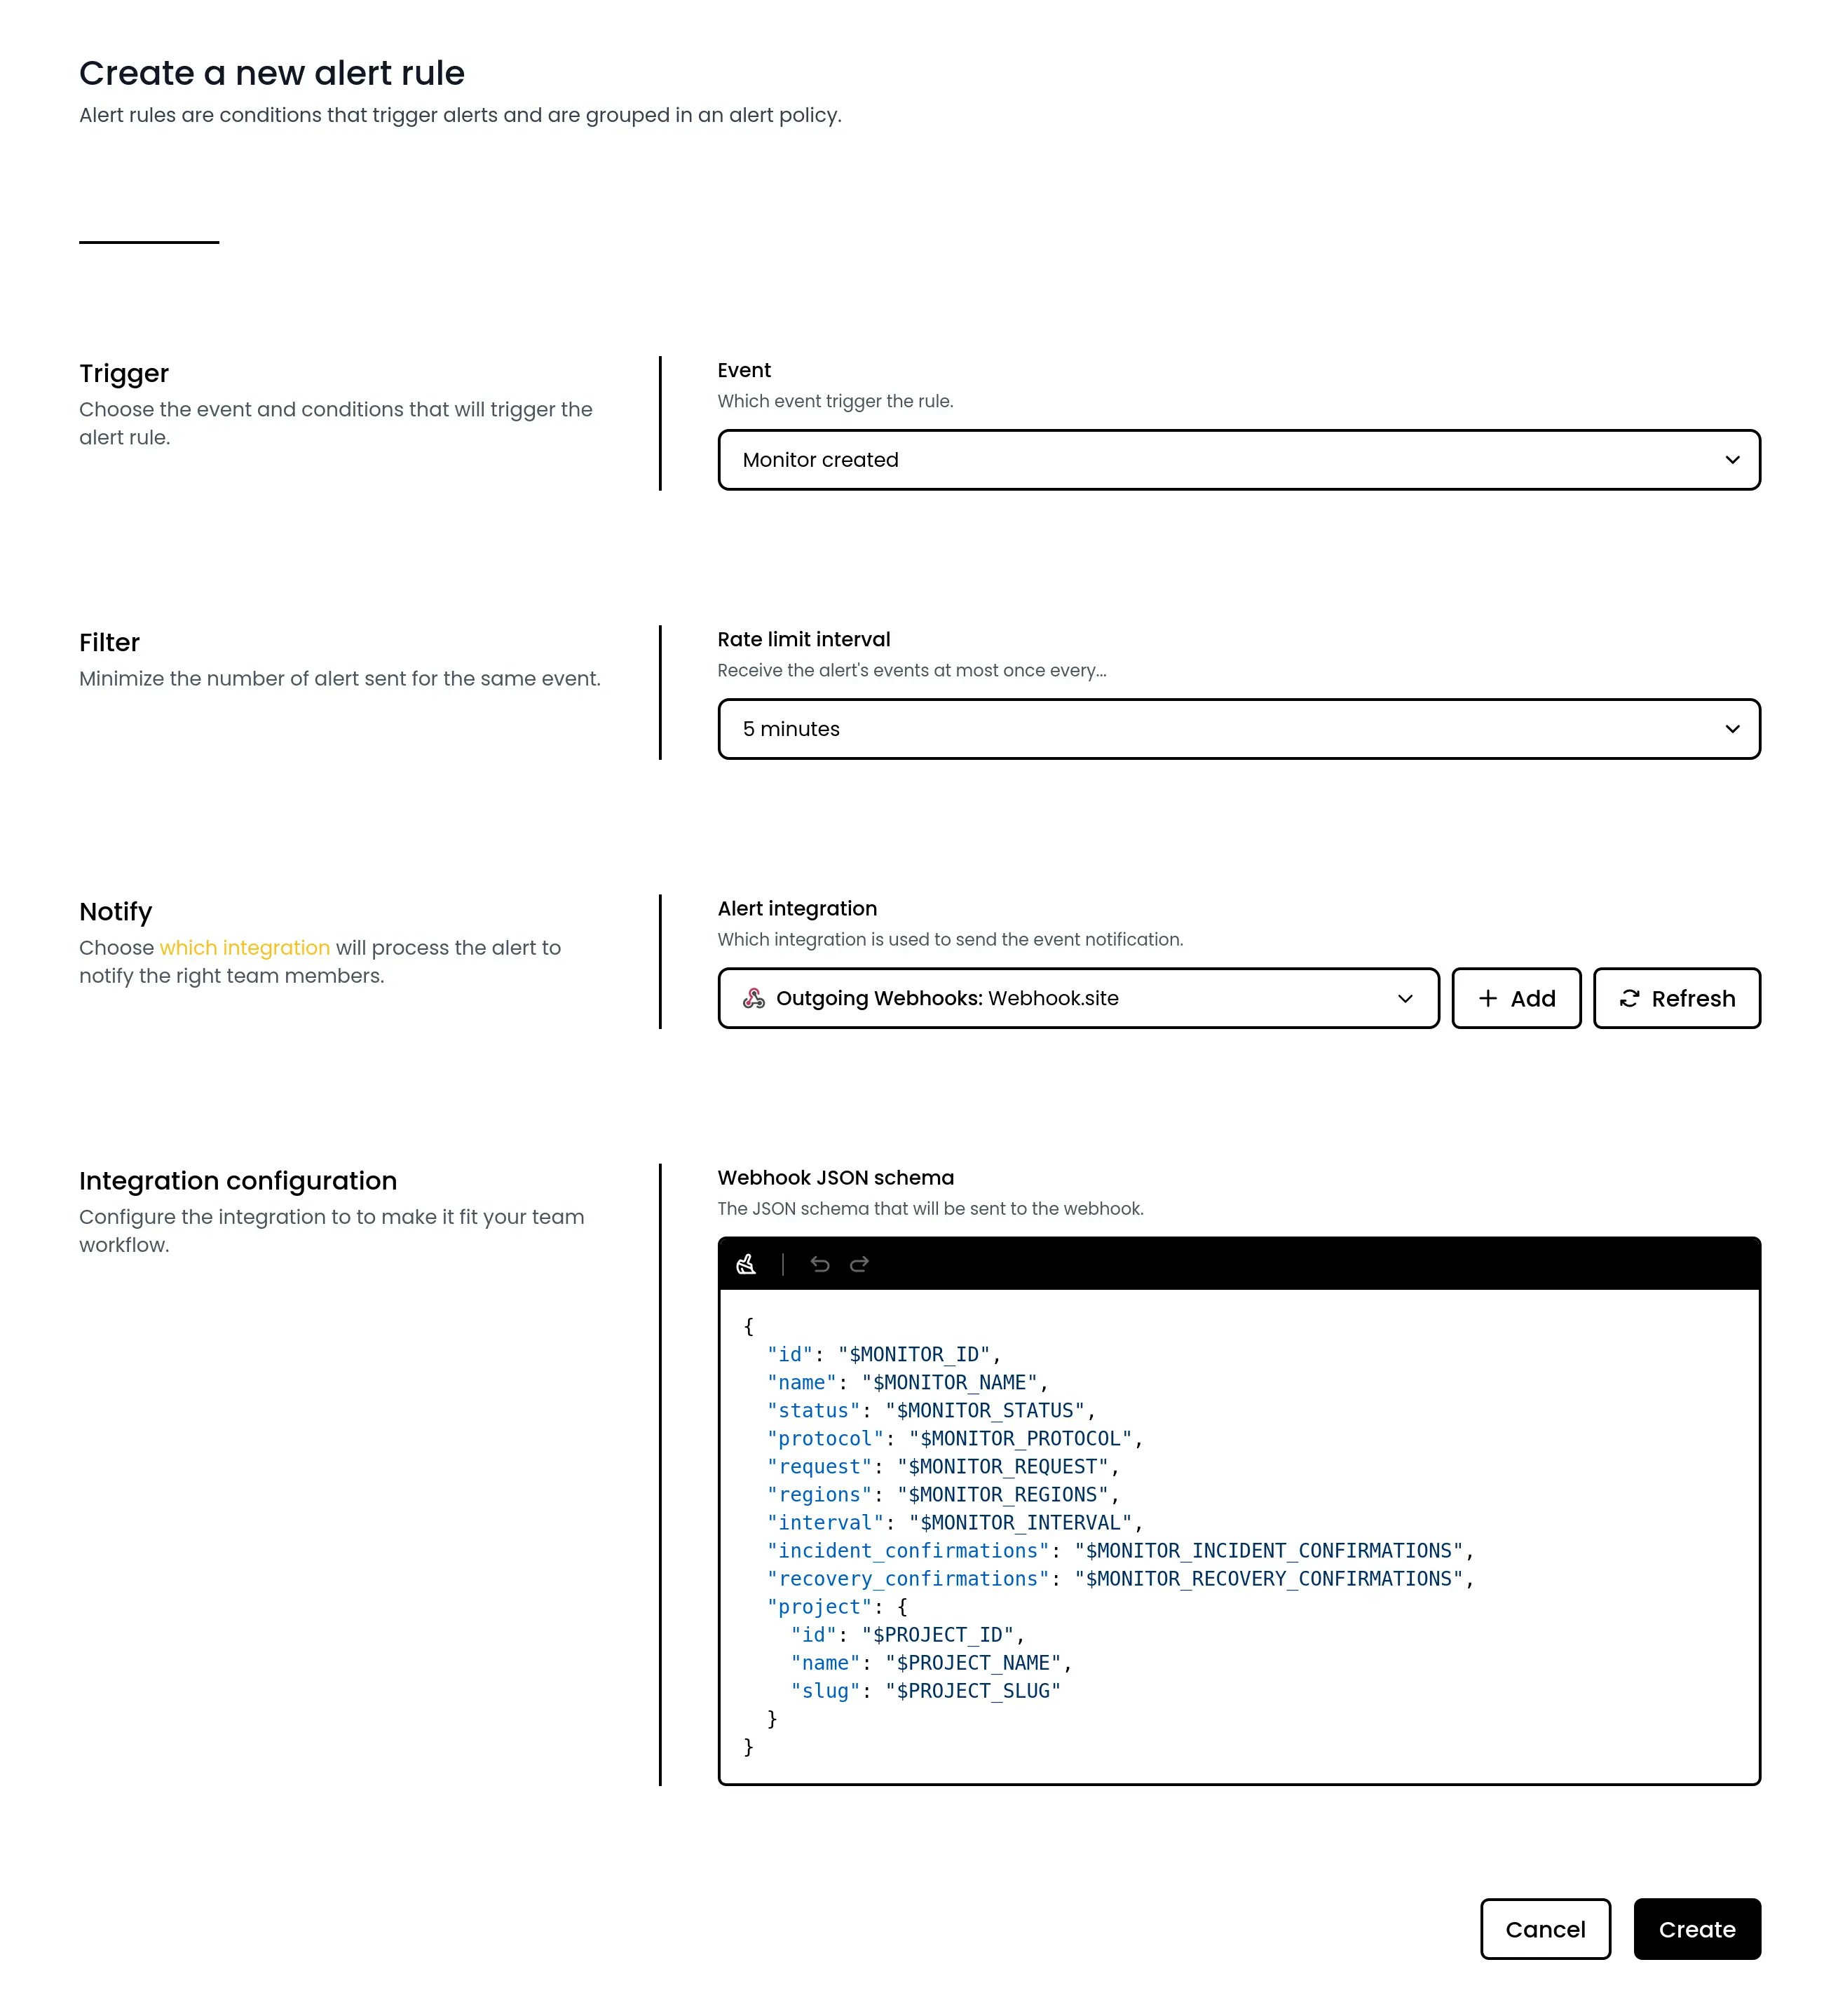
Outgoing webhooks are now available on the Phare platform, allowing you to connect with third-party tools or build your own integration.
The webhook payload can be customized for each alert rule event that you would like to use. You are free to use any valid JSON structure with access to many variables to help you build the perfect payload for your use case.
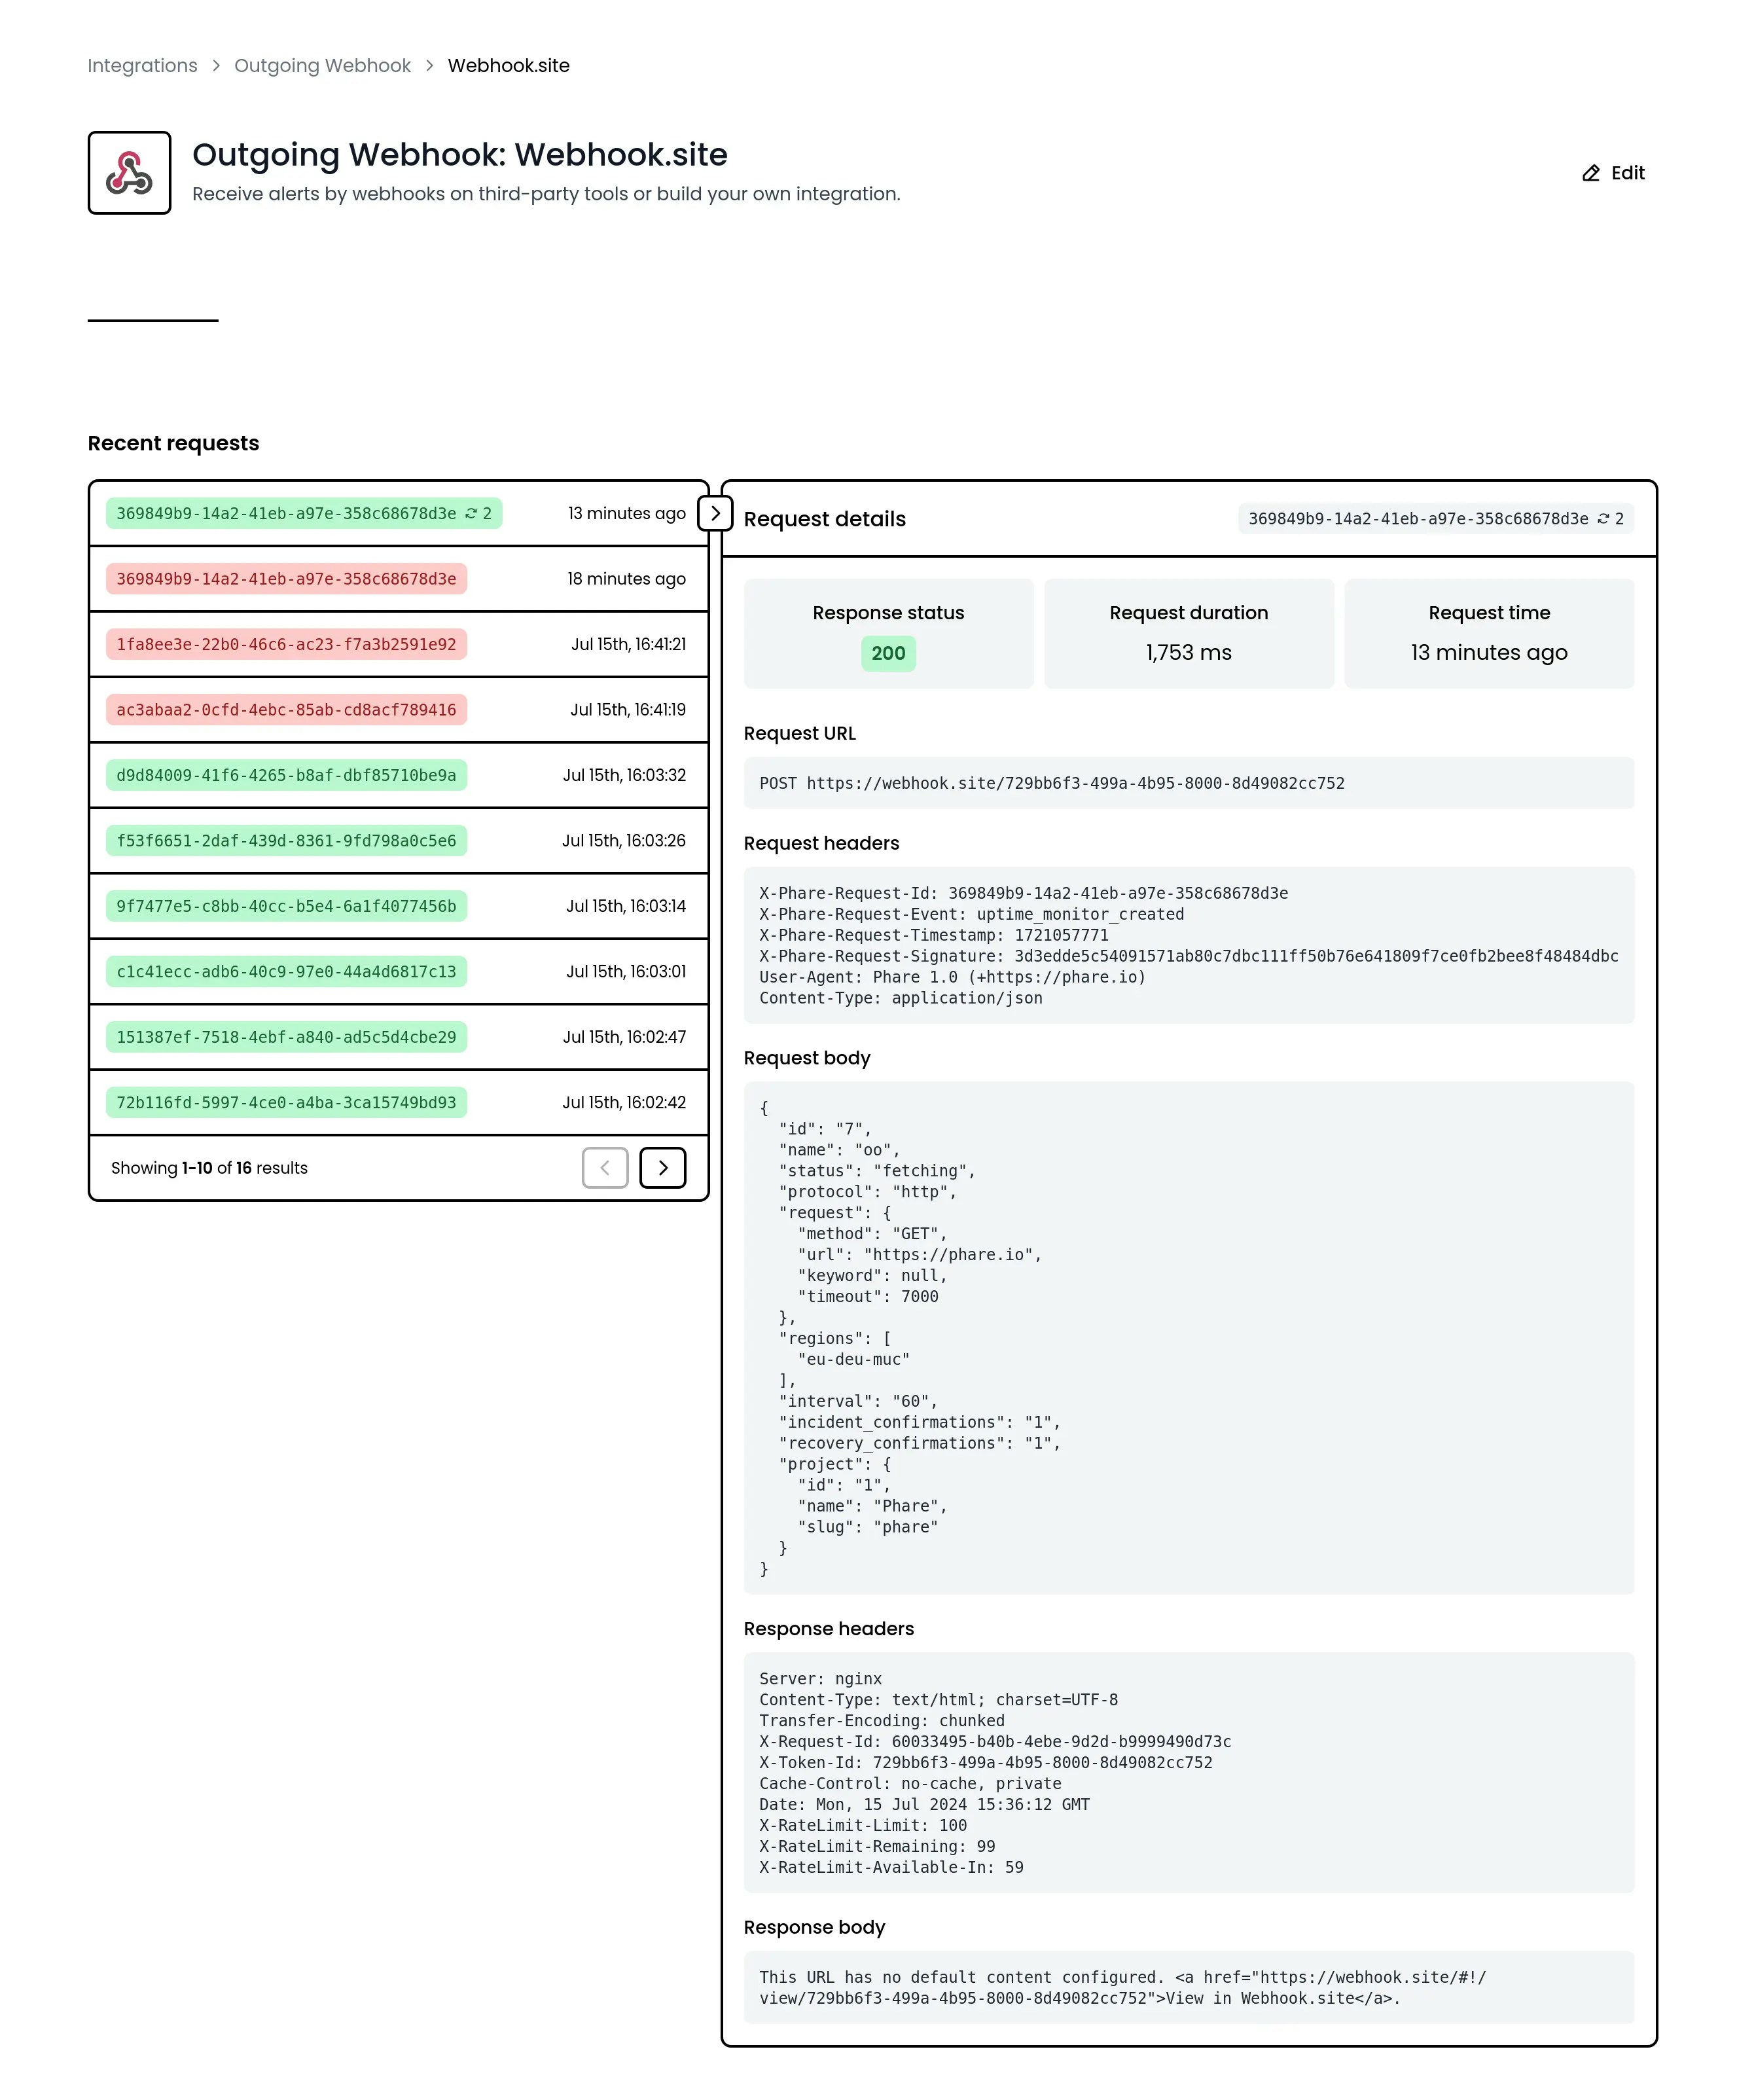
Webhooks are secured with an HMAC SHA-256 signature to ensure the authenticity of the payload in a way that is resistant to replay and timing attacks. A retry policy is also in place to ensure that your webhook is safely delivered, even if your server is temporarily down.
One more thing: you can also browse the history of the payloads sent to your webhook to easily debug and monitor the integration.
You can learn more about the outgoing webhooks integration in the documentation.
Billing quotas estimation
July 11th, 2024
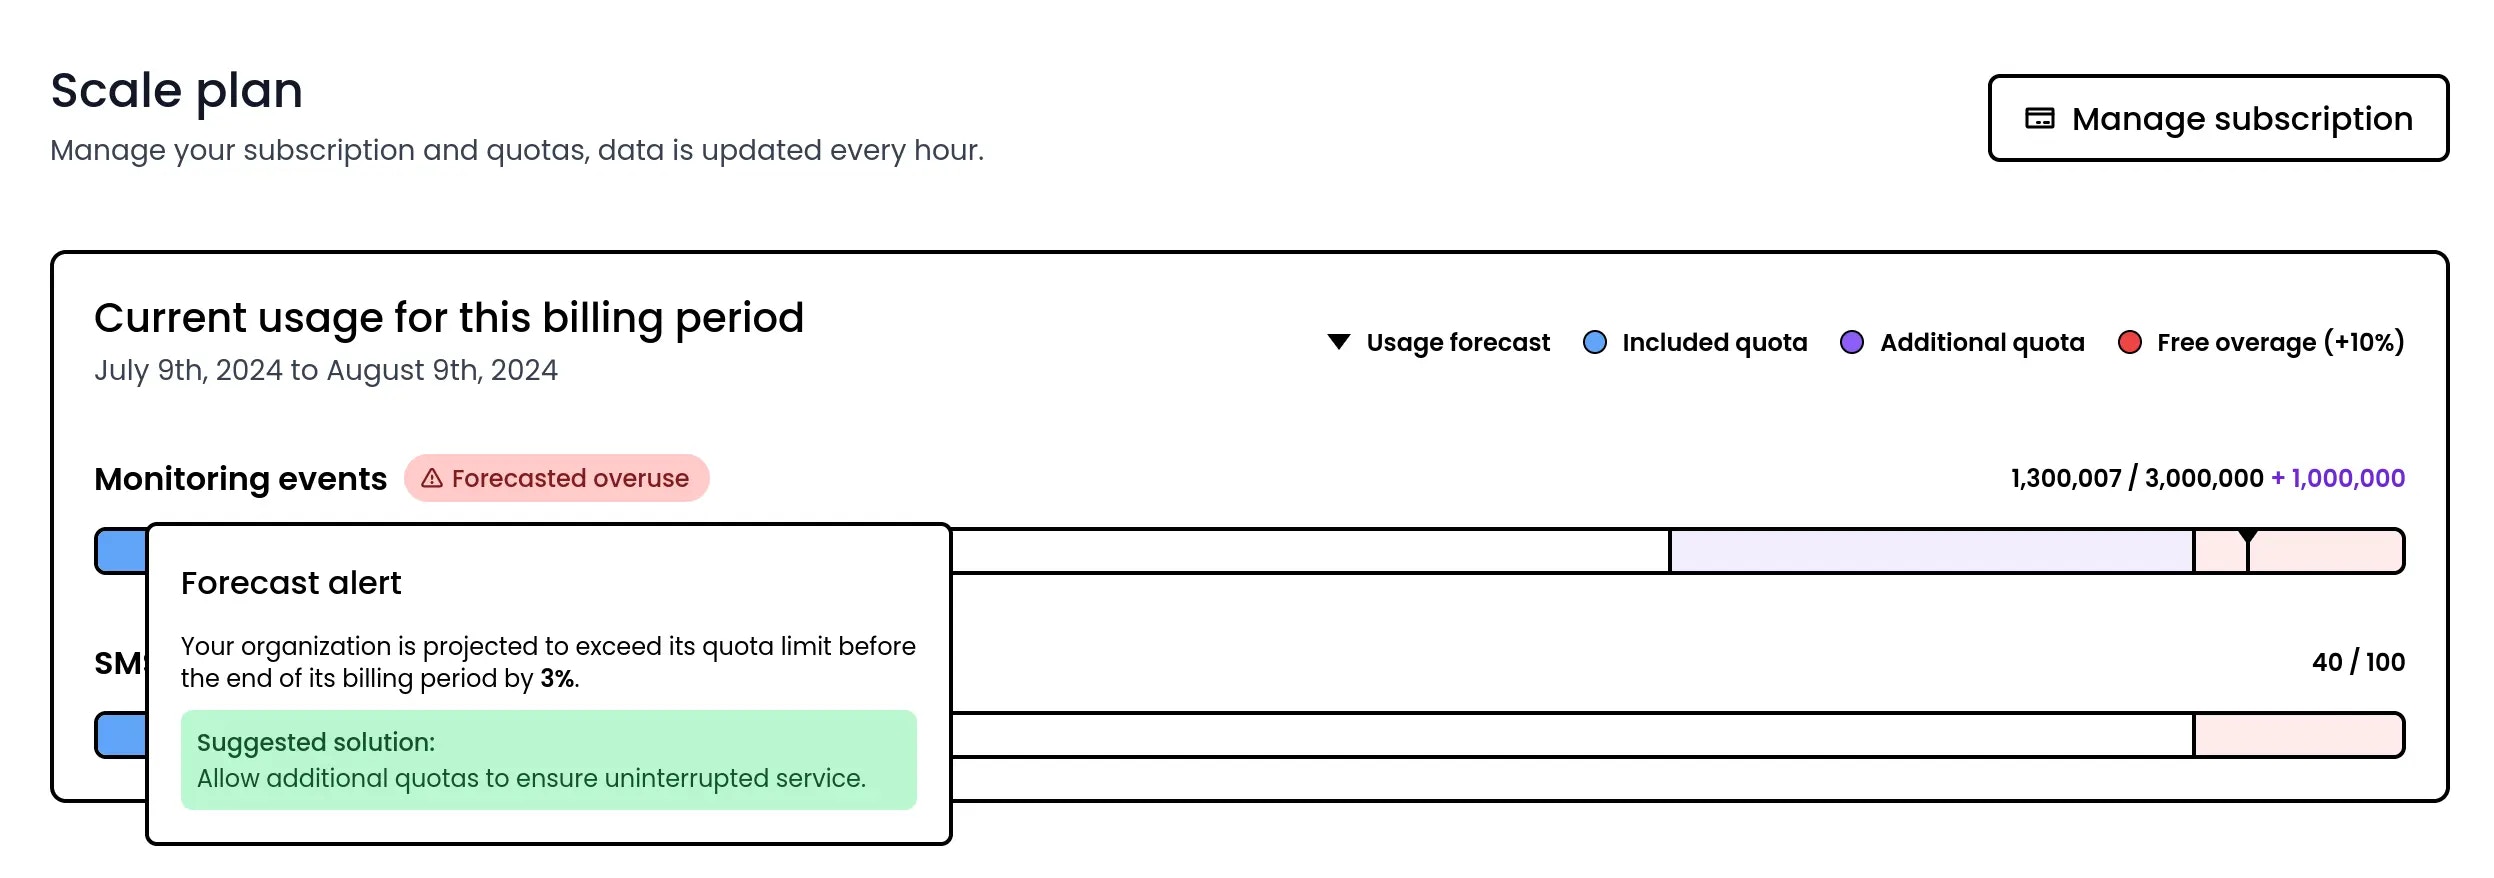
Billing quota forecasting has been released on the Phare platform. This new feature provides greater visibility into your billing quota usage, helping you manage your resources more effectively.
On your organization billing page, you can now see detailed forecasts of your quota usage. This includes predictions based on your current usage patterns, allowing you to plan ahead and avoid service interruptions.
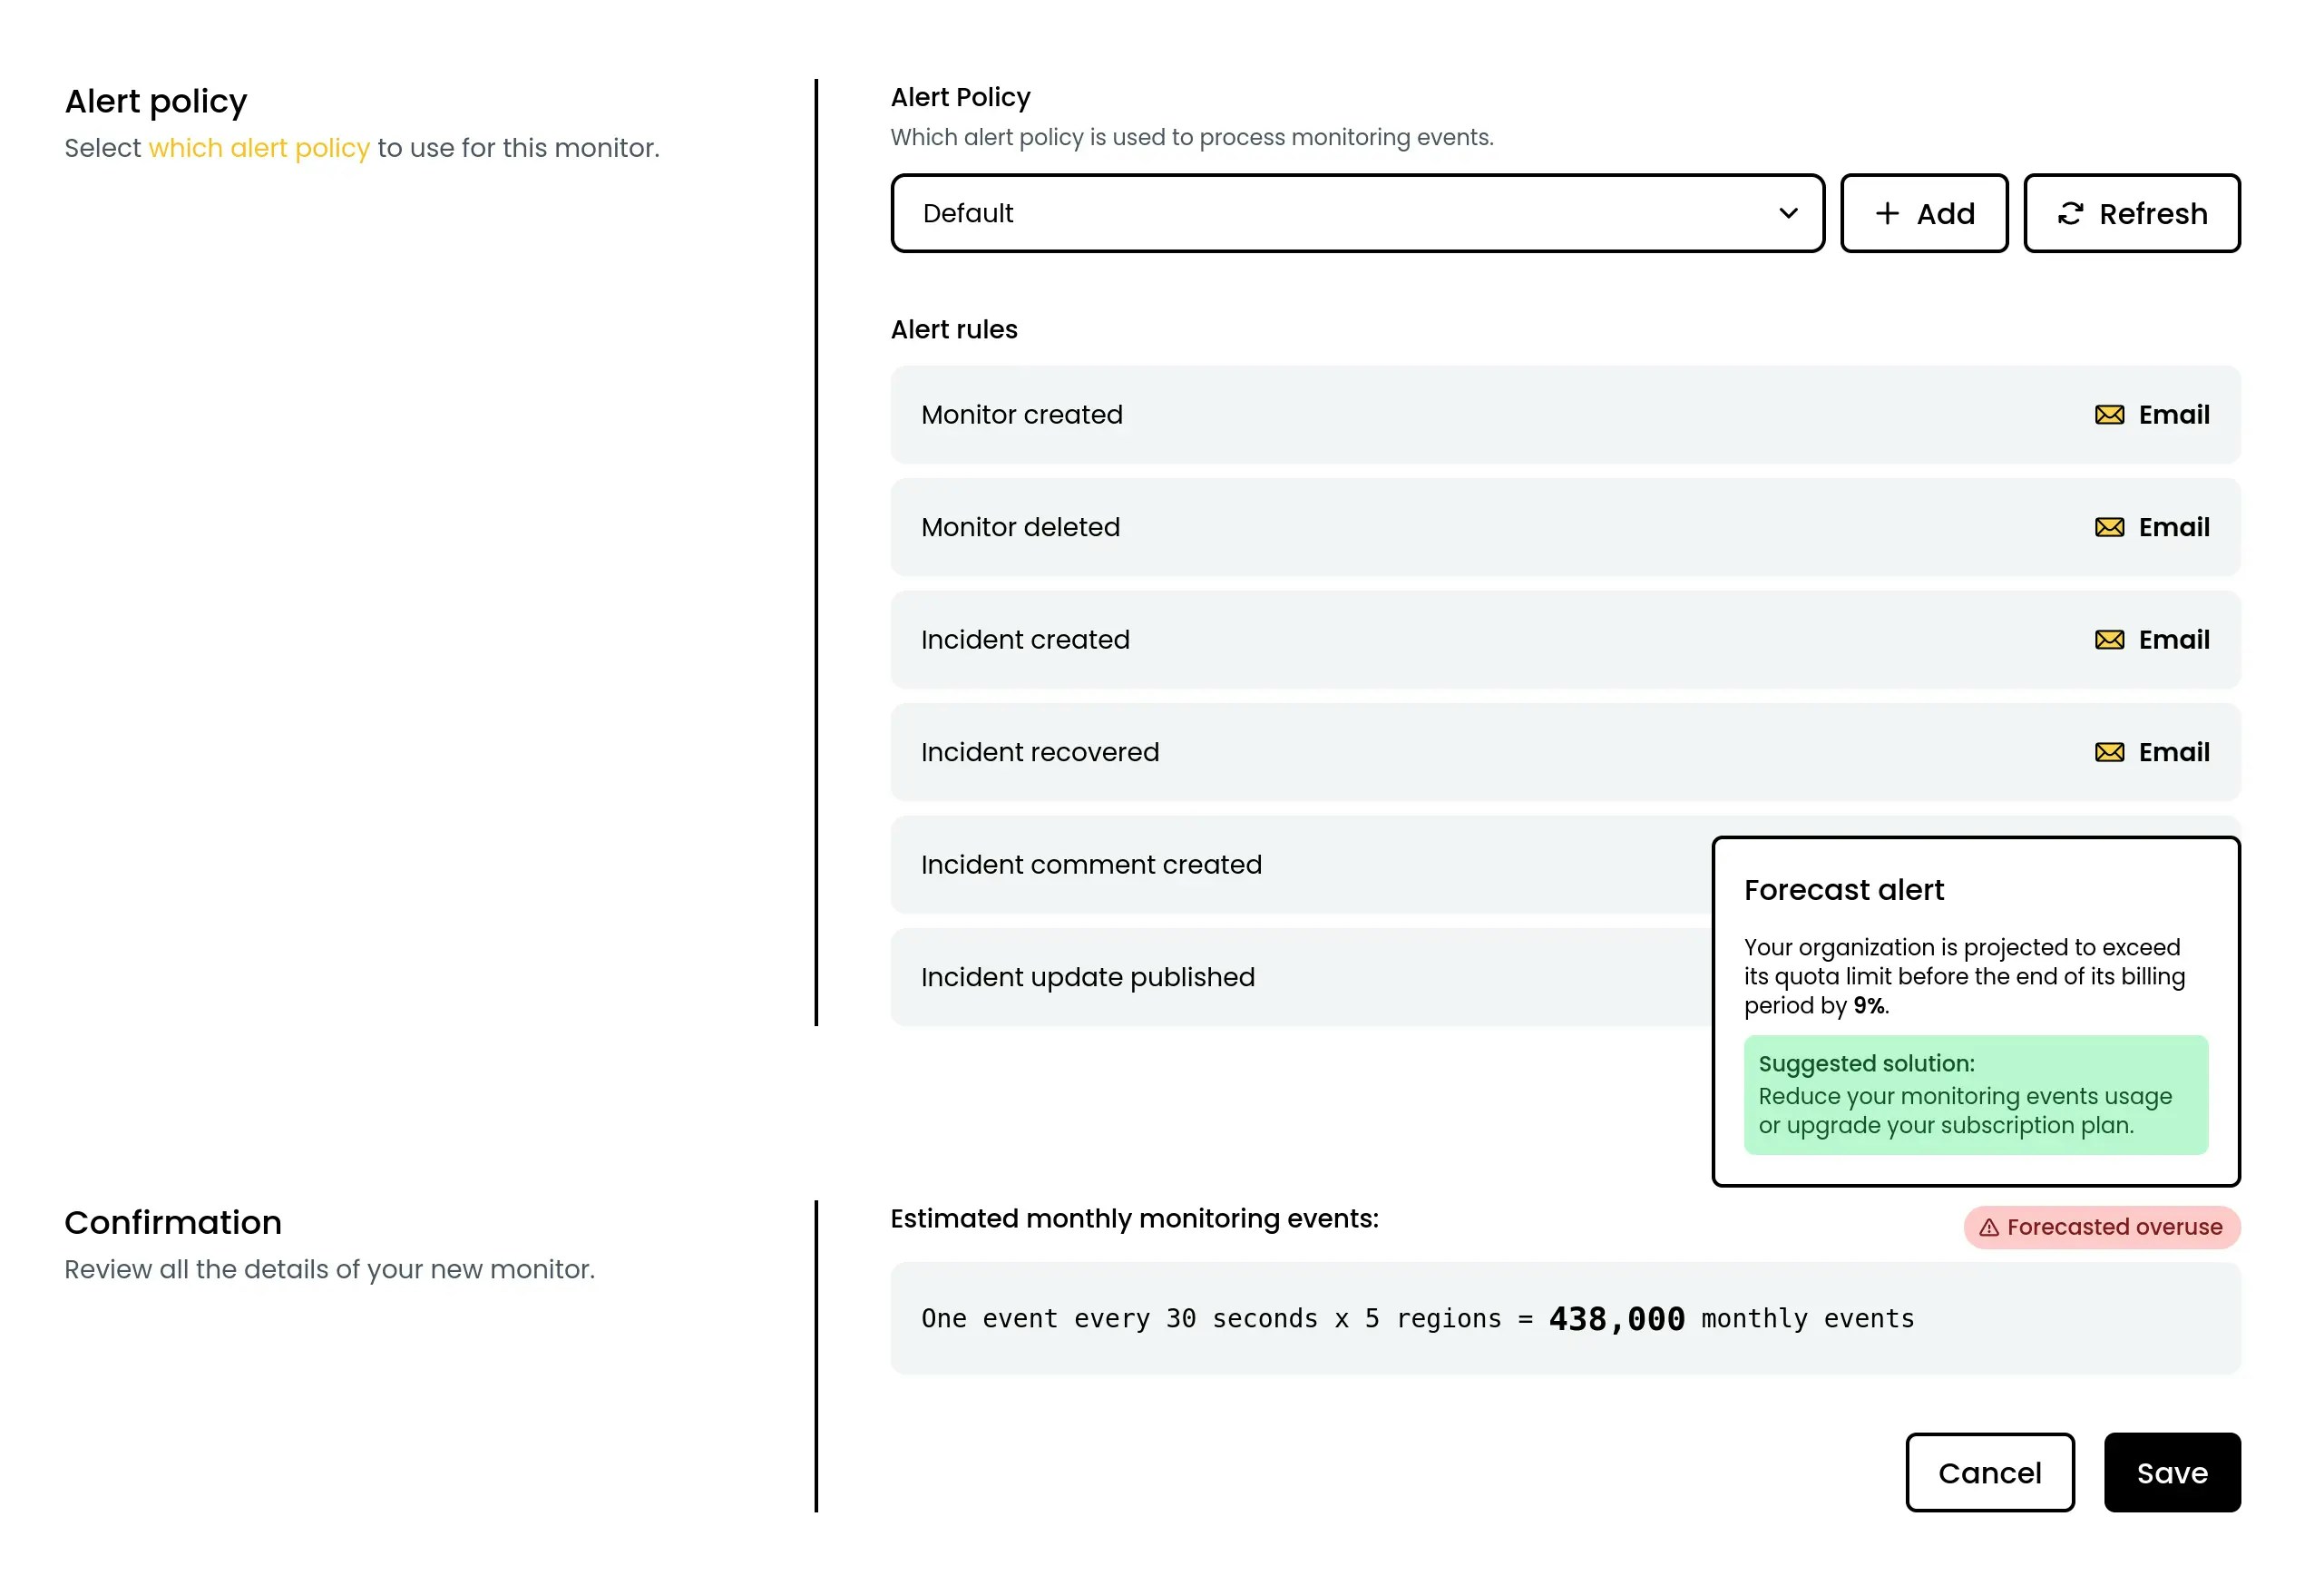
You will also be alerted when creating or updating a monitor if the action exceeds your monthly quota. This real-time feedback helps you make informed decisions and ensures that your monitoring setup remains within your desired limits.
Billing transparency is a key part of the Phare platform, and the tooling helps you monitor and control usage effectively.
New API endpoints: alert rules, incidents and status pages
July 7th, 2024
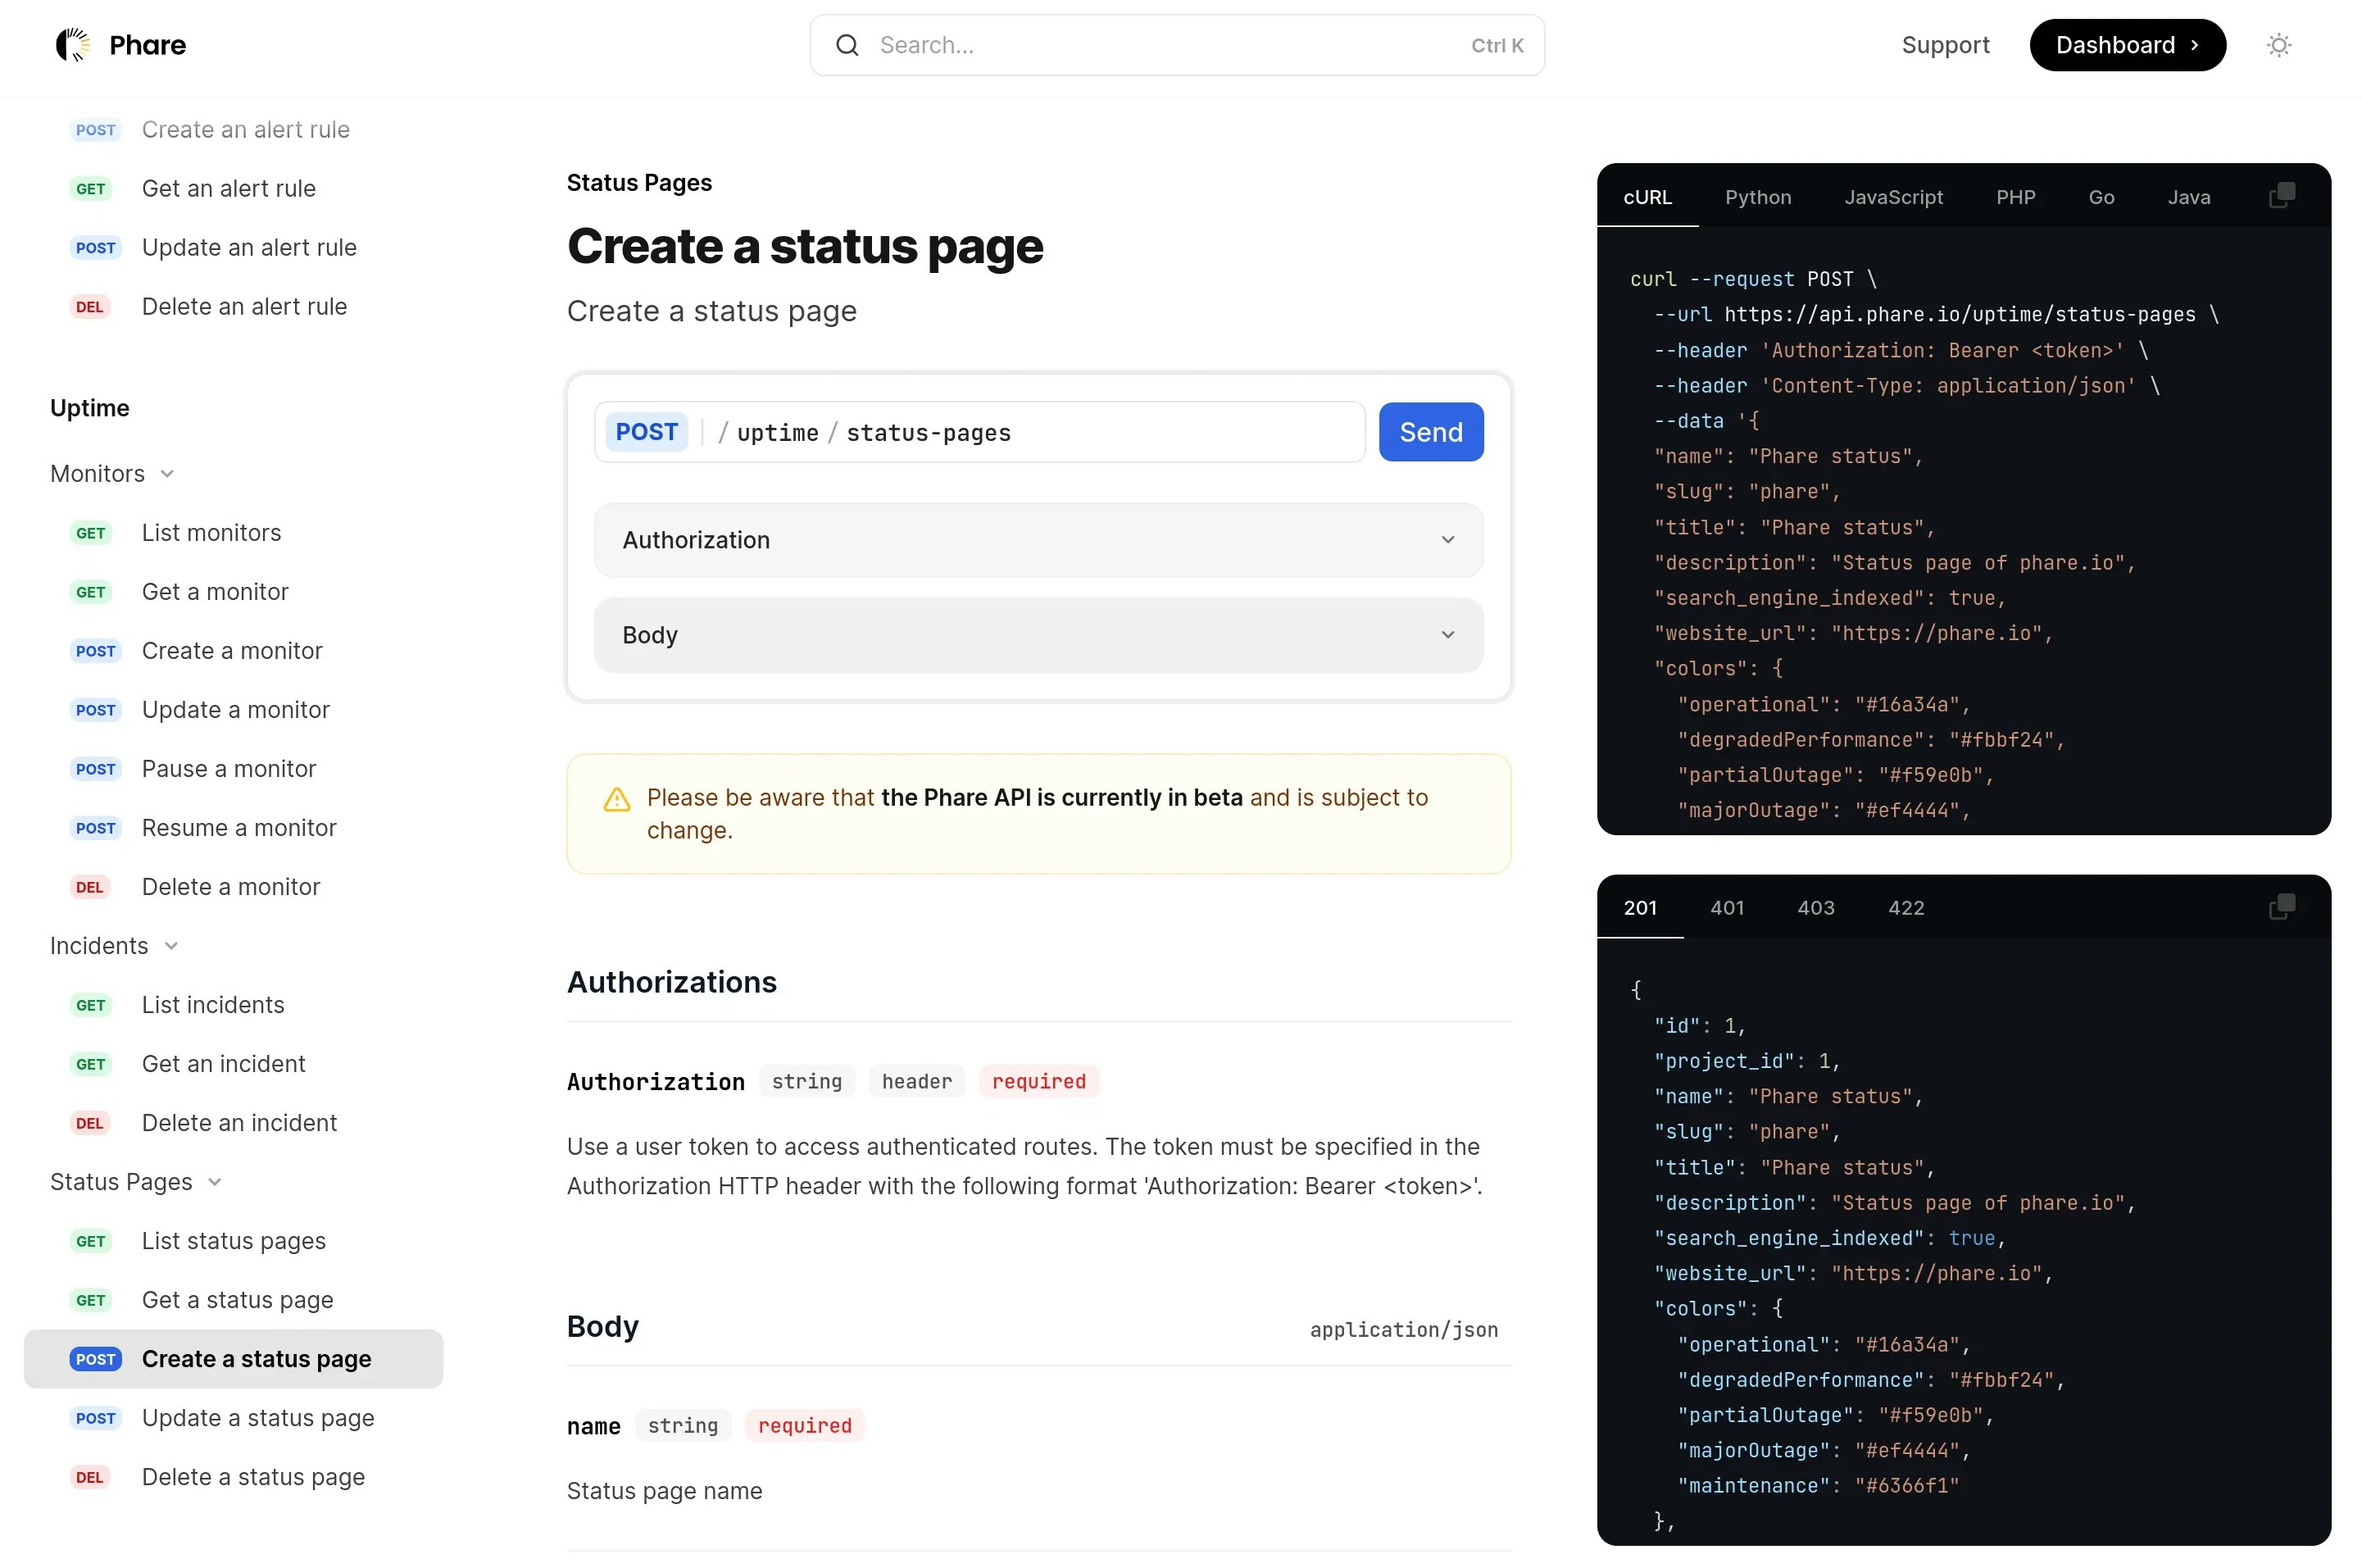
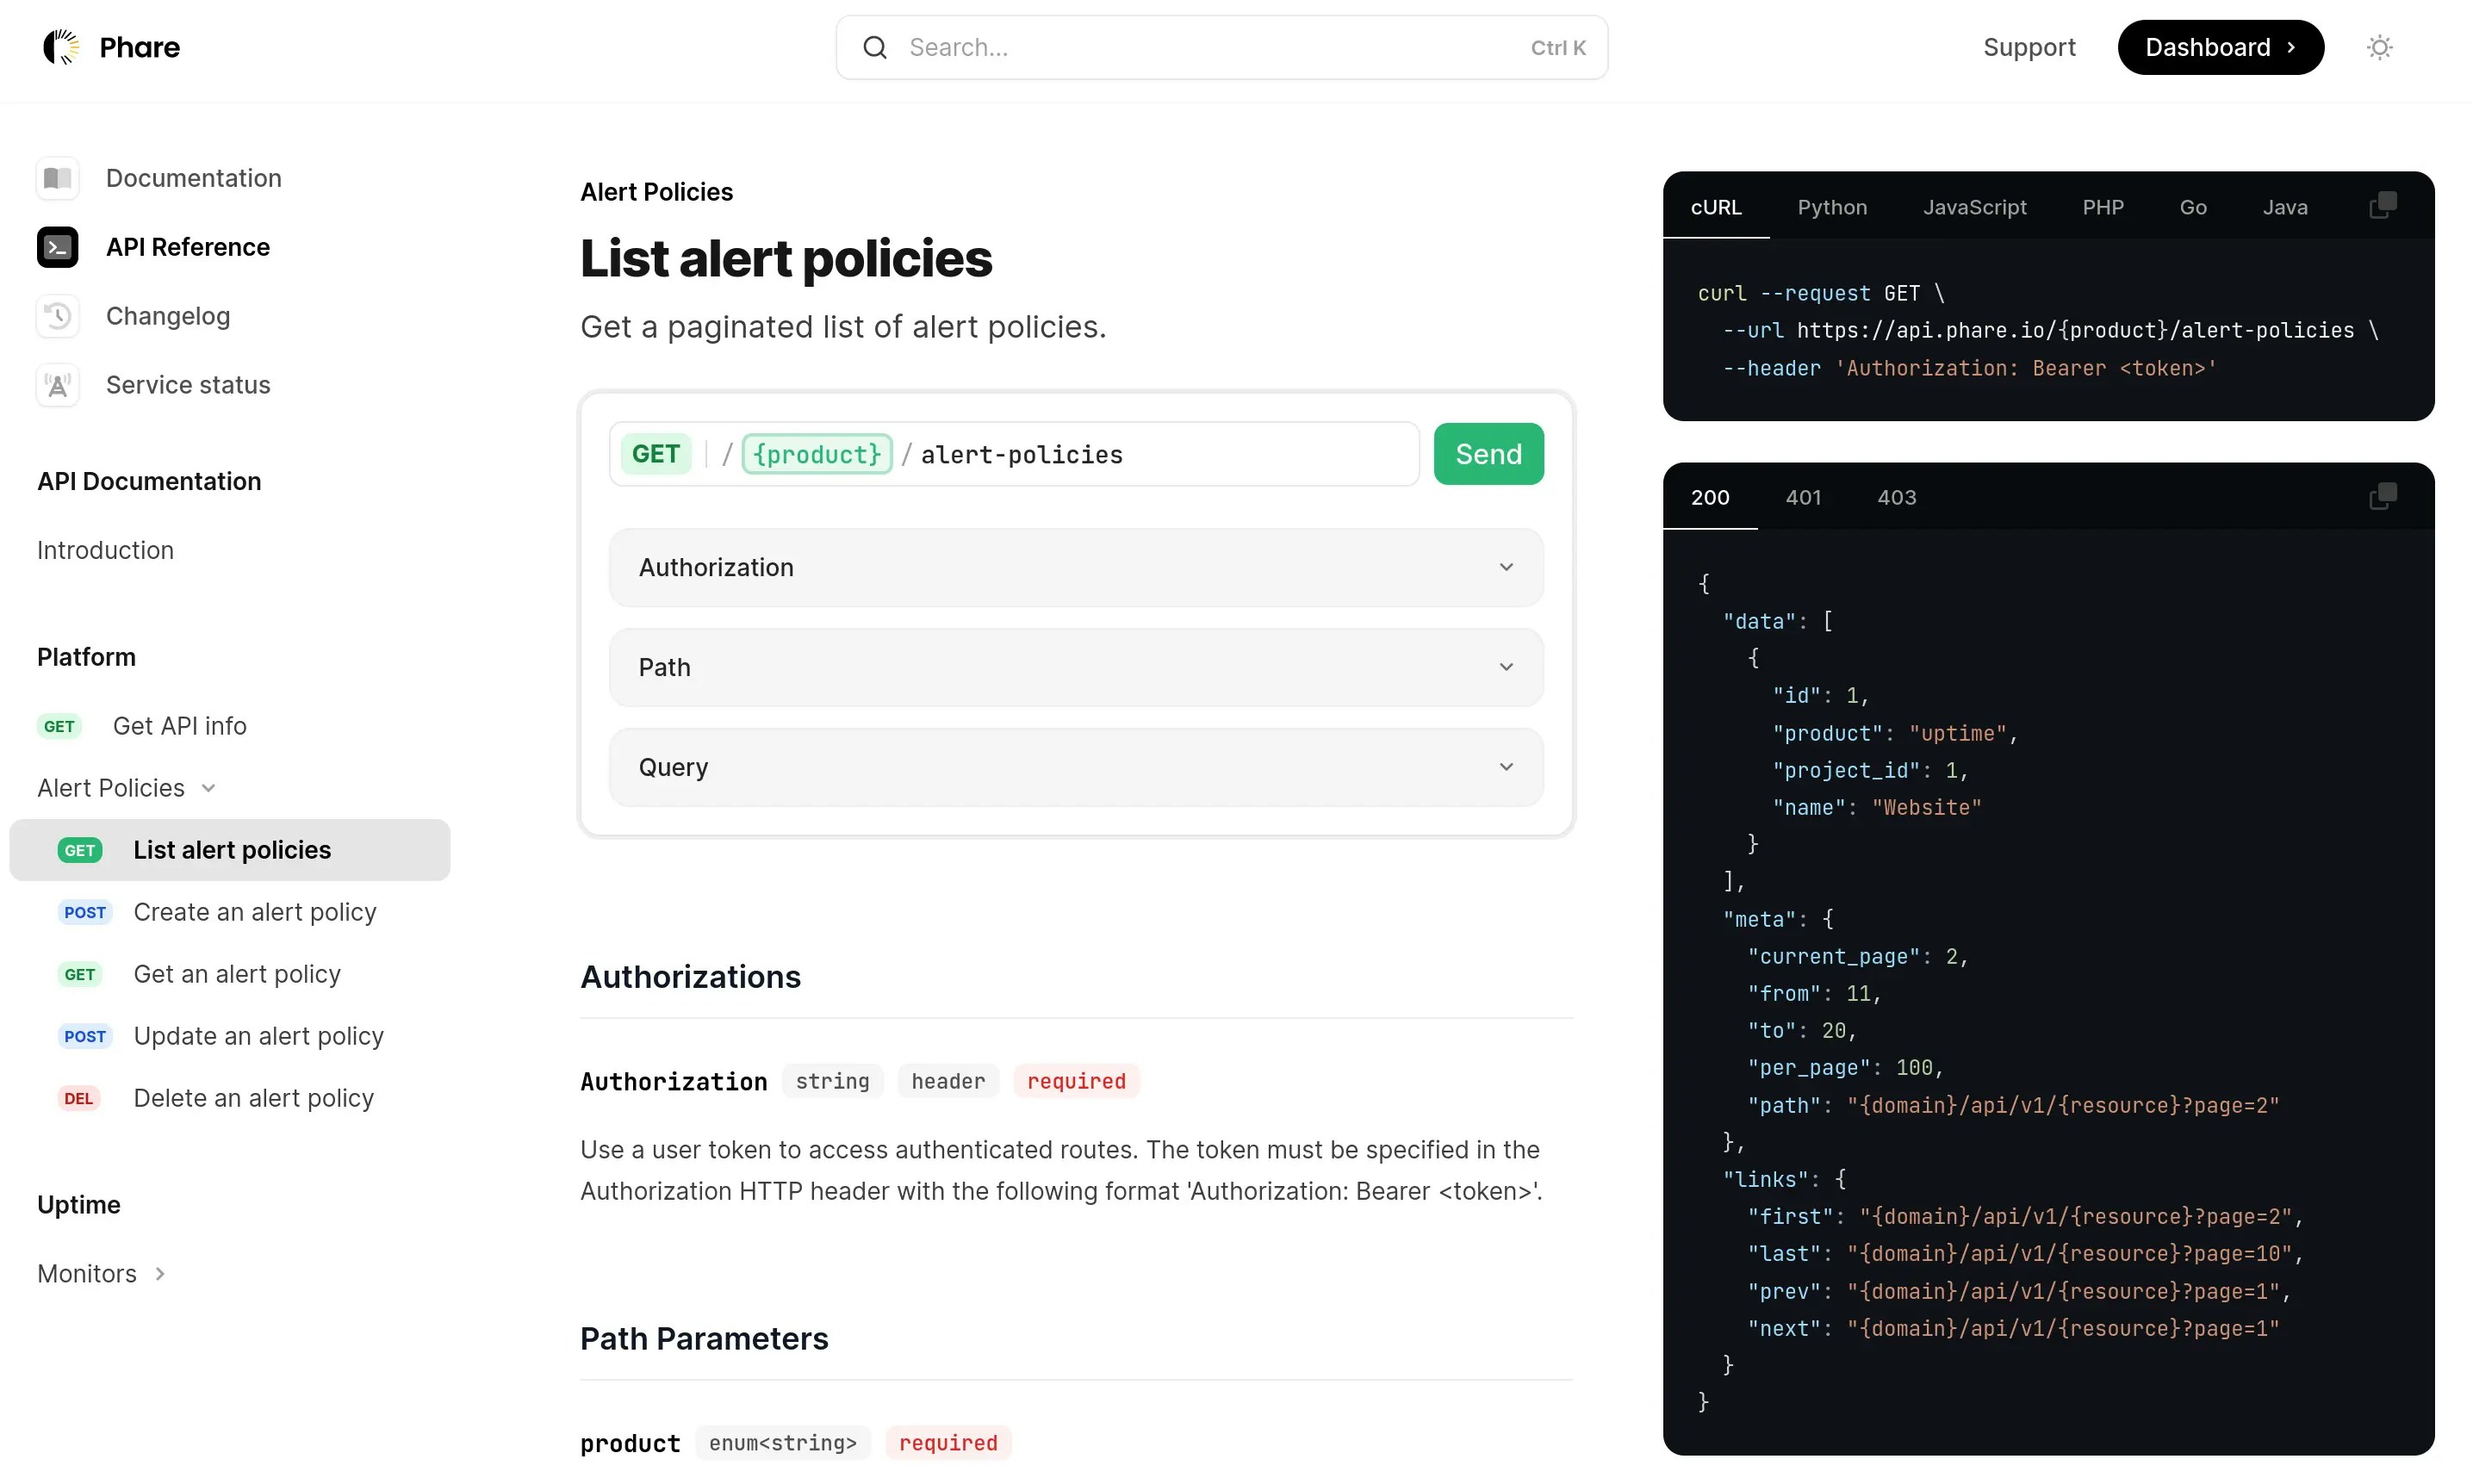
New API endpoints are available to help you programmatically interact with the Phare platform:
These new API endpoints enhance your ability to automate and streamline your monitoring, alerting, and incident management workflows, offering a more integrated and efficient approach to maintaining service reliability.
This release ends the current phase of API development with all major entities now available, allowing Phare to focus on stability and plan the end of the beta phase.
Monitoring timeout customization
July 4th, 2024
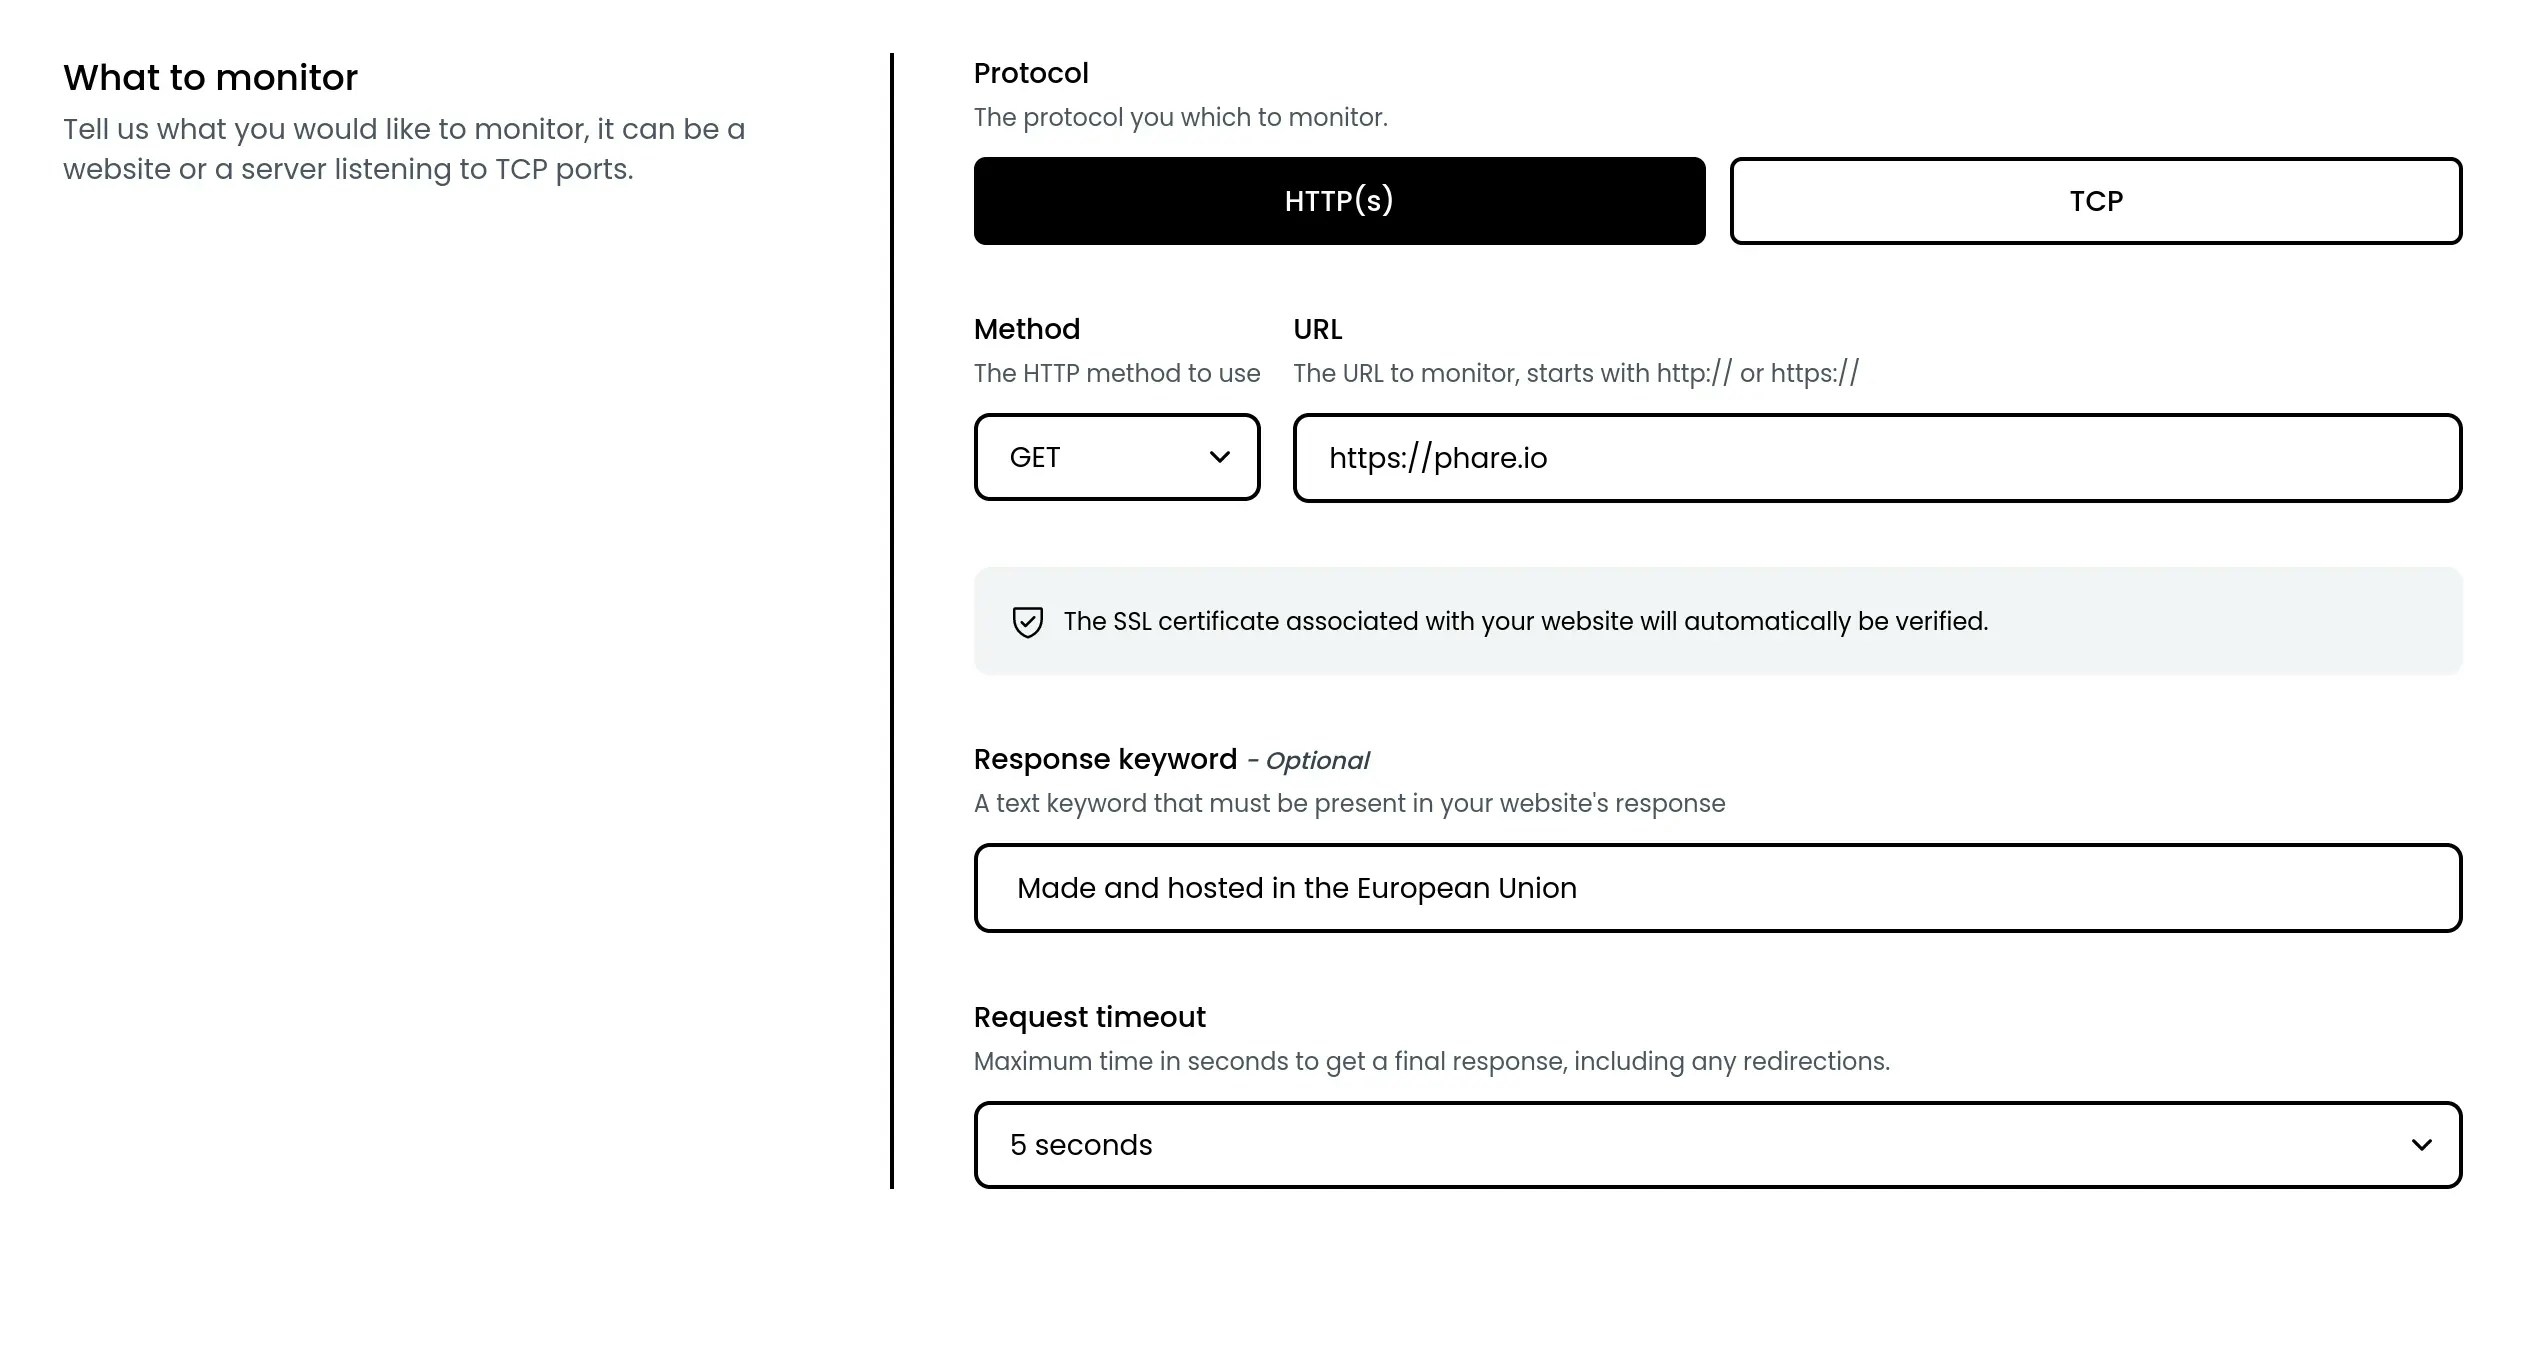
You can now customize the timeout duration for your monitors, offering greater control over your monitoring strategy for more accurate and reliable results.
This new feature allows you to set specific timeout values, taking into account DNS resolution, connection time, response time, and any redirections. By adjusting these settings, you can fine-tune the sensitivity of your checks to better meet your specific needs.
While the default timeout value of 7 seconds is optimized for most scenarios, providing a good balance and minimizing false positives, you now have the flexibility to modify this setting to better suit your unique requirements.
Smart monitoring suggestion
July 3rd, 2024
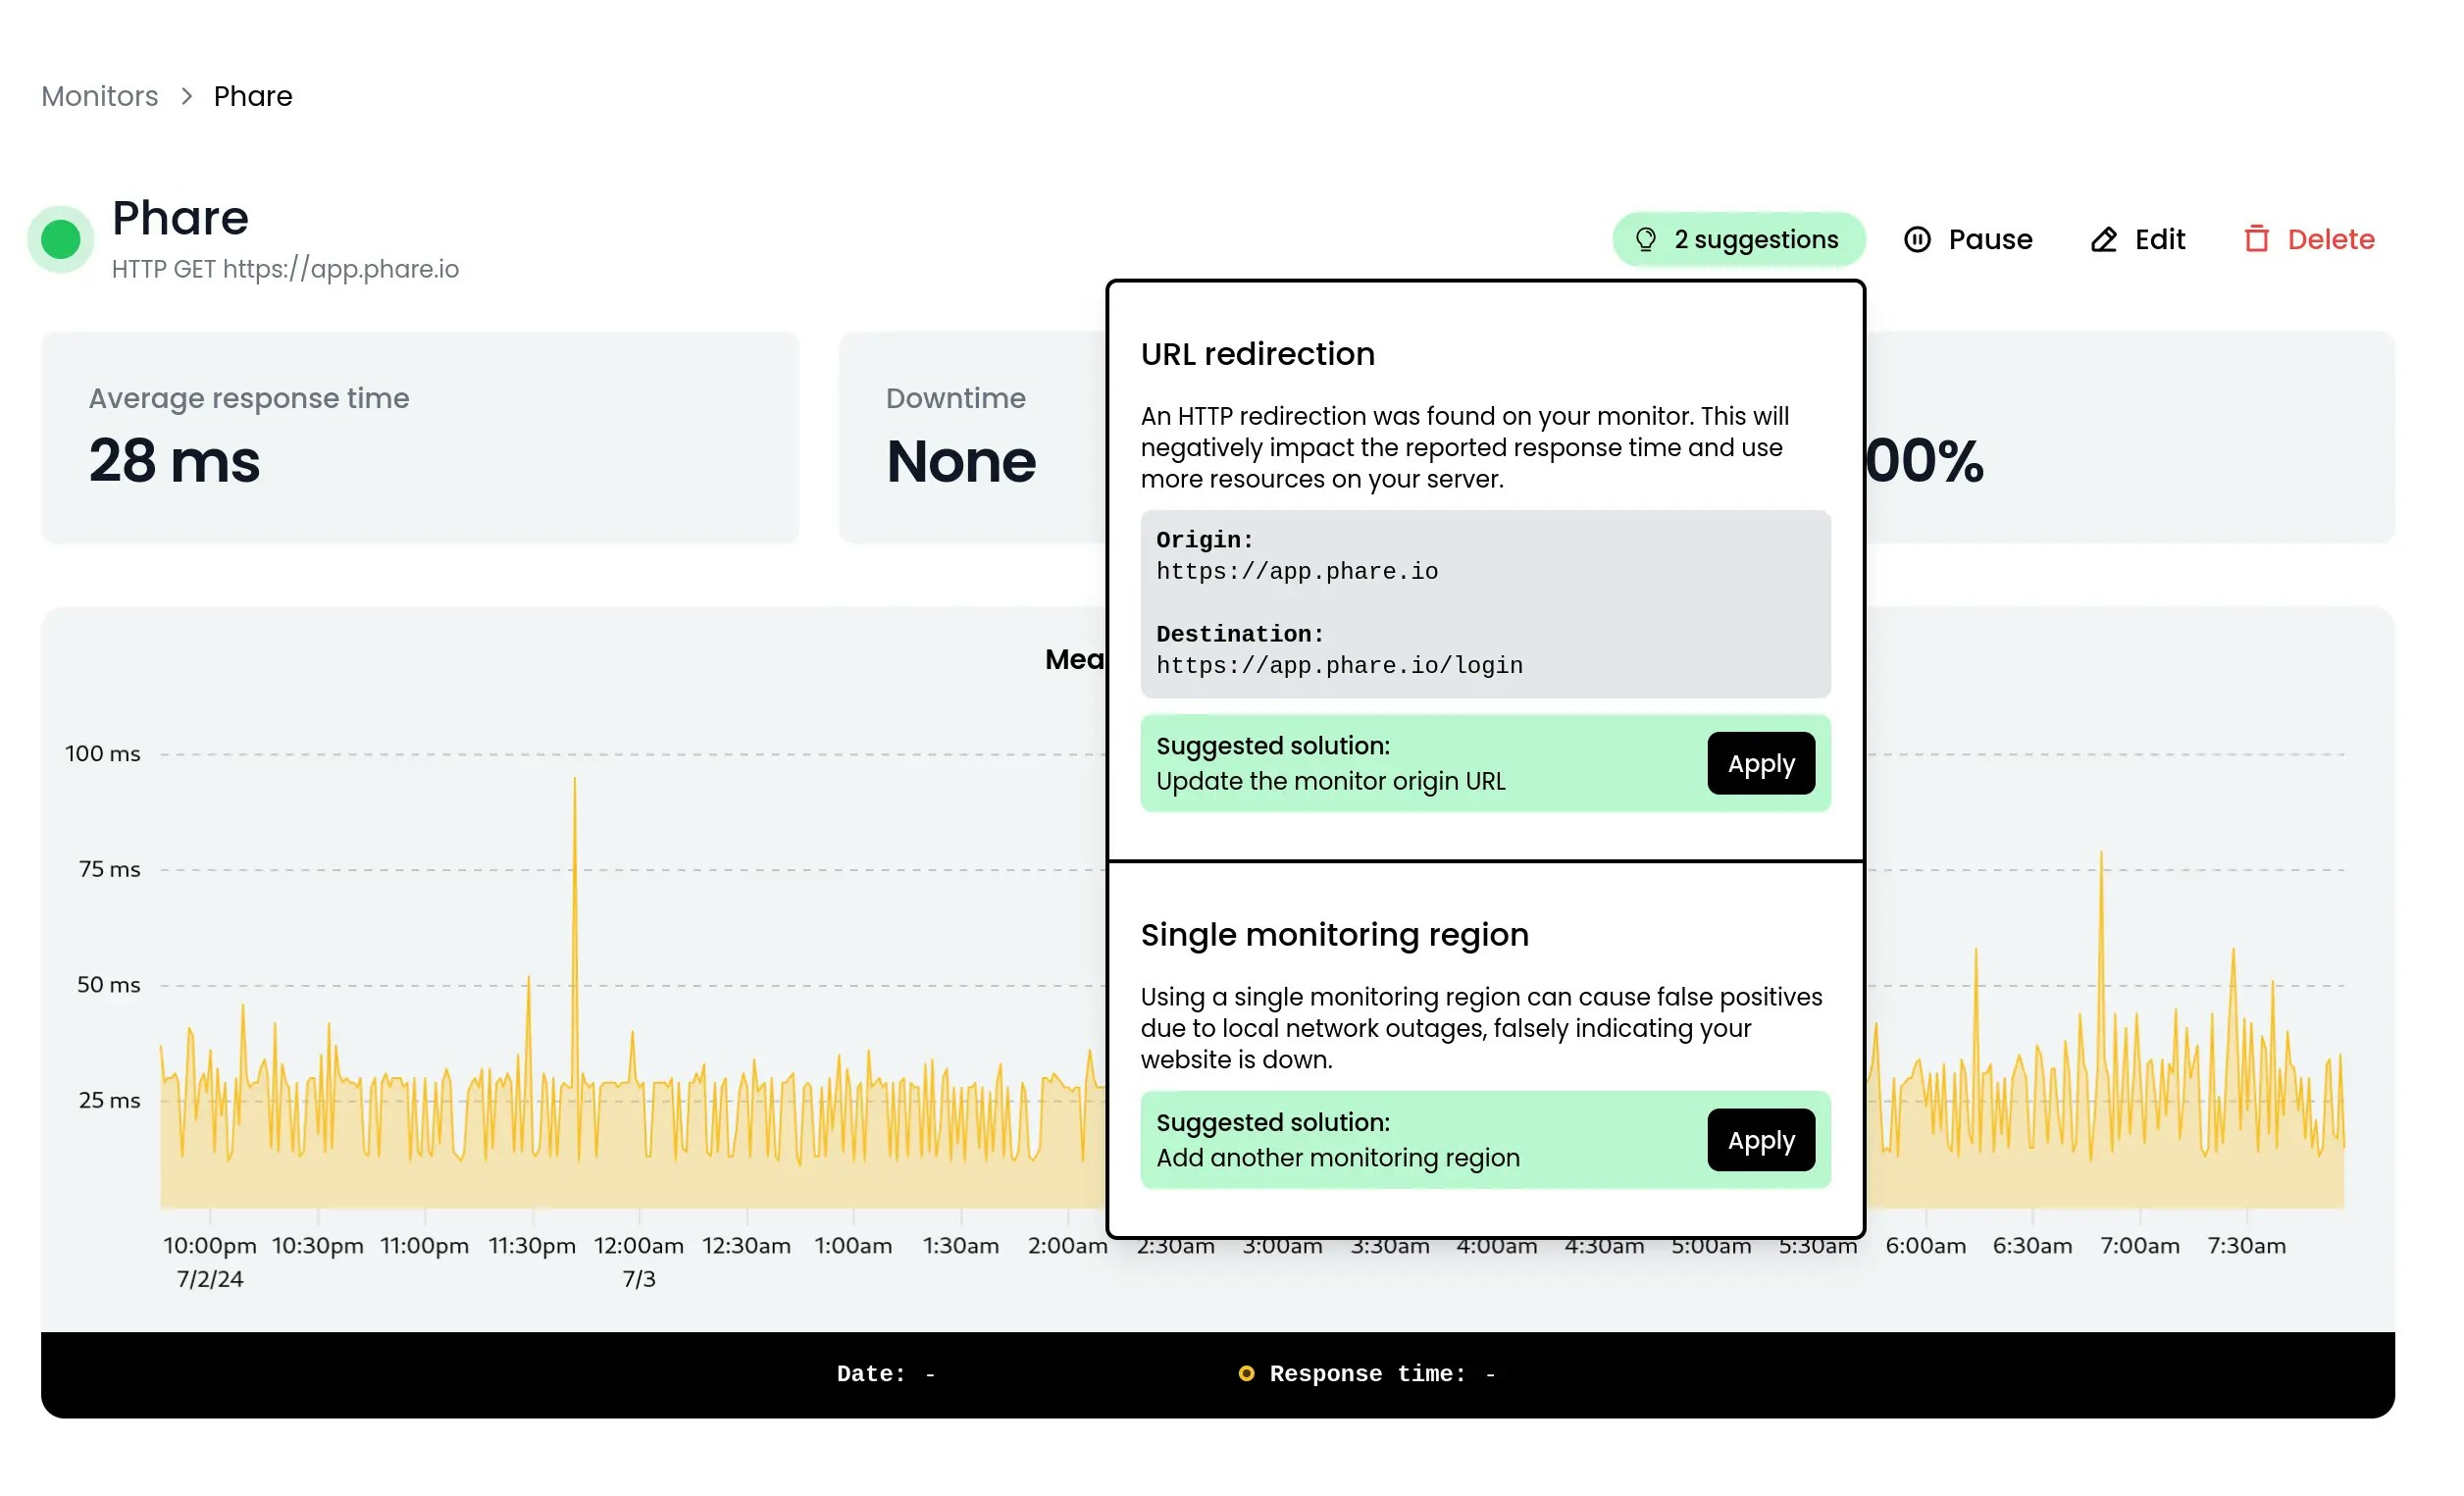
Phare is introducing smart monitoring suggestions, designed to help you effortlessly optimize your monitors. This new feature provides tailored recommendations to enhance the accuracy and reliability of your monitoring.
Smart Suggestions will alert you of unnecessary redirects, which can slow down your site’s reported performance, and recommend using multiple regions for monitoring if you currently use only a single region. By following these suggestions, you can ensure more comprehensive coverage and faster detection of potential issues.
30 second monitoring interval
July 2nd, 2024
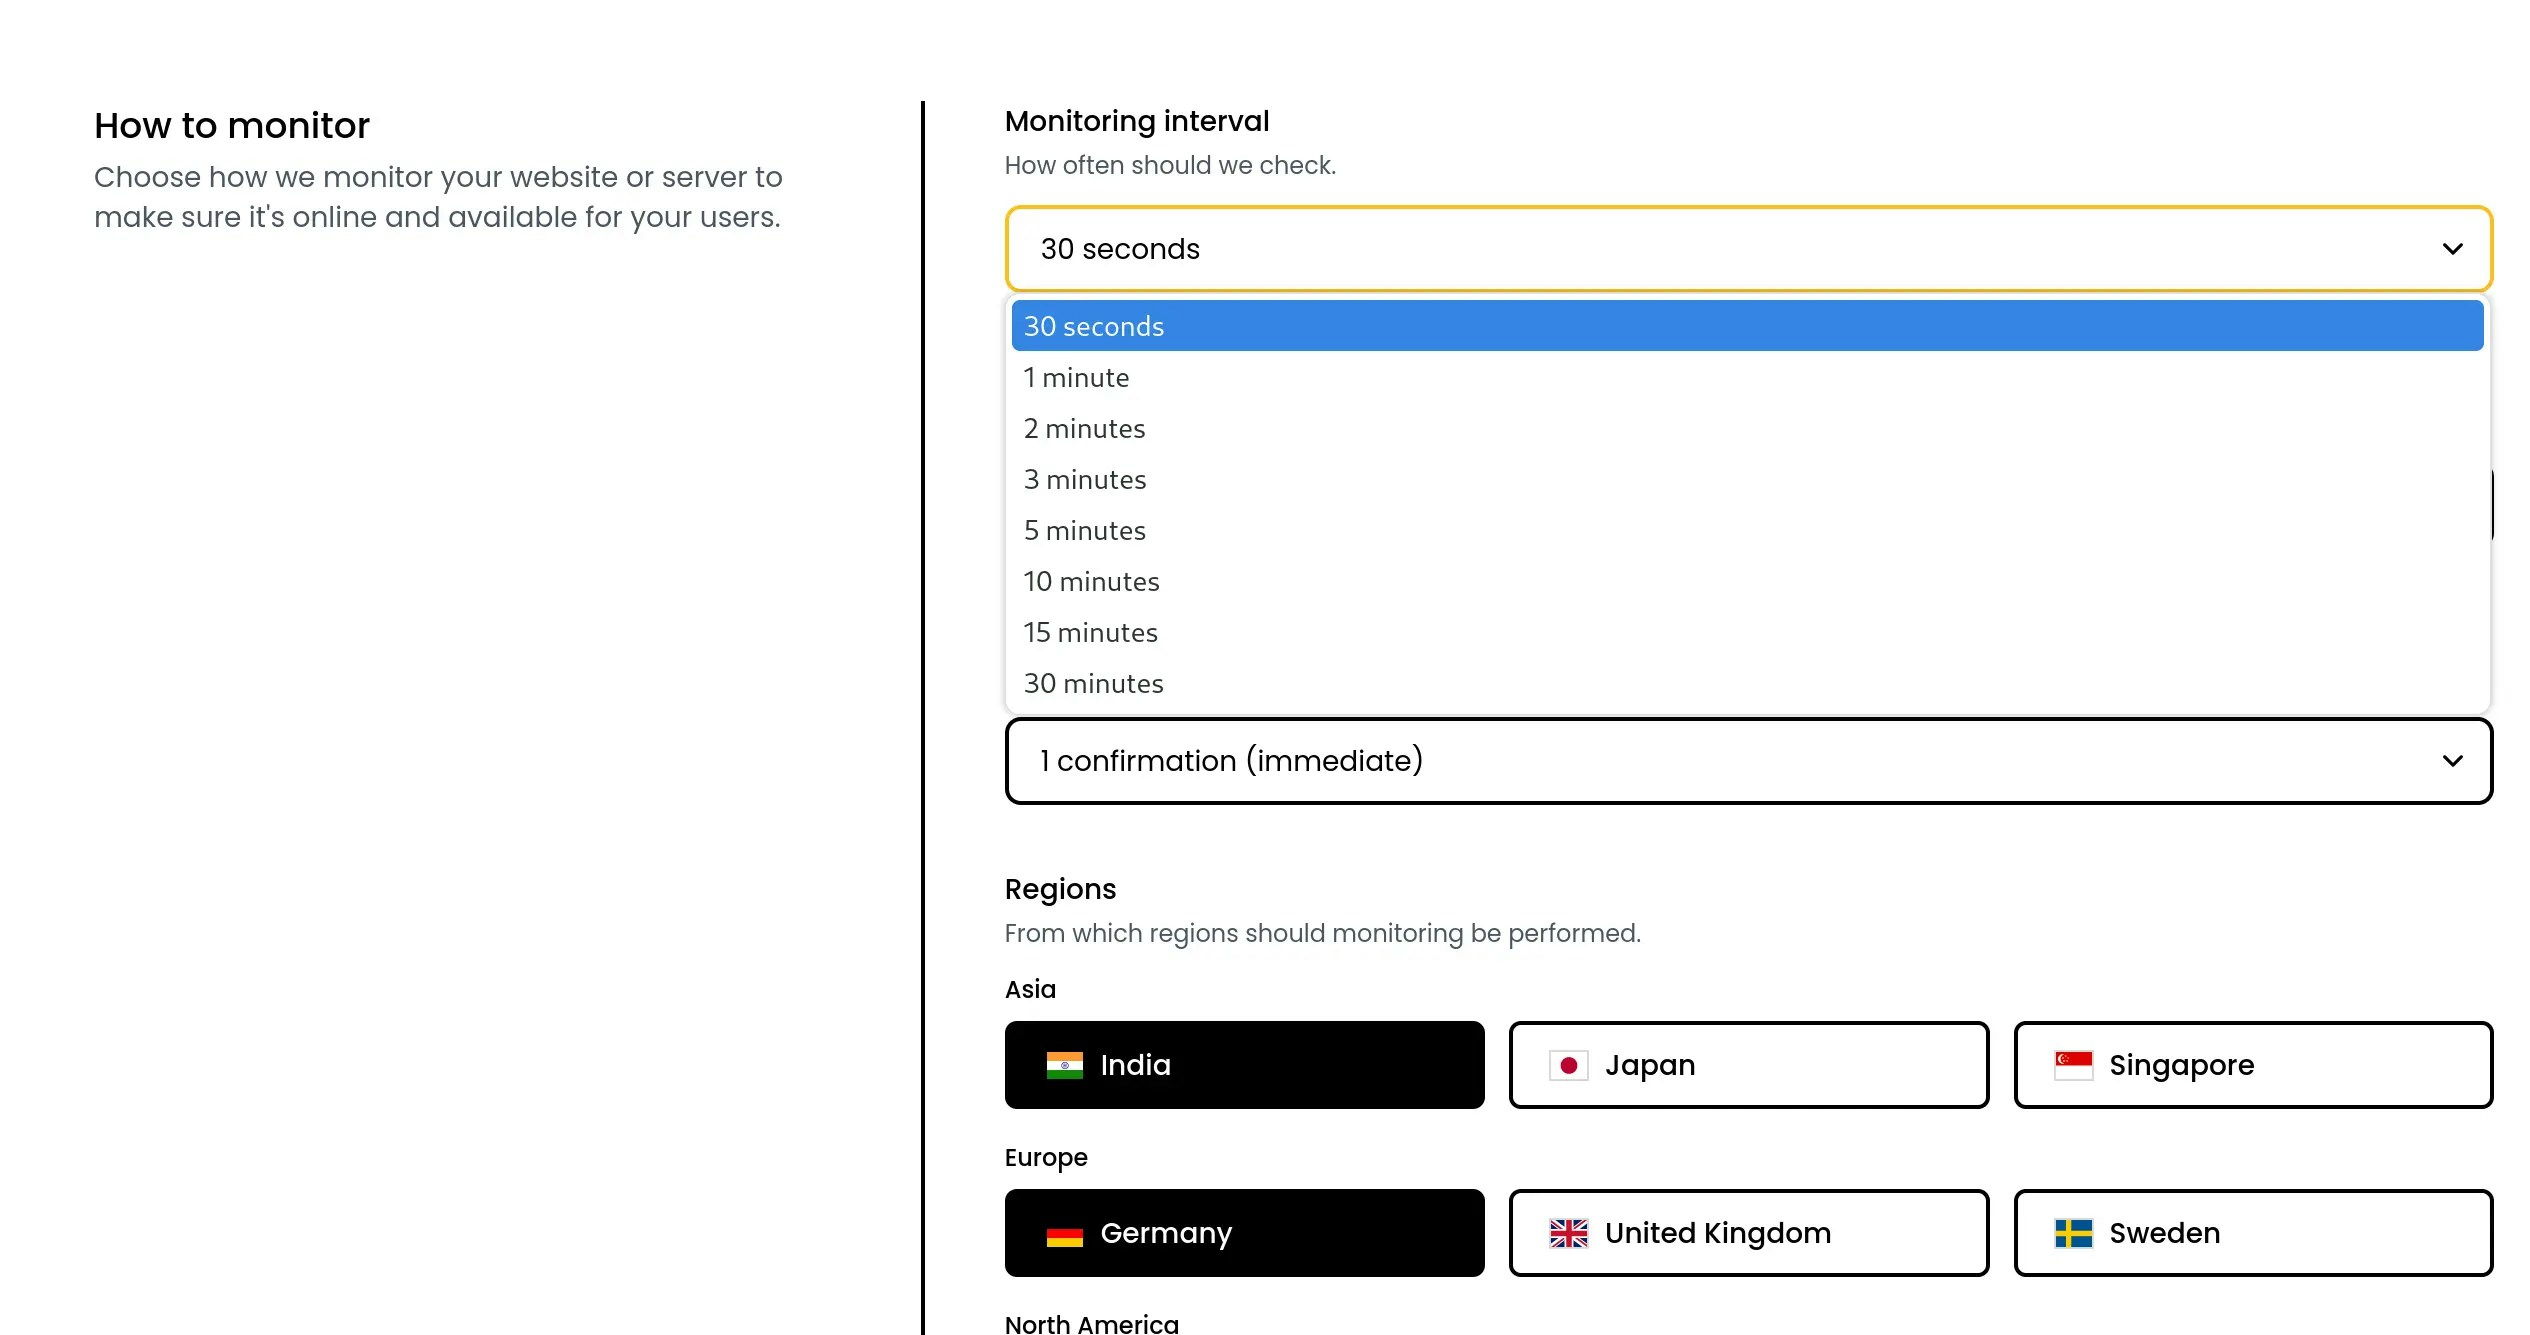
Phare enters the realm of sub-minute monitoring with the introduction of a new 30-second monitoring interval for your monitors.
With this update, you can detect and respond to issues faster than ever, ensuring that your services remain reliable with minimal downtime. The 30-second checks are available to all users, offering a higher level of detail and control over your monitoring strategy.
New changelog
July 1st, 2024
Phare’s changelog has moved to the documentation site to harmonize how new Phare features are documented. All previous entries were migrated to this page. This new format should allow faster and more frequent updates.
New monitoring regions
May 28th, 2024
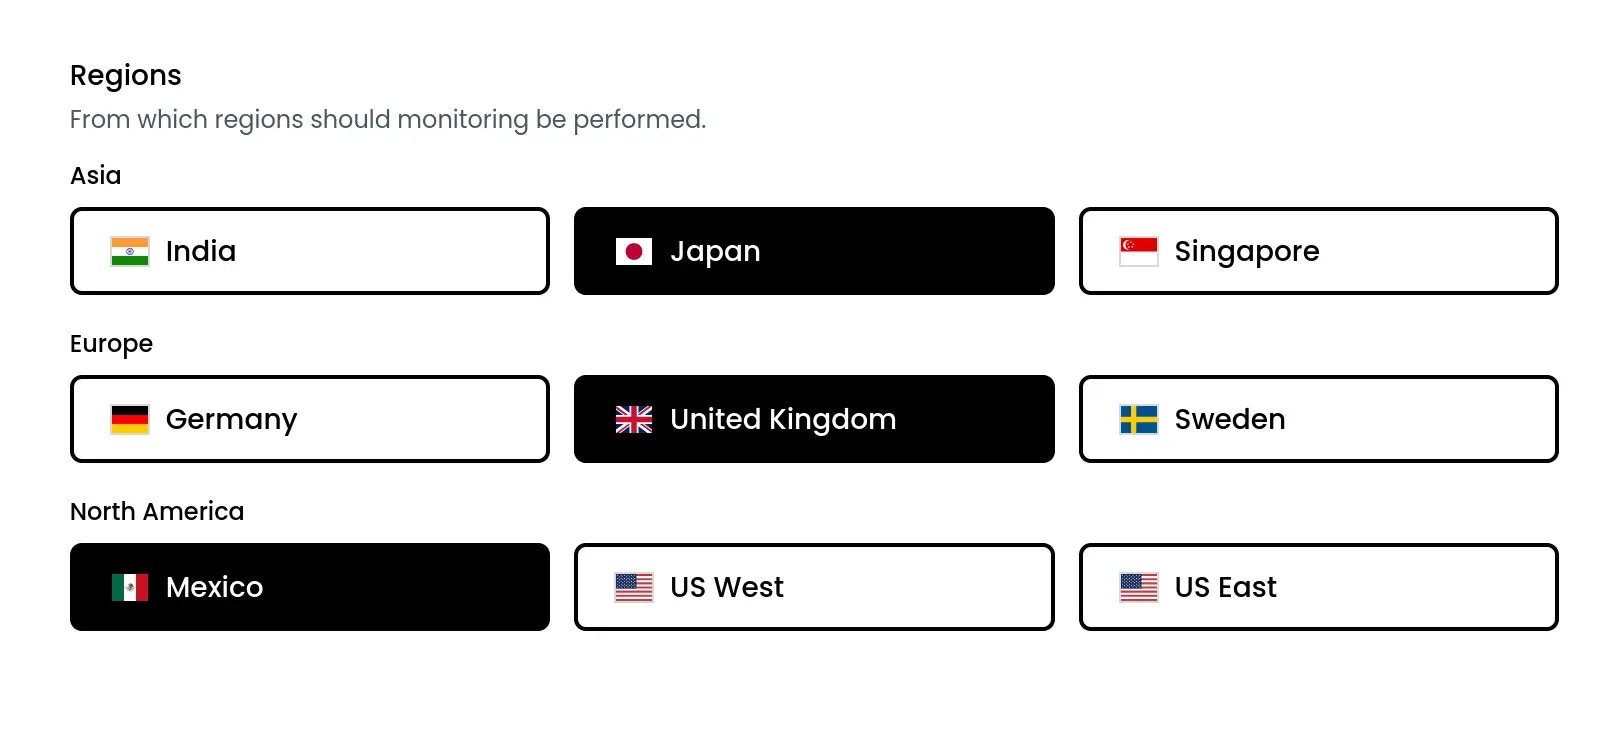
Following a recent monitoring infrastructure migration, three new regions are released for uptime monitoring:
Say hello to Japan, the United Kingdom and Mexico.
New monitoring infrastructure
May 26th, 2024
Phare’s monitoring infrastructure is the biggest operating cost and most important piece of the Phare Uptime product. As Phare performs millions of monitoring checks from many regions around the world, this infrastructure should be scalable, efficient, and most importantly reliable. As the platform grew over the past few months, the previous solution based on AWS Lambda started to show its limits in terms of performance and cost, forcing a search for an alternative solution.
Phare has migrated all monitoring checks to a newly written infrastructure based on Cloudflare workers. This solution helps maintain a generous free plan and competitive pricing for paid customers.
Alert policies API
May 24th, 2024
API endpoints to manage alert policies have been released and documented.
REST API
May 20th, 2024
The Phare REST API has been released with associated documentation. All endpoints required to manage monitors are already available. Other endpoints will be added in the next few weeks until all the actions you can perform in your dashboard can also be done programmatically.
You will need to generate an API key to authenticate your organization. You can choose an access scope (Read / Write) for each Phare product as well as access to the resources of the Phare platform.
More information is available on the API documentation page.
New Documentation
May 15th, 2024
Documentation has been moved to docs.phare.io and offers an improved user experience. The documentation source code has also been published to GitHub, allowing anyone to contribute.
May 7th, 2024
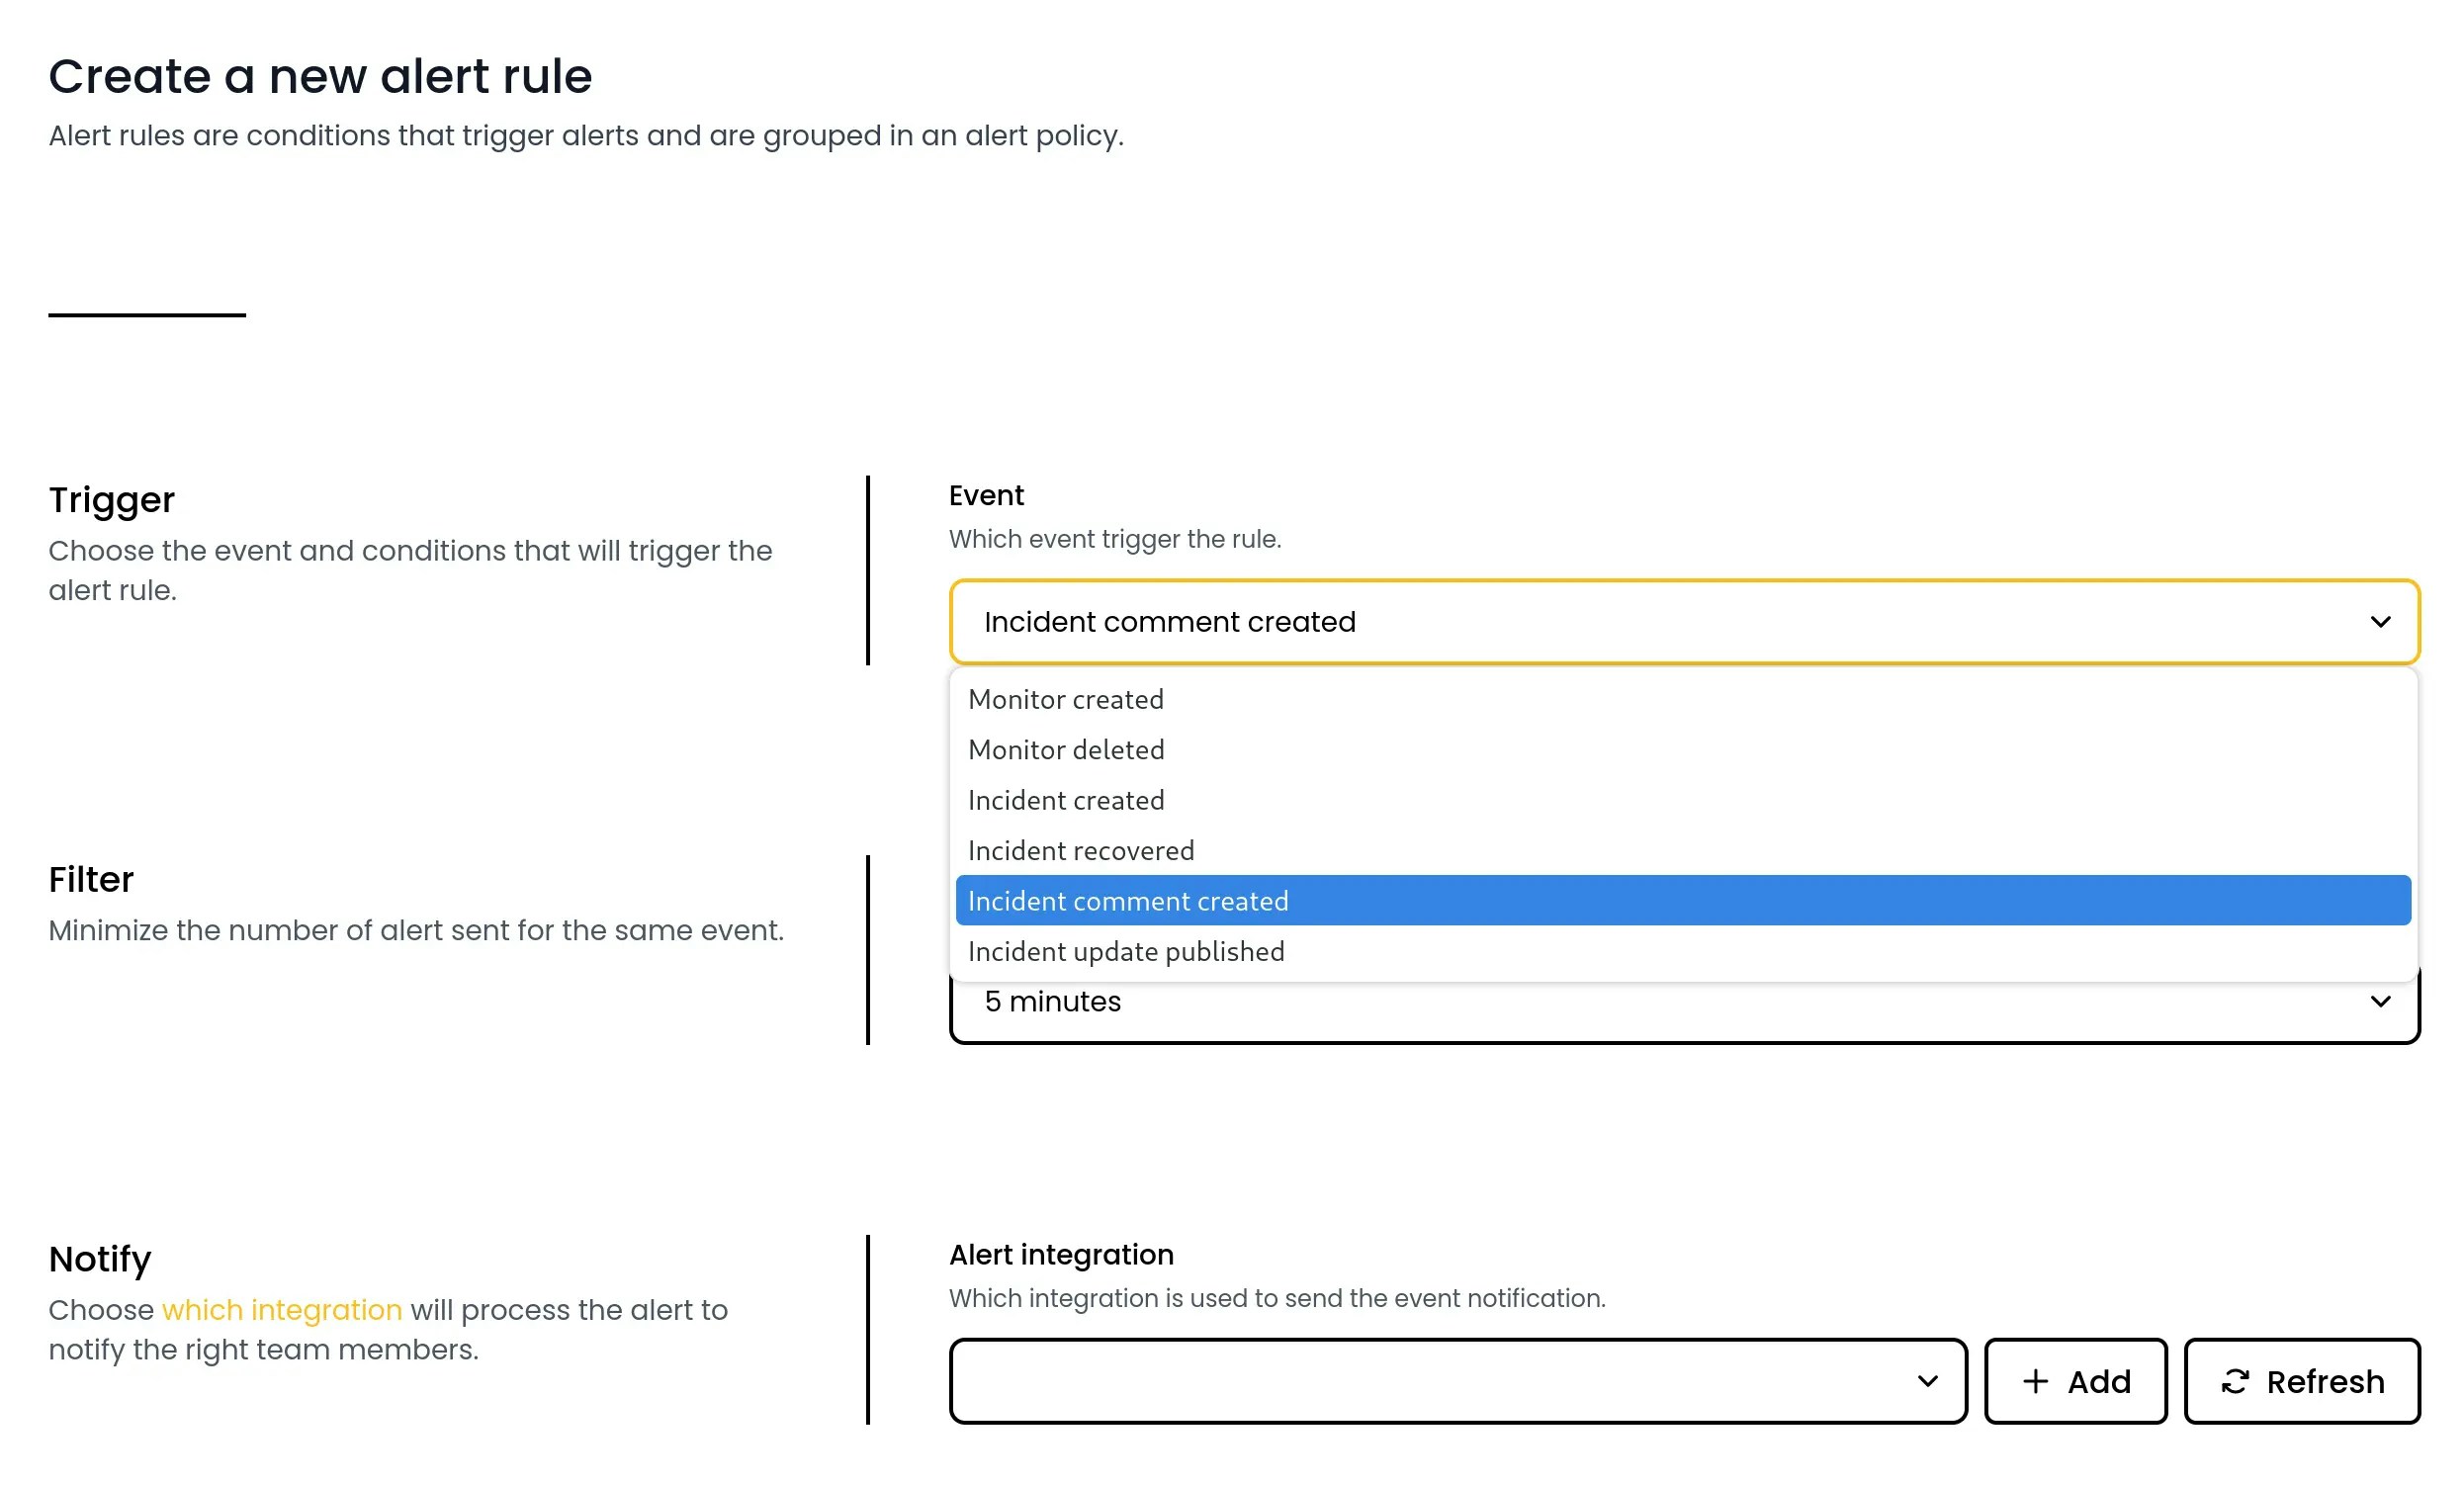
Two new alert rules have been created to let you know when your team is working on resolving an incident. The first one will alert you every time a new comment is published on an incident timeline, and the second when a team member publishes a status update for the incident.
Hosting provider migration
May 2nd, 2024
Phare migrated to a new datacenter managed by Hetzner in Germany. The switch was made on May 2nd and resulted in ~6 minutes of downtime on uptime monitoring and ~10 minutes of downtime on dashboard access. This infrastructure migration was performed to improve speed and reliability of the service.
A lot of work has also been put into disaster recovery, with four times more backup point every day and multi-region (all in Europe) replication.
This ensures that the service can be put back up with the smallest possible downtime in case the current datacenter has a major outage.Last modified on March 29, 2026
