HTTP(s)
When monitoring websites, Phare sends HTTP(s) requests and checks both the status code and (optionally) looks for specific text in the response. If HTTPS is used, Phare automatically keeps an eye on your SSL certificates too, making sure they’re valid and well-configured. You can find more details about the HTTP(s) monitoring settings below.Method
When creating HTTP monitors, you can choose which method to use for your requests. Phare currently supports:- HEAD: Ideal for quick availability checks. Retrieves only headers, saving bandwidth and processing time, perfect for frequent checks on large websites.
- GET: The standard choice for most monitoring. Gets the full page content, allowing you to verify text content and properly test API content or websites that do not support HEAD requests.
- POST, PUT, PATCH: For testing form submissions or API endpoints that require data input. You can customize the request body to simulate real user interactions or API calls.
- OPTIONS: For checking API configuration and CORS policies without triggering data changes. Great for testing API availability without actually using it.
Content-Type header of your choice will be added automatically. You are free to change it if needed.
Skip SSL verification
By default, Phare performs strict SSL certificate validation to ensure secure connections on allhttps:// endpoints. However, if you’re monitoring a staging environment or a server with a self-signed certificate, you can choose to skip SSL verification. When this option is enabled, Phare will ignore SSL issues such as certificate expiration, intermediate certificate chain problems, or OCSP revocation status.
Follow redirects
Phare can automatically follow HTTP redirects (3xx status codes) when this option is enabled. This is particularly useful to test scenarios where redirects are expected, or when monitoring URLs that may change over time. If disabled, Phare will report the initial redirect response, allowing you to monitor the redirection behavior itself. When enabled, the Phare monitoring agent will follow up to 5 redirects before failing the check. Each redirect counts toward the chosen timeout limit, so ensure the timeout is sufficient to accommodate all potential redirects.User agent
Every HTTP request from Phare carries the following user-agent signature:
Mozilla/5.0 (compatible; Phare/1.0; +https://phare.io/products/uptime)
If you add a secret-value to the user agent header for firewall filtering, it will look like this:
Mozilla/5.0 (compatible; Phare/1.0; +https://phare.io/products/uptime; Secret=secret-value)
Headers
Need to get past authentication or test an API with specific requirements? Phare lets you add custom headers to your HTTP monitors. This feature opens up possibilities for:- Testing APIs with authorization tokens
- Bypassing basic authentication on staging environments
- Setting content negotiation preferences
- Adding custom tracking identifiers
To prevent abuse, it is not possible to set a custom
User-Agent header, with the exception of adding a secret value for firewall filtering.Success assertions
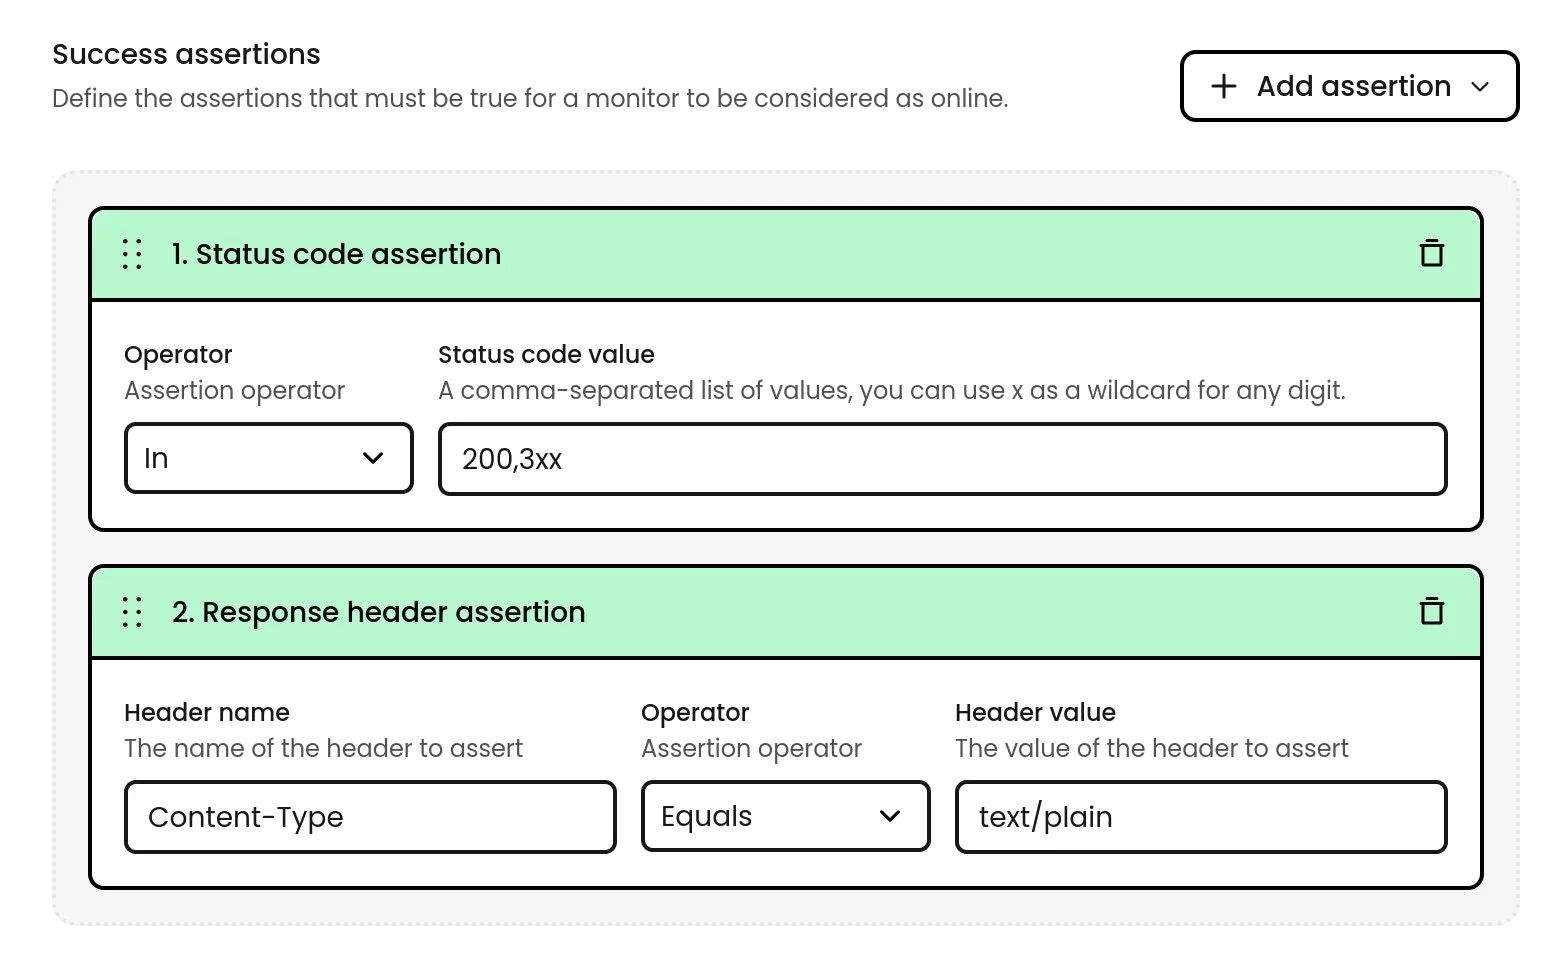
- Status code: Specify exact status codes (
200) or use wildcards (2xx), you can also combine multiple codes (200,3xx). - Response header: Check for the presence of a specific header with a value of your choice.
- Response body: Look for specific text or patterns in the response body to confirm the service is delivering the expected content. Not available with
HEADandOPTIONSmethods.
Response body and response header assertions are performed case-insensitively.
TCP
For services beyond websites, TCP monitoring establishes a direct connection to your server port to make sure everything responds correctly. Phare currently supports plain and TLS connections.Connection
Phare supports plain and TLS connections for TCP monitoring. You can choose the appropriate option based on your service requirements.Interval
You decide how often Phare checks your endpoints. The default is every minute, but you can adjust the frequency to suit your needs, anywhere between 30 seconds and 1 hour.Confirmations & recovery
Nobody likes false alarms. That’s why Phare allows extra checks before creating an incident. A service is only marked as down (or recovered) after a configurable number of consecutive failures (or successes). The default is two confirmations, but you can set this anywhere from one (immediate alerts) to five checks.Regions
With 12 monitoring regions worldwide, Phare lets you check your services from different parts of the globe. It is strongly recommended to use at least two regions, this helps avoid false positives and keeps monitoring resilient even if one region experiences issues.Region list
Region API codes follow the format<continent>-<country>-<iata>.
Asia
Europe
North America
Oceania
South America
Alert rules
Phare’s alert rules system allows you to decide which events trigger notifications. There are a few alert events that can be raised by monitors. The full list is in the alerting documentation.Suggestions
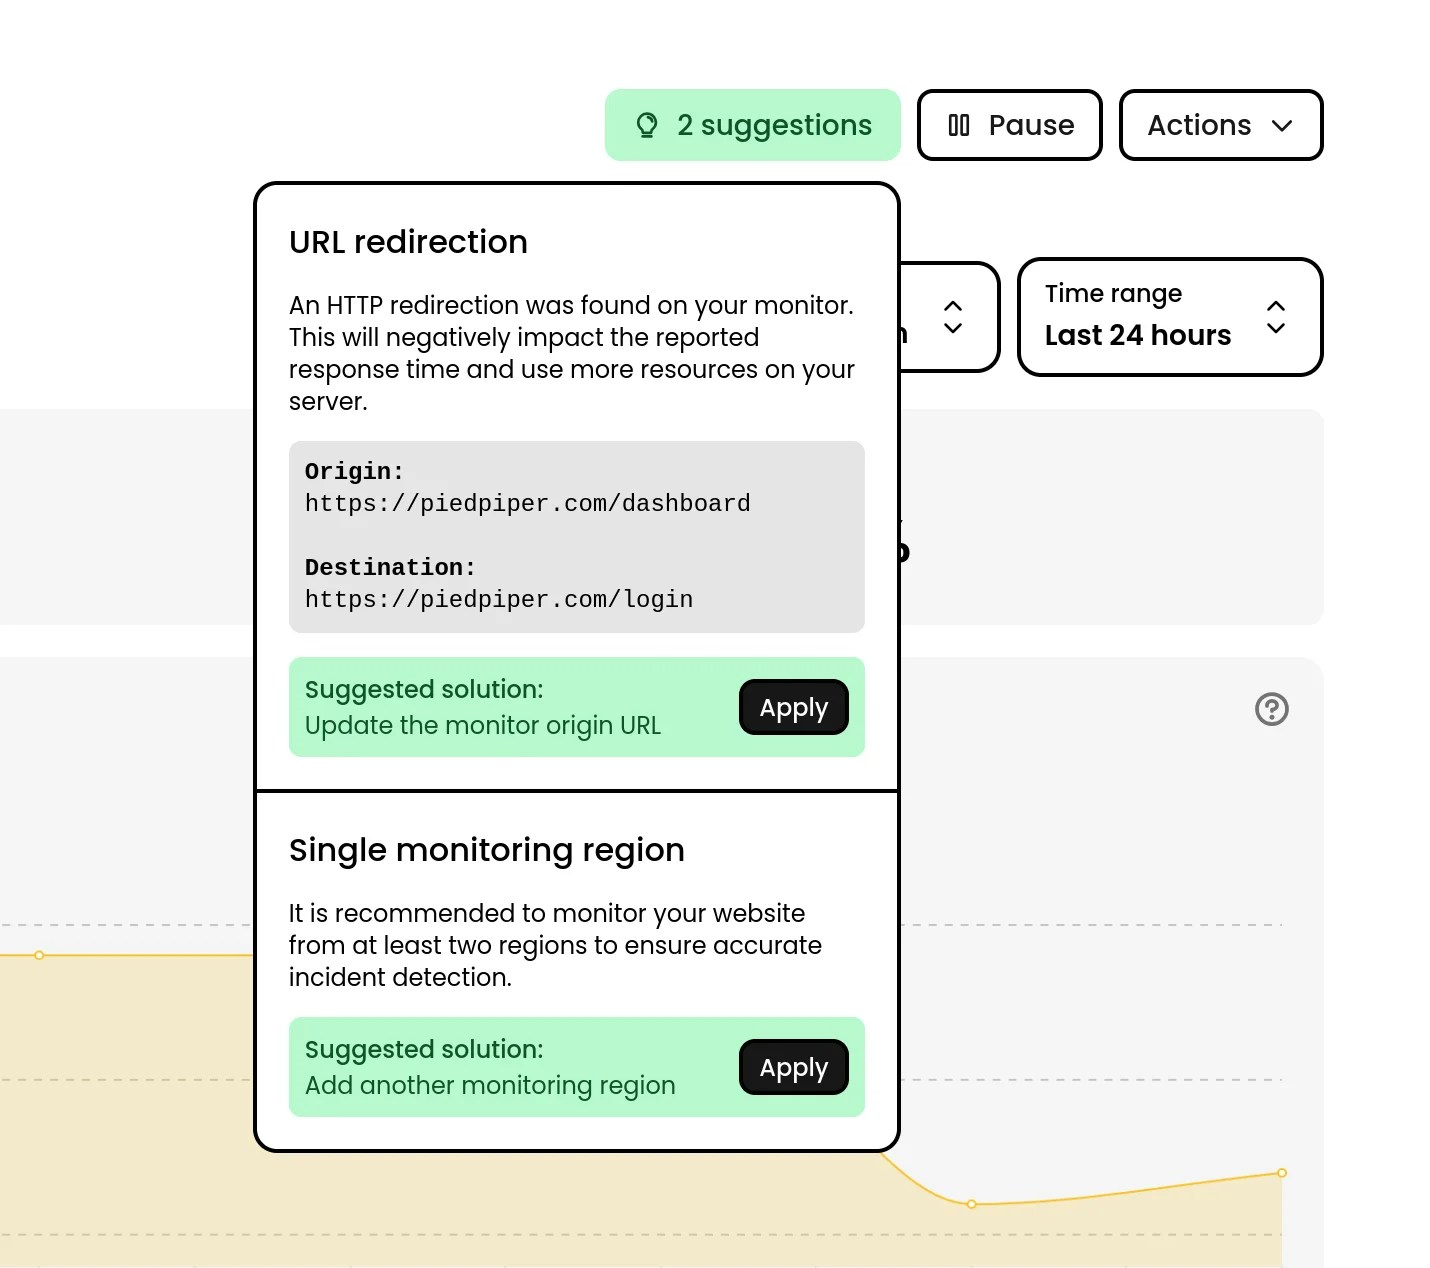
- Adding more monitoring regions for better global coverage
- Increasing confirmation counts to prevent false positives
- Alerting you to redirections that might impact performance reporting
- Recommending more frequent checks for critical services
Statistics
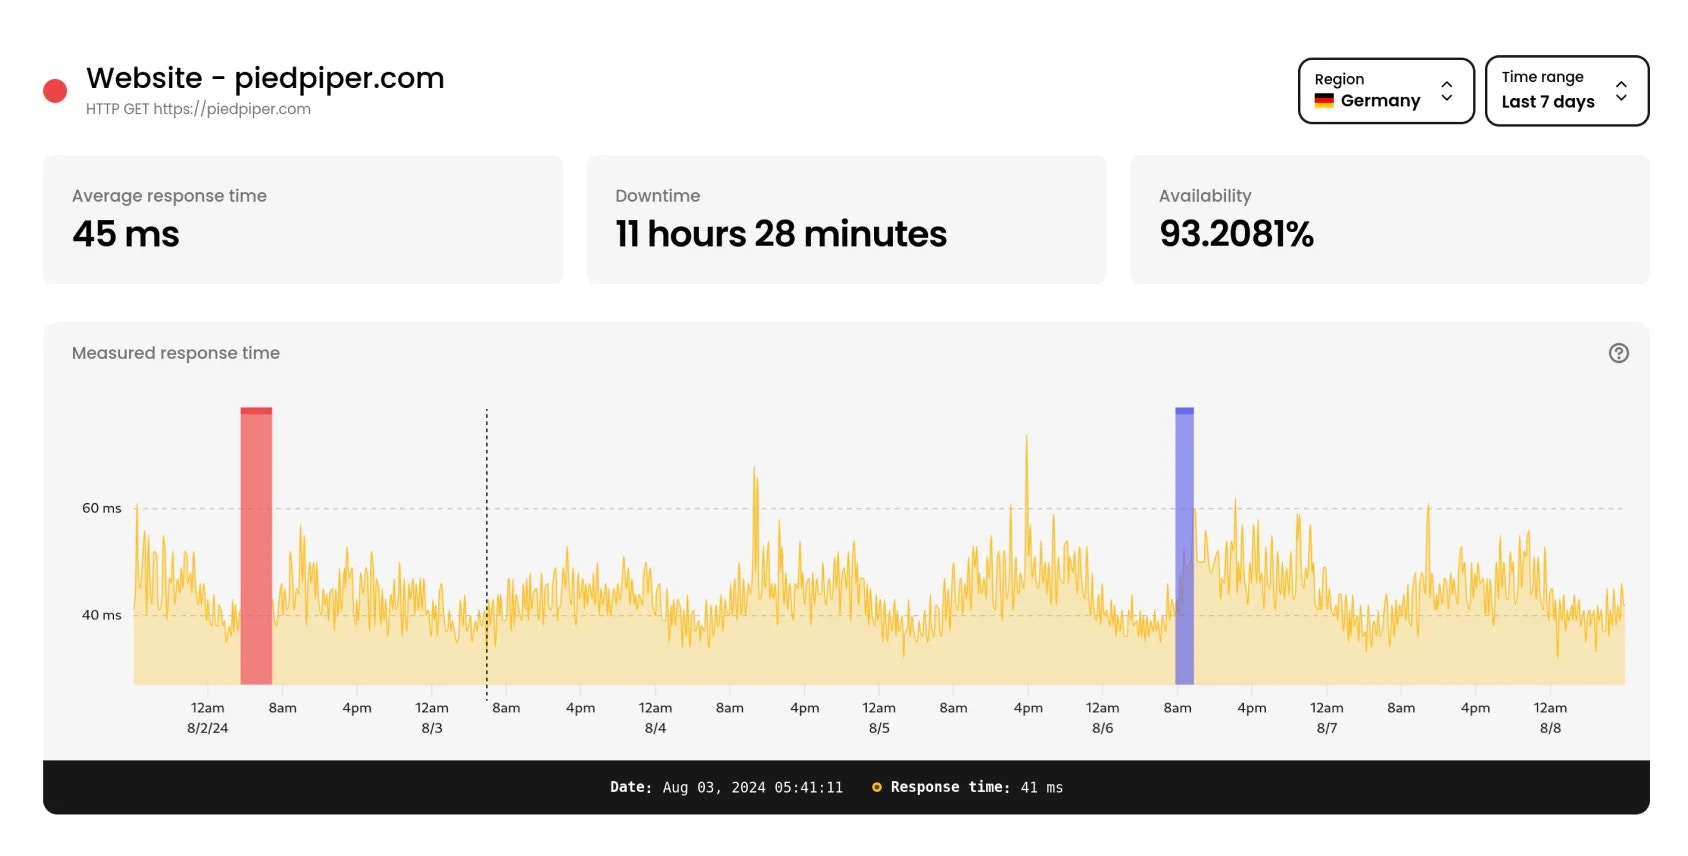
- Performance charts appear shortly after creating a monitor, showing response time trends
- View the performance data by region to spot geographical performance variations
- Zoom in on specific timeframes by clicking and dragging to select portions of the chart
- Track key metrics including average response time, total downtime, and SLA percentages
- Historical data from 24 hours up to 90 days lets you spot both immediate issues and long-term trends
Firewall protection
IP filtering is not reliable because the Phare Uptime monitoring agent is deployed on Bunny.net’s global network, which means IPs could be shared with other Bunny.net customers. The easiest way to filter the Phare Uptime monitoring agent is to use theUser-Agent header. You can also add a secret value to the user agent to make it unique to your organization.
Need something more robust? Contact support.
Private monitoring agent
Need specialized monitoring for complex requirements, large-scale operations, or access through private VPNs? A private monitoring agent can be set up in a preferred region. Contact Phare to discuss specific needs.Good practices
If you’re unsure about the best settings for your monitoring needs, you can find the Best practices to configure an uptime monitoring service on the Phare blog.Limits
Phare’s monitoring infrastructure is built for scale and resilience, but there is one important constraint:- No IP allowlisting: Monitoring traffic comes from Bunny.net’s shared IP ranges, so fixed IPs can’t be provided.